


Abstract
Methods to predict the pharmacokinetics of drugs in humans from in vitro data have been established, but corresponding methods to predict exposure to circulating metabolites are unproven. The objective of this study was to use in vitro methods combined with static and dynamic physiologically based pharmacokinetic (PBPK) models to predict metabolite exposures, using midazolam and its major metabolites as a test system. Intrinsic clearances (CLint) of formation of individual metabolites were determined using human liver microsomes. Metabolic CLint of hydroxymidazolam metabolites via oxidation and glucuronidation were also determined. Passive diffusion intrinsic clearances of hydroxymidazolam metabolites were determined using sandwich cultured human hepatocytes and the combination of this term along with the metabolic CLint, and liver blood flow was used to estimate the fraction of the metabolite that can enter the systemic circulation after formation in the liver. The metabolite/parent drug area under the plasma concentration-time curve ratio (AUCm/AUCp) was predicted using a static model relating the fraction of midazolam clearance to each metabolite, the clearance rates of midazolam and hydroxymidazolam metabolites, and the availability of the metabolites. Additionally, the human disposition of midazolam metabolites was simulated using a SimCYP PBPK model. Both approaches yielded AUCm/AUCp ratios that were in agreement with the in vivo ratios. This study shows that in vivo midazolam metabolite exposure can be predicted from in vitro data and PBPK modeling. This study emphasized the importance of metabolite systemic availability from its tissue of formation, which remains a challenge to quantitative prediction.
Introduction
Xenobiotic substances such as drugs undergo different mechanisms of clearance from the human body with metabolism representing the most prevalent. In almost all cases, metabolites are more hydrophilic than the parent molecule and can thus be subsequently eliminated by excretory organs. Biotransformation reactions can result in the formation of chemically stable metabolites with pharmacological or toxicological activity. Numerous examples of drugs with active metabolites were classified in recent studies (Fura, 2006; Kang et al., 2010; Obach, 2013), which emphasize the role of active metabolites in the contribution to the overall efficacy of drugs. Likewise, the fact that some drugs can also generate toxic metabolites has raised concerns about the safety issue of drug metabolites in humans (Baillie et al., 2002; Smith and Obach, 2006). Finally, there have been a few instances of drug metabolites causing drug-drug interactions via inhibition of cytochrome P450 enzymes [e.g., gemfibrozil glucuronide (Ogilvie et al., 2006), hydroxyitraconazole (Isoherranen et al., 2004)]. Therefore, it is important to identify major human drug metabolites and understand their dispositional properties to aid assessment of their contribution to efficacy or adverse effects.
The use of in vitro methods to provide input data for the quantitative prediction of in vivo pharmacokinetic behavior has become a routine practice of modern pharmaceutical research to select candidate compounds (Di et al., 2013). These in vitro methodologies including in vitro-in vivo extrapolation have been coupled with physiologically based pharmacokinetic (PBPK) models to allow prediction not limited to summary pharmacokinetic parameters (i.e., CL, Vd, t1/2, F), but also to generate exposure profiles (in plasma and organ compartments) that can provide comprehensive aspects of drug pharmacokinetic processes (Rostami‐Hodjegan, 2012). Although the utility of such modeling and in vitro data to predict pharmacokinetics of parent drug is well established, not as much attention has been paid to project the pharmacokinetics of drug metabolites. In one report by Lutz and Isoherranen (2012), the exposure to metabolites of dextromethorphan and omeprazole were successfully extrapolated from in vitro data.
It is recognized that many kinetic and physiologic factors can determine the extent to which a metabolite is formed and circulates in human plasma (Fig. 1). Within the tissues of formation (e.g., enterocytes, hepatocytes), metabolites may be subjected to subsequent elimination via further metabolism, biliary, and/or renal excretion. Therefore, the in vivo disposition of a metabolite depends on its extent of formation and rate of elimination (Rowland and Tozer, 2005). In hepatocytes, not only metabolic enzymes but sinusoidal and canalicular efflux transporters may also be involved in metabolite clearance. Protein binding is another important determinant in metabolite exposure. In most cases, biotransformation of a drug generates more soluble metabolites, which results in reduced lipophilicity, and in turn, decreases its protein binding relative to the parent drug. To understand the contribution of major metabolites to efficacy or toxicity, not only is the exposure relative to parent important, but the need to adequately describe the time courses of metabolites should be taken into consideration.

Within the hepatocyte, the unbound drug is subjected to metabolism to form metabolite M1. The unbound metabolite M1 leaves the hepatocyte via blood or bile or is subjected to sequential metabolism. In addition to blood perfusion, protein binding, transport into the bloodstream, and subsequent elimination represent a complex interplay of potential processes that can impact the in vivo exposure of metabolite M1.
The underlying pharmacokinetic principles for metabolites were developed by Houston (1981). The relative exposure to metabolites formed from a parent drug will depend on specific metabolite kinetic parameters, such as fraction of drug converted to the metabolite, the clearance of metabolite and drug, and the metabolite systemic availability. When a drug is administered by a rapid intravenous bolus, the relative exposure of a metabolite to its parent drug was derived as follows: (1)where Fm is the systemic availability of the metabolite from its organ of generation, fm is the fraction of parent drug converted to a specific metabolite, and CLp and CLm are the total body clearance of the parent drug and its metabolite, respectively. The equation was derived on the assumption that the liver is the only organ of drug elimination and that the linear disposition of parent drug and the metabolite can be represented by simple one-compartmental models.
In this report, we describe the prediction of the exposure to two primary CYP3A generated metabolites of midazolam, 1′- and 4-hydroxymidazolam. These were chosen as drug/metabolite examples because midazolam and 1′-OH midazolam have been the subjects of extensive pharmacokinetic and metabolism studies (Heizmann and Ziegler, 1981; Heizmann et al., 1983; Mandema et al., 1992; Bauer et al., 1995; Nordt and Clark, 1997). In vitro systems for metabolic and transporter hepatic clearance prediction were used, coupled with PBPK modeling, with an aim to develop a rational approach for predicting human plasma pharmacokinetics of drug metabolites following administration of the parent drug.
Materials and Methods
Materials
Midazolam was purchased from USP Reference Standard (Rockville, MD). 1′-hydroxymidazolam, 4-hydroxymidazolam, D4-1-hydroxymidazolam were prepared under contract by Cerilliant (Austin, TX). Pooled human liver microsomes (lot number HLM102, mixture of both sexes) were prepared under contract from BD Biosciences, Woburn, MA. In VitroGro-HT (thawing), In VitroGro-CP (plating), and In VitroGro-HI (incubation) hepatocyte media were purchased from Celsis In Vitro Technologies Inc. (IVT) (Baltimore, MD). Hanks’ balanced salt solution (HBSS) was purchased from Invitrogen (Carlsbad, CA). BioCoat 24-well plates and Matrigel were purchased from BD Biosciences (Bedford, MA). The BCA Protein Assay Kit was from Pierce Biotechnology (Rockford, IL). Cryopreserved human hepatocytes (Lot #HH1026, female donor) were purchased from In Vitro ADMET Laboratories (Columbia, MD). Other reagents and solvents used were from standard suppliers and were of reagent or HPLC grade.
Instrumentation and Analytical Method
Analyses of substrate and metabolites were performed by liquid chromatography/tandem mass spectrometry (LC-MS/MS). The HPLC consisted of an Agilent model 1290 binary pump. Mobile phases were 0.1% formic acid in water (mobile phase A) and 0.1% formic acid in acetonitrile (mobile phase B). The following gradient elution was used: mobile phase B started at 10% (0.8 minutes), then increased to 90% B after 1.2 minutes, and returned to 10% B after 1.7 minute, and held (2.0 minutes total). The chromatographic separation was carried out on a Phenomenex Kinetex C18 100Å 30 × 2.1 mm column with a flow rate of 0.5 ml/min. The injection volume was 10 µl.
Mass spectrometric detection was performed using an AB mass spectrometer, model Triple Quad 5500 (Applied Biosystems/Sciex, Thornhill, Ontario, Canada). The TurboIonSpray interface was operated in the positive ion mode at 5500 V and 500°C. Quadrupoles Q1 and Q3 were set on unit resolution. Multiple-reaction-monitoring mode using specific precursor/product ion transitions was used for quantification. Detection of the ions was performed by monitoring the transitions of mass/charge ratio (m/z) with collision energy of 30 eV as follows: midazolam (326 → 291); 1′-OH midazolam (342→324); 4-OH midazolam (342→234) and D4-1′-OH midazolam (internal standard, IS) (346→328).
Stock solutions of midazolam, 1′-OH midazolam and 4-OH midazolam were prepared in methanol. 1′-OH and 4-OH midazolam were quantitated from standard curves ranging from 0.5 to 1000 nM. Linear regression was fitted to data of 1′-OH and 4-OH midazolam standards using 1/x2 weighting. Data processing was performed using Analyst software (version 1.6.2, Sierra Analytics LLC).
In Vitro Microsomal Incubations
Midazolam Metabolite Formation Approach.
Experimental procedure.
The kinetics of 1′-OH and 4-OH midazolam metabolite formation were determined using pooled human liver microsomes (HLM). Before enzyme kinetic measurements, the linearity of the relationship between metabolite formation and the enzyme quantity and reaction time was determined. The experiments were performed in triplicate in 96-well plates. For enzyme kinetic measurements, microsomes (0.1 mg/ml) were mixed with buffer (100 mM KH2PO4, pH 7.4) containing MgCl2 (3.3 mM) and NADPH (1.3 mM) and preincubated to 37°C in 5 minutes in a 96-well temperature-controlled heater block. The incubations were then initiated with the addition of midazolam stocks (12 final substrate concentrations from 1 to 400 µM) to a final volume of 0.3 ml and maintained at 37°C for 5 minutes. Final methanol concentration was less than 1% (v/v). All microsomal incubations were quenched by the addition of an aliquot of incubation mixture (50 µl) into 200 µl of acetonitrile containing internal standard (D4-1′-OH midazolam) (0.05 µM), and centrifuged at 3000 rpm for 5 minutes. Supernatant was transferred to a clean 96-well plate for LC-MS/MS analysis.
Data analysis.
Reaction velocities at different substrate concentrations were initially transformed for Eadie-Hofstee plots to assess linearity and diagnose the appropriate enzyme kinetic model with which to fit the data. Vmax and Km values for product formation were determined by nonlinear regression of the reaction velocity versus midazolam initial concentrations using GraphPad Prism (version 6.03; San Diego, CA). Best-fit models were selected on the basis of the Akaike Information Criterion.
Substrate Depletion Approach.
Oxidation assay incubation.
Intrinsic clearances of midazolam metabolites due to sequential metabolism via CYP-mediated oxidation pathway were estimated by the depletion of substrate at a well-below Km concentration. Incubations were carried out in HLM (0.5 mg/ml) in 100 mM KH2PO4, pH 7.4, containing 3.3 mM MgCl2 and 1.3 mM NADPH. Incubation mixtures were prewarmed to 37°C in a 96-well temperature-controlled heater block. Reactions were commenced by adding substrate stock solutions (0.1 µM final concentration) to a volume of 1 ml. At times of zero, 5, 10, 20, 30, 45, and 60 minutes postcommencement of the incubation, 50 µl aliquots were removed and added to 200 µl of acetonitrile containing 0.05 µM IS (D4-1′-OH midazolam). Samples were centrifuged at 3000 rpm for 5 minutes and analyzed by LC-MS/MS.
Glucuronidation assay incubation.
In experiments of midazolam and its metabolite intrinsic clearances where glucuronidation pathway was investigated, a premix containing HLM (2 mg/ml) was mixed with 100 mM Tris-HCl buffer (pH 7.5 at 37°C), MgCl2 (5 mM), UDPGA (5 mM), alamethicin (10 µg/ml), and 2% bovine serum albumin. The premix was placed on ice for 15 minutes to allow alamethicin pore formation, and then aliquots of this mixture were delivered to reaction vials and maintained at 37°C in heater block. Similar to oxidation assay, incubations were commenced with the addition of substrate (0.1 µM final concentration) to a final incubation volume of 2 ml and incubated at 37°C in 4 hours. At different time points (0, 10, 20, 30, 60, 90, 120, 150, 180, 210, and 240 minutes), 50 µl of incubation sample was quenched by the addition of 200 µl acetonitrile that contained 0.05 µM of IS. The terminated incubation mixtures were then centrifuged and directly injected for LC-MS/MS analysis.
Data analysis.
The analyte/internal standard peak area ratios were determined and converted to the percentage of substrate remaining, using the value at t = 0 as 100%. The log percentage of substrate remaining versus time curves was fitted using linear regression. The slope of the linear regression was used to calculate apparent intrinsic clearance, as described previously (Obach, 1999).
Equilibrium Dialysis
Nonspecific binding to microsomal incubation components and plasma protein binding were investigated using equilibrium dialysis. Double cellulose dialysis membranes were soaked in distilled water, then in 30% ethanol solution and rinsed with distilled water, and the two membranes could be separated. The separated dialysis membranes were placed in between the individual Teflon bars of standard 96-well equilibrium dialysis device (HTDialysis, model HTD 96a; Gales Ferry, Connecticut). Midazolam, 1′-OH, and 4-OH midazolam metabolites were mixed with HLM at protein concentrations used for the respective metabolic incubations, 100 mM KH2PO4, pH 7.4 and MgCl2 (3.3 mM). For microsomal protein binding in UGT assay, substrates were spiked in HLM, 100 mM Tris-HCl buffer (pH 7.5 at 37°C), MgCl2 (5 mM), alamethicin (10 µg/ml), and 2% bovine serum albumin. The mixtures (150 µl) were loaded into the donor compartment of the equilibrium dialysis device. Aliquots of corresponding blank buffer mix (150 µl) were placed into the receiver compartments. Dialysis experiments were performed in quadruplicate. After 4 hours of incubation in an incubator (5% CO2, 75% relative humidity) on a shaker, the microsomes and buffer samples were removed. Microsomal samples (15 µl) were mixed with control buffer (45 µl), and buffer samples (45 µl) were mixed with control microsomes (15 µl) to yield an identical matrix before sample was precipitated by 180 µl cold acetonitrile containing 0.05 µM IS. After centrifugation, supernatant was withdrawn for LC-MS/MS analysis. Drug recovery and stability through the dialysis procedure was also determined by analyzing samples of the mixtures that were not subjected to dialysis.
Plasma protein fraction unbound was determined using a similar procedure, except that plasma was thawed and adjusted to pH 7.4 before the addition of test compounds.
Sandwich Cultured Human Hepatocytes
Experimental Procedure.
The hepatocytes were cultured in a sandwich format as reported previously (Jones et al., 2012). On day 5 of sandwich cultured human hepatocytes (SCHH) culture, the hepatocytes were first rinsed twice and preincubated for 10 minutes with fresh 37°C regular HBSS buffer or regular HBSS buffer in the absence or presence of 100 µM rifamycin SV or Ca2+/Mg2+-free HBSS containing 1 mM EGTA. After aspirating the preincubation buffer, 0.5 ml of incubation buffer containing substrate at 1 µM with or without rifamycin SV was added to the appropriate wells. At specific time points (0.5, 1, 2, 5, 10, and 15 minutes), sample plates were washed three times by adding 0.5 ml of ice cold standard HBSS after removal of the incubation buffer. The hepatocytes were lysed with acetonitrile containing the internal standard for LC-MS/MS analysis. Rosuvastatin was used as a positive control in all experiments. The amount of protein in each well was determined using the BCA protein assay (Pierce Biotechnology).
SCHH Data Analysis.
The concentrations of accumulated substrates in hepatocytes were calculated based on standard curves in which a series of substrate standard dilutions were treated similar to the assay plates. The apparent intrinsic uptake clearances (µl/min/mg protein) (total uptake and passive diffusion) were determined from the slopes of the plot of uptake concentration in cells without and with rifamycin SV in regular HBSS buffer versus time using linear regression. The biliary excretion (CLint, bile) was calculated based on the difference between the concentrations of substrate in cells incubated with regular HBSS and Ca2+/Mg2+-free HBSS at 10 minutes of incubation. On the basis of data that 106 cells is equivalent to 1.02 mg protein (Jones et al., 2012), the unit of CLint, uptake was then converted to microliters per minute per 106 cells and scaled to the whole liver using scaling factors of 120 × 106 cells/g liver and 20 g liver/kg body weight (Barter et al., 2007).
Prediction of Metabolite Systemic Availability
Once formed in the liver, the metabolite may undergo sequential elimination via further metabolism and/or biliary excretion before reaching the systemic circulation. The fraction of metabolite escaping elimination by the liver, metabolite systemic availability (Fm), may be estimated considering the parameters of metabolite elimination intrinsic clearance, permeability, protein binding, and blood flow.
When no hepatic transporters are involved and the passive diffusion of metabolite out of the liver is the rate limiting step (i.e., low permeability), the systemic availability of metabolite was predicted based on the model of competing rates: metabolic intrinsic clearance and passive diffusion intrinsic clearance as described in eq. 2: (2)When the passive diffusion of metabolite is not the rate limiting step (i.e., CLint, pass > > Qh) and metabolite elimination is rate-limited by perfusion, the systemic availability of metabolite was predicted by using the well-stirred liver model for metabolite:
 (3)In a healthy adult, hepatic blood flow (Qh) is ∼21 ml/min/kg. The free fraction in blood (fuB) is the free fraction in plasma (fup) corrected by the blood-to-plasma ratio.
In general cases, the Fm model was established to accommodate the interplay between passive diffusion and sequential metabolism processes of primary metabolite in liver, versus hepatic blood flow, which is adapted from the “Qgut” model developed by Yang et al. (2007).
 (4)
(4)Static Model of AUCm/AUCp
The in vivo metabolite/parent AUC ratios after intravenous administration of midazolam were predicted from in vitro data using the theoretical model developed by Houston (1981) (eq. 1): After oral administration, because of the significant contribution of intestinal mucosa and liver to the first-pass metabolism of midazolam (Paine et al., 1996; Thummel et al., 1996), the static model of Houston (1981) was modified to consider the first-pass metabolite formation in enterocytes and hepatocytes. Primary metabolite formed within the gut lumen suffers sequential intestinal first-pass metabolism and is ascribed the available fraction, Fm,g. This fraction of metabolite may enter the liver for further processing and be available at the fraction of (1-Eh,m) × Fm,g, in which Eh,m is the hepatic extraction ratio of metabolite generated in intestine and presented to the liver.
The total amount of metabolite in the body can be defined as the sum of 1) metabolite formed in intestine during drug absorption and escapes further gut and liver metabolism, 2) metabolite formed from absorbed drug that is not metabolized in intestine (Fg) during parent first-pass in the liver and that metabolite escapes sequential liver metabolism, and 3) metabolite formed from systemic clearance.
Utilizing this scheme, the AUCm after oral administration can be defined as: (5)Where Fm,g is the fraction of metabolite escaping first-pass gut metabolism after formation from parent in the gut wall. Likewise, Fm is the fraction of metabolite formed in the liver escaping sequential elimination by the liver. fm,g and fm are the fractions of parent drug converted to a specific metabolite in the intestine and liver, respectively. Fa is the net fraction of parent drug absorbed from the intestinal tract, Fg is the fraction of parent drug that escapes intestinal first-pass metabolism in the enterocytes, Fh is the fraction of dose that escapes hepatic first-pass metabolism.
By definition: (6)Substituting eq. 6 and rearranging eq. 5 yields:
 (7)Equation 7 may also be rearranged to give a ratio of areas,
 (8)Fraction of midazolam converted to a specific metabolite in liver (fm) was predicted as the ratio of the intrinsic clearance that forms that metabolite versus the total metabolic intrinsic clearance of parent drug. The intrinsic activities of gut and liver CYP3A was observed to be similar (von Richter et al., 2004; Yang et al., 2004; Gertz et al., 2010). Therefore, fractions of midazolam converted to two primary CYP3A metabolite in intestine (fm,g) were assumed to be identical to their fm values in the liver (Paine et al., 1997). With relative low expression of UGT enzymes in gut, fraction of 1′ and 4-OH midazolam metabolites escaping sequential metabolism after the formation in gut, Fm,g, was assumed to be 1.
Hepatic extraction ratio of metabolite, Eh,m, was predicted from in vitro total clearance of metabolite (CLm/Qh). Fraction of parent drug that escapes first-pass elimination in the liver, Fh, was predicted from in vitro total clearance of parent (Fh = 1 − CLp/Qh).
Fraction of midazolam escaping intestinal first-pass metabolism, Fg, was calculated by using “Qgut” model (Yang et al., 2007), Qgut value of 16.6 l/h (Gertz et al., 2010) and in vitro intestinal CLint, u,gut (l/h). Midazolam CLint,u,gut was obtained from HLM CLint, u, met (µl/min/mg) via hydroxylation pathways after normalizing for CYP3A abundance of 137 pmol/ mg microsomal protein in liver. Normalized CLint,u, CYP value (µl/min/pmol CYP3A) was then scaled to total gut by using enzyme content of 70,000 pmol P450/ total gut (Paine et al., 1997; von Richter et al., 2004; Yang et al., 2004). The total body clearance of parent (CLp) and metabolite (CLm) was predicted from in vitro intrinsic metabolic clearances using the well-stirred model.
PBPK Modeling and Simulations
PBPK models for midazolam, 1′-OH midazolam and 4-OH midazolam were developed to simulate the metabolite dispositions after intravenous and oral administration of midazolam using the population-based ADME simulator Simcyp (version 14; Simcyp Ltd., Sheffield, UK). Simulations were performed for a virtual population of 100 (10 trials × 10 subjects each) healthy volunteers aged between 20 and 50 with a male/female ratio of 50/50. For midazolam, a minimal PBPK model was developed assuming perfusion-limited distribution with parameter values listed in Table 1. LogP of 2.95 and blood-to-plasma ratio were obtained from literature. The absorption model was first order, with absorption rate constant obtained from Heizmann et al. (1983). The volume of distribution at steady-state Vss was 0.8 l/kg (Heizmann et al., 1983). Enzyme kinetics information using HLM (CYPs and UGTs) was selected for midazolam metabolism. The PBPK model parameters for 1′-OH and 4-OH midazolam were tabulated in Table 1. Physicochemical properties (MW, pKa, log P) were calculated using ACD program. The Vss values for 1′-OH and 4-OH midazolam (1.8 and 2.2 l/kg, respectively) were predicted using the mechanistic method developed by Poulin and Theil (2002). In vitro intrinsic clearance (CLint,met, µl/min/mg) and fumic values were measured experimentally from this study and assigned for 1′-OH and 4-OH midazolam enzyme kinetics. The predicted plasma concentration time profiles of midazolam and its metabolites and their AUCm/AUCp ratios were compared with observed data for model verification.
Parameters for midazolam, 1′-OH midazolam, and 4-OH midazolam used in PBPK modeling
Local Sensitivity Analysis
Sensitivity analysis was performed to identify which parameters must be known with the greatest precision to most accurately predict AUCm of 1′-OH midazolam. This analysis may be used to determine which in vitro studies should be conducted to obtain estimates of critical parameters or which parameters can be assumed or predicted by in silico methods. Parameters were investigated including 1′-OH midazolam formation intrinsic clearance, elimination intrinsic clearance, plasma protein binding, blood-to-plasma ratio, and logP. The dose metrics to be examined were AUC and Cmax of 1′-OH midazolam after oral administration of parent drug. The sensitivity of 1′-OH midazolam AUC and Cmax to 0.1% changes in the mean values of selected parameters using Simcyp (version 14; Simcyp Ltd.). Sensitivity coefficients were then normalized to both the parameter and model output values. The normalized sensitivity coefficients were used to rank the importance of parameters on the output variables (Brun et al., 2001; Soetaert and Petzoldt, 2010).
Clinical Data Used for Model Verification
After intravenous administration in humans, midazolam is rapidly and widely distributed with a steady-state volume of distribution of around 1 l/kg (Smith et al., 1981; Heizmann et al., 1983). After oral dosing to human volunteers, midazolam is absorbed rapidly and almost completely from the gastrointestinal tract (Heizmann et al., 1983; Mandema et al., 1992). Midazolam is eliminated from the body almost exclusively by metabolic processes (Heizmann and Ziegler, 1981). The mean intestinal extraction ratios calculated for liver and intestine were comparable (mean 0.43), suggesting that there is a significant contribution by the intestine to the overall first pass (Thummel et al., 1996).
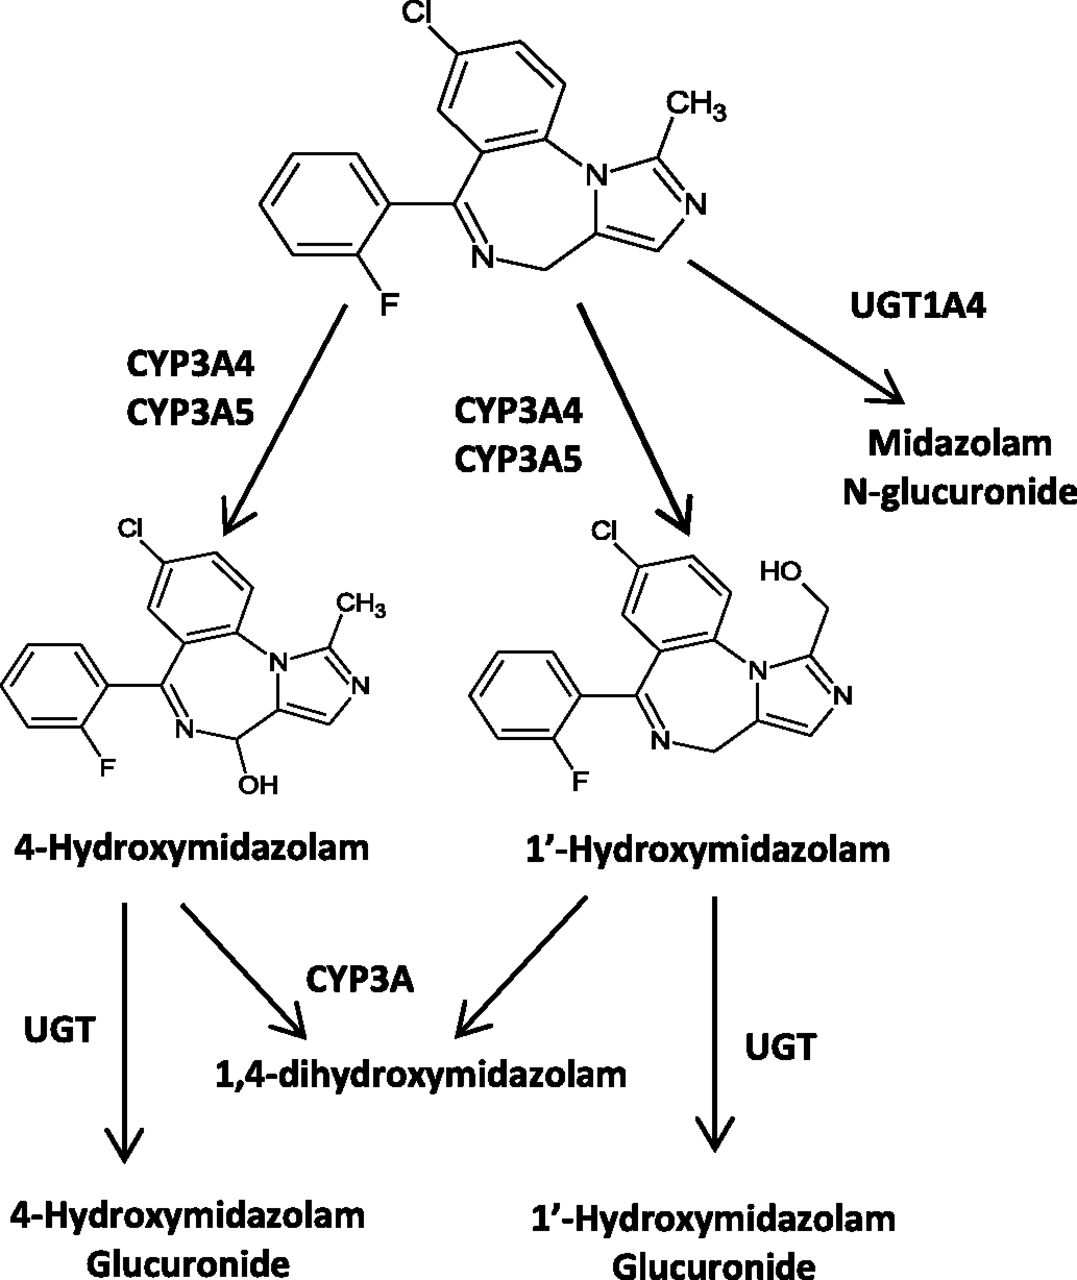
In HLM, midazolam is predominantly metabolized by CYP3A4 and 3A5 to two primary metabolites, 1′-OH midazolam and 4-OH midazolam, and is further metabolized to glucuronide conjugates by UGT (Fig. 2) (Kronbach et al., 1989; Klieber et al., 2008; Seo et al., 2010). Plasma concentrations of the main hydroxylated metabolite, 1′-OH midazolam, are relatively high, representing 40–100% of unchanged drug (Heizmann et al., 1983). However, the hydroxylated metabolites are quickly metabolized and excreted from the body as conjugates. The observed plasma concentration-time profiles of midazolam and 1′-OH midazolam were obtained from literature and used to verify the models (Heizmann et al., 1983; Clausen et al., 1988; Mandema et al., 1992; Kupferschmidt et al., 1995; Backman et al., 1998; Tsunoda et al., 1999; Knoester et al., 2002; Eap et al., 2004; Kharasch et al., 2004; Chung et al., 2006; Farkas et al., 2007; Link et al., 2008).

Metabolic scheme of midazolam in humans.
Results
In Vitro Metabolism of Midazolam for Total Clearance of Parent Estimation
In HLM, midazolam is initially converted to 1′-OH and 4-OH metabolites via CYP3A-mediated hydroxylation. Midazolam also undergoes the glucuronidation pathway to generate midazolam glucuronide.
The enzyme kinetic data describing 1′-OH- and 4-OH midazolam formation are shown in Fig. 3. In HLM, there was a substantial decrease in velocity for the formation of 1′-OH metabolite at high substrate (midazolam) concentration. When the data are transformed to Eadie-Hofstee plots, they exhibit curved lines (concave down) instead of straight lines. Therefore, the data were described by Michaelis-Menten kinetics with substrate inhibition using the equation: in which Vmax is the maximal velocity, Km is Michaelis constant for enzyme activity, and Ki is the inhibition constant for a substrate inhibition.

Characterization of in vitro formation of 1′-OH midazolam and 4-OH midazolam from midazolam saturation experiment in pooled HLM.
The Michaelis-Menten constants for 1′-OH- and 4-OH midazolam formation and overall in vitro metabolic clearances of midazolam corresponding to each pathway were listed in Table 2. The extent of microsomal binding was also shown in Table 2 for each compound and used to correct for nonspecific binding to incubation mixture of total intrinsic clearances. These kinetic data indicate that midazolam can be metabolized by two enzymes that yield two different products, in which low Km enzyme is involved in 1′-OH metabolite formation and high Km enzyme catalyze the 4-OH midazolam formation. These findings are in good agreement with the values reported in literature (Ghosal et al., 1996; Patki et al., 2003; Walsky and Obach, 2004). The results showed that the intrinsic clearance for 1′-OH formation is substantially greater than that for 4-OH formation.
Kinetic characterization of midazolam and primary metabolites (1′-OH and 4-OH midazolam) metabolism in HLM
In addition to hydroxylation by CYP enzymes, midazolam is metabolized by HLM via direct glucuronidation to midazolam glucuronide; however, this pathway is minor relative to hydroxylation. The intrinsic clearance via glucuronidation pathway was determined from the depletion profile of midazolam under incubation conditions designed for UGT activity (Fig. 4). The scattered pattern in these data do not have impact on the overall model conclusion because the fm(MDZ-glucuronide) is low relative to midazolam hydroxylation. Overall, the results showed that the intrinsic clearance (CLint,u,met) for 1′-OH formation is substantially greater than that for 4-OH and midazolam glucuronide, indicating 1′-hydroxylation is the dominant pathway in midazolam metabolism. The intestinal intrinsic clearance values of midazolam CLint,u,gut were calculated from HLM CLint,u,met and listed in Table 2. The net midazolam intestinal CLint,u,gut is less than 1% of that in the liver.

Depletion of midazolam via glucuronidation pathway in HLM.
In Vitro Metabolism of 1′-OH and 4-OH Midazolam for Total CLm of Metabolite
1′-OH midazolam and 4-OH midazolam were incubated separately in HLM using NADPH or UDPGA as cofactor (Fig. 5). Results showed that 1′-OH midazolam was mainly further metabolized via glucuronidation pathway with the unbound intrinsic clearance of 174 ml/min/kg (Table 2). 1′-OH midazolam also undergoes 4-hydroxylation, but to a lesser extent than the glucuronidation pathway (CLint,u of 10.2 ml/min/kg). In contrast, 4-OH midazolam was mainly converted to 1′,4-diOH midazolam with the unbound intrinsic clearance of this pathway at 164 ml/min/kg, whereas the intrinsic clearance for glucuronidation was 19.1 ml/min/kg. This finding is consistent with previous data reported by Ghosal et al. (1996), in which the intrinsic clearance for the formation of 1′,4- diOH midazolam from 1′-OH midazolam was 15 times slower than formation from 4-OH midazolam in a study using cDNA-expressed human CYP3A4 microsomes.
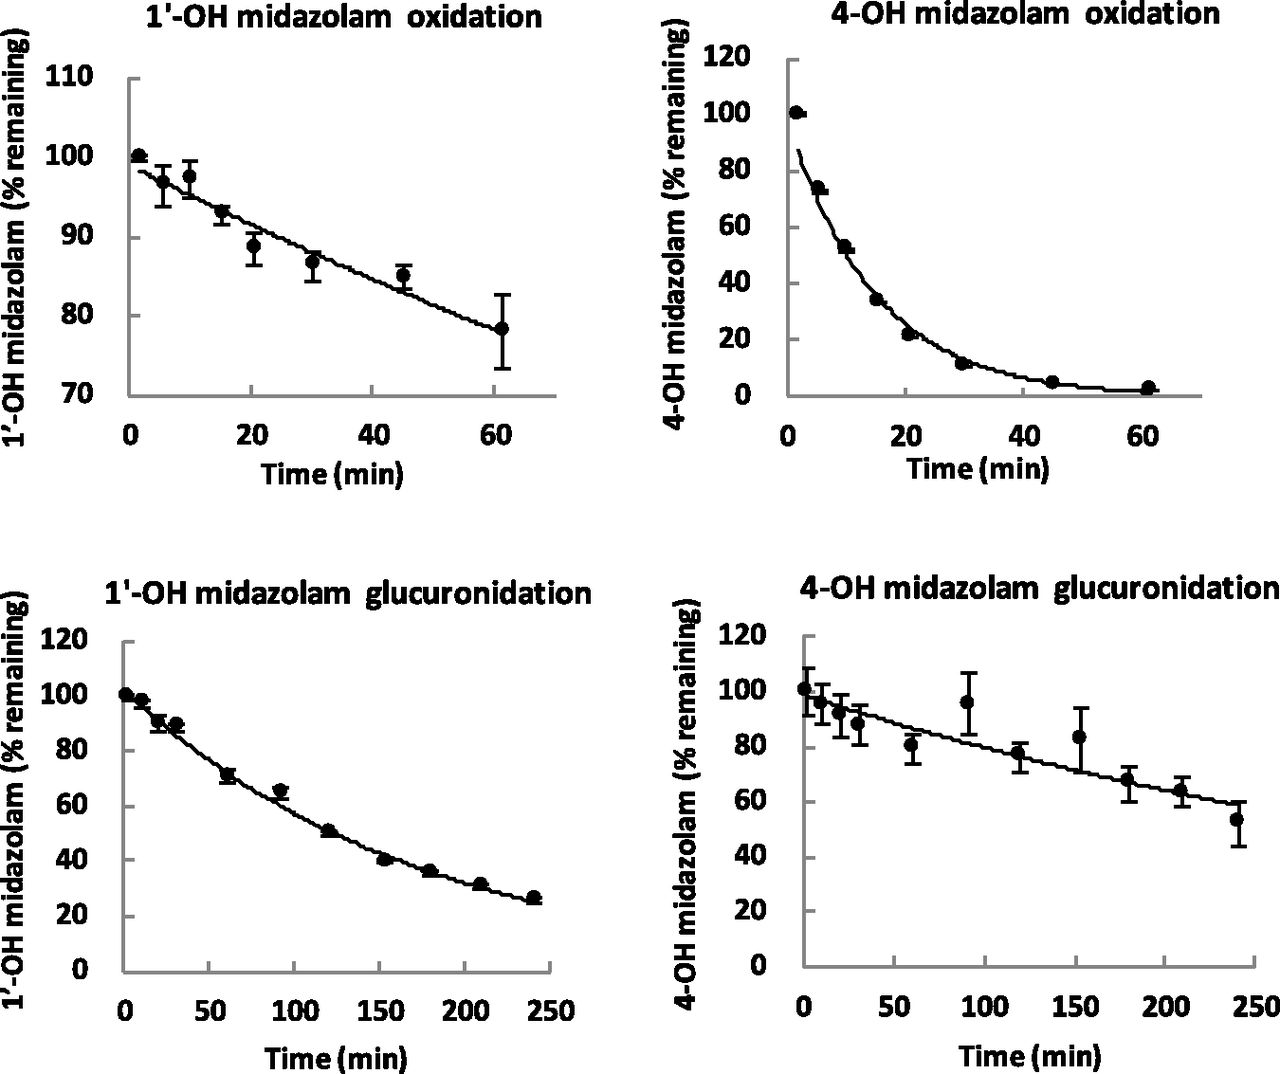
Substrate depletion of 1′-OH and 4-OH midazolam via oxidation and glucuronidation pathways.
Hepatic Transport of 1′-OH and 4-OH Midazolam in SCHH
To explore the determinants of hepatic transport of 1′-OH and 4-OH midazolam, SCHH were used to generate kinetic parameters. The time course of 1′-OH and 4-OH midazolam metabolite accumulation into SCHH is shown in Fig. 6. Kinetic parameters for hepatic uptake of the two midazolam metabolites were listed in Table 3. The uptake of 1′-OH midazolam over 5 minutes was not significantly different between the control condition (buffer with Ca2+) for total uptake measurement or in the presence of the OATP inhibitor rifamycin SV. This result indicates that 1′-OH midazolam is not subject to transporter-mediated uptake transporters in liver system.

Accumulated concentration of 1′-OH midazolam (upper) and 4-OH midazolam (lower) in hepatocytes at different time points. ●, Uptake values in incubation mixture containing Ca2+. ○, Uptake values measured from incubation mixture containing rifamycin SV. ▴, Uptake measured from incubation mixture without Ca2+.
Observed total uptake and passive diffusion clearances for 1′-OH and 4-OH midazolam from SCHH study
Efflux transporters were not involved in the biliary excretion of 1′-OH midazolam either, because there was no difference between the accumulated concentration of 1′-OH midazolam in incubations containing Ca2+ versus Ca2+ free media at 10 and 15 minutes (Fig. 6). The hepatic transport kinetic parameters of 4-OH midazolam were comparable with that of 1′-OH midazolam.
Estimation of the Input Parameters fm, Fg, Fh and Total Clearance (CLp) for Midazolam, Extraction Ratio (Eh,m), Systemic Availability (Fm), and Total Clearance (CLm) for Metabolites
The fraction of parent drug converted to the individual metabolites (fm) was calculated for 1′-OH and 4-OH midazolam using the in vitro intrinsic clearance data from Table 2 and listed in Table 4. The fm values indicate that 1′-OH metabolite is the major primary product in midazolam biotransformation (fm = 0.93). Fraction of the parent drug midazolam that escapes gut and liver extraction (Fg and Fh) as well as systemic clearance (CL) were estimated from in vitro CLint values, Qgut and well-stirred models, respectively (Table 4). The systemic availability of 1′-OH and 4-OH midazolam generated within the liver (Fm) was estimated using the general model (eq. 4). The Fm values for two compounds of approximately 0.3 (Table 4) suggest that both of the hydroxyl metabolites of midazolam undergo significant sequential metabolism without leaving the liver.
Fractional formation from parent drug (fm), metabolite systemic availability (Fm), metabolite Eh,m, midazolam Fg, Fh, and total clearance (CLp, CLm)
Prediction of AUCm/AUCp
All input values for static models of AUCm/AUCp ratio prediction (eqs. 1 and 8) including fm, Fm, Eh,m, CLp, CLm, Fh, Fg obtained above were used to predict the AUCm/AUCp ratios for 1′-OH and 4-OH midazolam after midazolam intravenous and oral administration (Table 5). The static model reasonably predicted the AUCm/AUCp ratio of 1′-OH midazolam from intravenous and oral route, compared with observed data from several pharmacokinetic studies (Mandema et al., 1992; Kupferschmidt et al., 1995; Backman et al., 1998; Eap et al., 2004). The predicted AUC ratio for 4-OH midazolam is very small (0.01–0.05), reflecting the in vivo findings in which no detectable plasma concentrations of the 4-OH metabolite were observed (Mandema et al., 1992) and insignificant amount excreted in the urine as conjugates (Heizmann et al., 1983).
Predicted AUCm/AUCp using static and PBPK models
Simulation of 1′-OH and 4-OH Concentration Time Courses after Midazolam Administration Using PBPK Modeling
The simulated profile versus observed profile for midazolam and 1′-OH midazolam after intravenous and oral dose are shown in Figs. 7 and 8. The model predicted exposures of the drug/metabolite pair are in good agreement with observed data for both parent and 1′-OH and 4-OH metabolites. After and intravenous dose of 1 mg, mean predicted AUC(0,∞) values of midazolam ranged from 36.9 to 55.7 (ng/ml × h) for the 20 simulated trials (median 43.6); the normalized observed range was 28.4 – 62.9 (ng/ml × h) (Kharasch et al., 2004; Link et al., 2008). The median total clearance predicted ranged from 19.4 to 25.8 l/h, consistent with in vivo range, 15.9–34.5 l/h (Tsunoda et al., 1999; Kharasch et al., 2004; Farkas et al., 2007; Link et al., 2008). Mean elimination half-life t1/2 was 1.69 h, the observed mean values were from 1.6 to 3.7 h (Mandema et al., 1992; Farkas et al., 2007). The AUC (0,∞) values of 1′-OH ranged from 7.8 to 11(ng/ml × h), the observed value was 7.4 (ng/ml × h) (Link et al., 2008). The AUC (0,∞) values of 4-OH ranged from 0.52 to 0.95 (ng/ml × h), the observed value was 0.95 (ng/ml × h) (Link et al., 2008).
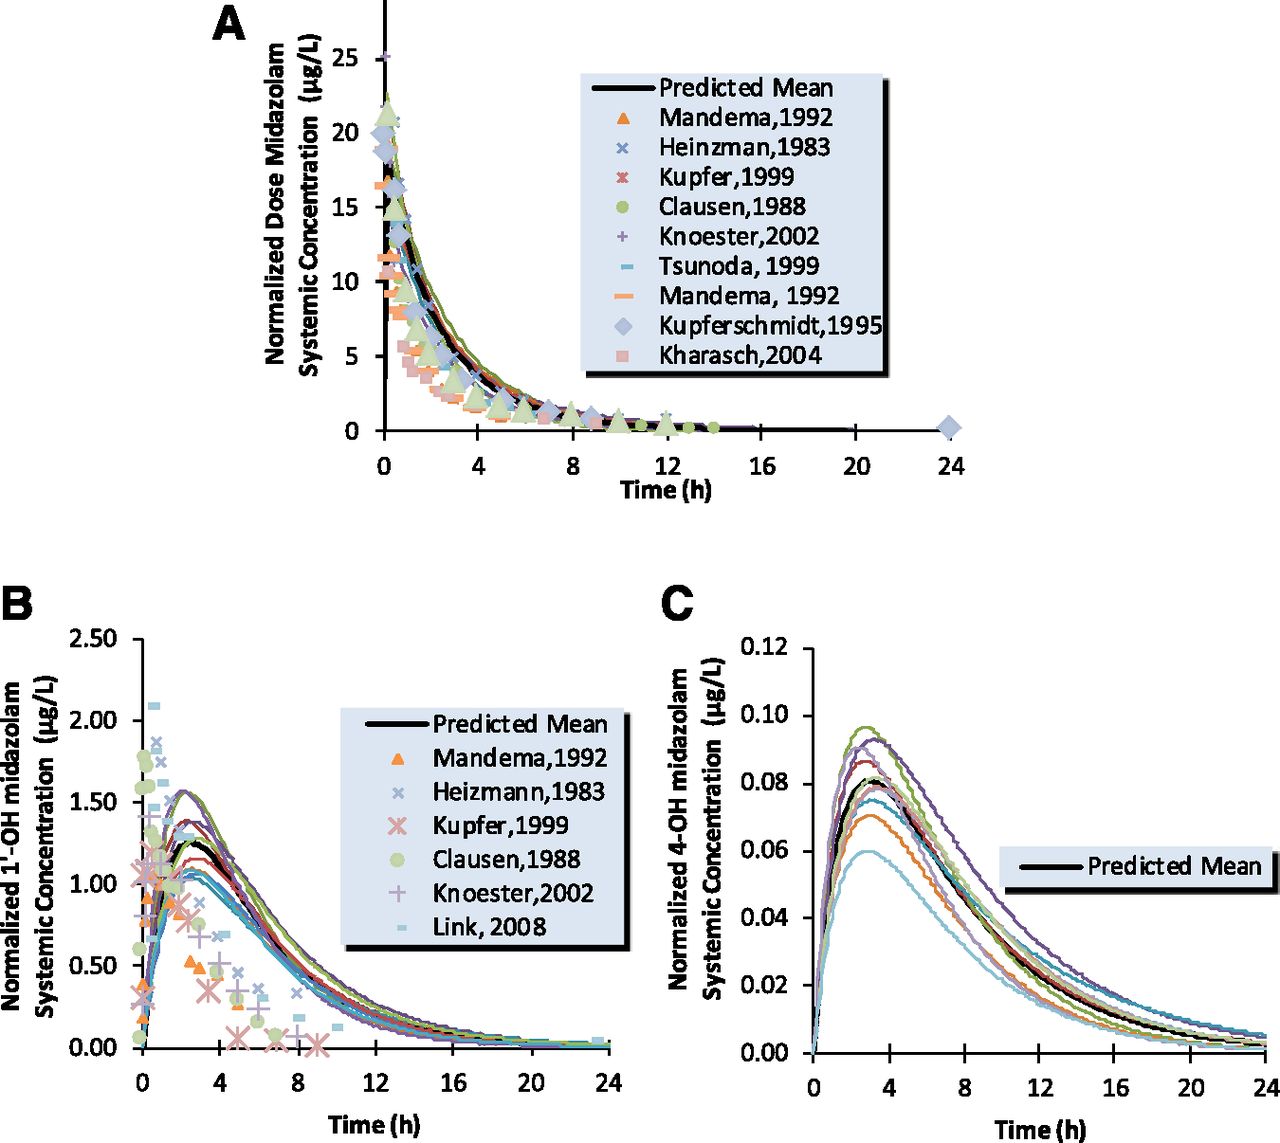
Simulated (continuous line) and observed (points) human intravenous plasma concentration-time profiles for midazolam (A), 1′-OH midazolam (B), and 4-OH midazolam (C).

Simulated (continuous line) and observed (points) human oral plasma concentration-time profiles for midazolam (A), 1′-OH midazolam (B), and 4-OH midazolam (C).
The AUCm/AUCp ratios were calculated from the simulated concentration-time profiles of 1′-OH midazolam or 4-OH midazolam and midazolam and shown in Table 5. AUCm/AUCp for 1′-OH after intravenous administration of midazolam was estimated in the range of 0.16–0.22 and the observed value of 0.1–0.2. After oral administration of midazolam, this metabolite/parent AUC ratio ranged from 0.43 to 0.62, which is in good agreement with in vivo values ranging between 0.3 and 0.6.
Local Sensitivity Analysis
The summary values for local sensitivity analysis for estimation of 1′-OH exposure are listed in Table 6. Based on these summary values, it is clear that the intrinsic clearance of 1′-OH midazolam via the oxidation pathway and B/P have the least effect on the output variables. The formation intrinsic clearance of 1′-OH midazolam is not sensitive for AUC, but has comparable effect with 1′-OH midazolam elimination clearance on its maximal concentration Cmax. The AUCm prediction was essentially insensitive to changes in 1′-OH midazolam logP value, yet Cmax is highly influenced by its logP precision. In both cases of model output investigations, plasma protein binding has significant impact on the variation of the model predictions.
Normalized sensitivity coefficients for selected parameters of 1’-OH midazolam PBPK model in sensitivity analysis with AUC and Cmax as model outputs
Discussion
The importance of some metabolites that possess pharmacological or toxic activities in drug therapy evokes the need for an assessment of metabolite kinetics after administration of the parent drug. To date, little attention has been paid to quantitative prediction of the in vivo disposition of a metabolite from in vitro drug metabolism data. One notable publication in which this concept was addressed was for dextromethorphan and omeprazole (Lutz and Isoherranen, 2012). In that case, the overall AUCm/AUCp ratio was the parameter predicted for metabolite exposure. AUCm/AUCp ratio can be of use in determining the potential importance of a metabolite in safety evaluation (http://www.fda.gov/downloads/drugs/guidancecomplianceregulatoryinformationguidances/ucm079266.pdf). Oftentimes, the pharmacologic or toxicologic effect is a function of the maximum concentration (Cmax) and not the total body exposure. Therefore, predicting the C versus t curve for a metabolite after administration of a drug could be useful.
From in vitro studies performed herein, the results showed that the predicted total hepatic clearance of midazolam was consistent with the in vivo clearance value (Heizmann et al., 1983; Clausen et al., 1988; Mandema et al., 1992; Tsunoda et al., 1999; Kharasch et al., 2004). The in vitro microsomal system also generated midazolam metabolites with corresponding fractions of product formation reflecting the in vivo metabolite profile, wherein 1′-OH midazolam is the major circulating product (Heizmann and Ziegler, 1981; Smith et al., 1981).
From PBPK simulations, predicted mean elimination t1/2 of midazolam was 1.69 h, the observed mean values were from 1.6 to 3.7 h (Mandema et al., 1992; Farkas et al., 2007). The total in vitro elimination clearance of 1′-OH midazolam was 11.9 ml/min/kg and predicted Vss was 1.8 l/kg. From these values, t1/2 of 1′-OH midazolam was calculated to be identical to that for the parent drug, 1.72 h. In this case, decline of metabolite in plasma is governed by elimination of parent drug. Concentration of 1′-OH midazolam declines in parallel with midazolam, as observed in clinical study (Mandema et al., 1992).
Similar to 1′-OH and 4-OH midazolam, many primary metabolites undergo phase II metabolism by glucuronidation or other pathways mediated by enzymes other than P450. Whereas the methods for predicting clearance for P450 mediated clearance, such as for midazolam, are well established, predicting clearance mediated by other pathways is not as well explored. Prediction of in vivo hepatic drug glucuronidation from liver microsomal data has been reported to yield a consistent 10-fold underprediction (Soars et al., 2002). Several attempts have been made to modify the incubation conditions for successful prediction of clearance mediated by UGT enzymes (Rowland et al., 2008, 2009; Kilford et al., 2009; Obach, 2011). Our data show that the clearance to a glucuronidated metabolite can be predicted from in vitro CLint.
In addition to the formation and elimination intrinsic clearance of metabolites, another component contributing to the circulating levels of a metabolite is its availability. Once formed in the liver, a metabolite may be subjected to sequential metabolism by the liver and/or biliary excretion before it can be released into the plasma. In Houston’s static model, the systemic availability of metabolite (Fm) was introduced as the ratio of the amount of metabolite leaving the liver to the amount of metabolite formed in the liver (Pang and Gillette, 1979; Houston, 1981). The discrepancy between in vitro data and extent of metabolites in human circulation in vivo could be explained by the fact that a certain amount of formed metabolite may undergo sequential metabolism and/or be excreted into the feces via the bile before leaving the liver and reaching the systemic circulation (Anderson et al., 2009). Therefore, a major metabolite formed in HLM or hepatocytes may be not a major circulating metabolite in plasma if it has low systemic availability. Under linear kinetics and in the absence of hepatic uptake transporter activities, diffusional and metabolic intrinsic clearances along with hepatic blood flow rate play important roles in the distribution and elimination of metabolites in liver. For a metabolite whose intrinsic clearance is comparable with hepatic blood flow, a low passive diffusion clearance promotes elimination of the metabolite (de Lannoy and Pang, 1987). Experimentally, the human systemic availability of a metabolite can be approximated after intraportal administration of metabolite (Pang and Kwan, 1983). However, this approach is rarely carried out for a drug metabolite in early stage of drug development. Therefore, it is desired to reasonably predict this value from in vitro and/or preclinical data.
When there is no diffusional barrier for a metabolite to reach its major site of elimination (liver), the systemic availability of a metabolite can be approximately predicted using the well stirred model and its sequential elimination intrinsic clearance (eq. 3). The kinetics of metabolites could be regarded in similar way as parent drug, but instead of being presented to the liver by blood flow, the metabolite appears in the liver from parent drug and escapes hepatic first-pass metabolism to reach the circulation. The well-stirred model was shown to predict the appearance of lidocaine metabolite in the hepatic venous blood after it had undergone further metabolism by the liver (Pang and Rowland, 1977). However, in many cases metabolites are more hydrophilic and of lower permeability than parent drugs, and therefore their disposition may be subject to diffusional barriers that limit their access into and out of hepatocytes. In this case, Fm was predicted based on the model of competing rates between the passive diffusion and metabolite sequential metabolism (eq. 2).
1′-OH midazolam and 4-OH midazolam possess moderate passive diffusion properties. Thus, the model adapted by Yang et al. (2007) was used to incorporate the impact of hepatic blood flow and permeability through hepatocytes on metabolite sequential first-pass elimination. This model does not reflect the physiologic representation of the system, but conceptually accommodates the interplay between hepatic blood flow and drug membrane permeability. Overall, based on the values of Fm, fm, Eh,m, Fg, CLp, and CLm predicted from in vitro studies, the AUCp/AUCm ratios of 1′-OH and 4-OH midazolam calculated from the static model (eq. 1) are consistent with the observed data (Table 5).
At early development, liver microsomes or recombinant systems can be used in HIM CLu,int and Fg determination for 3A4 substrates. The study of Gertz et al. (2010) highlighted utility of HLM CLuint in Fg prediction, when they observed differences in CLuint values obtained in HIM and HLM were not significant after normalization for tissue-specific CYP3A abundance. Similarly, data from von Richter et al. (2004) indicated the similar intrinsic activities of gut and liver CYP3A. In this study, midazolam is extensively metabolized by CYP3A; hence HLM CLint was used as a surrogate measure that could be scaled to HIM activity in midazolam Fg prediction. Also, fractions of midazolam converted to two primary CYP3A metabolites in intestine (fm,g) were assumed to be identical to their fm values in the liver. For other non-CYP3A drugs, CLint, gut can be measured from in vitro HIM system to predict Fg, Fm,g, and fm,g for a specific metabolite.
When more in vitro enzyme kinetic and clinical PK data become available, it is likely that better understanding of metabolite exposure profiles can be obtained by PBPK modeling (Chen et al., 2015; Varma et al., 2015). It can be seen from the predicted exposure of 1′-OH midazolam from PBPK model that although pharmacologically active, the concentrations of 1′-OH midazolam are low; hence they would have low contribution to the sedative/anesthetic properties of midazolam. Almost the entire drug is converted to 1′-OH metabolite, and its fm is close to 1. However, intrinsic clearance of the 1′-OH metabolite is also high, which results in the exposure to this metabolite after administration of midazolam being lower than exposure to midazolam itself (oral AUCm/AUCp less than 0.5). The impact of generation of 1′-OH from midazolam during first pass can be seen in the three-times higher value of the 1′-OH-to-midazolam AUC ratio after the drug oral dose compared with the value obtained after the intravenous dose. The metabolite concentration peak in simulated oral profile appears as early as the parent drug. Crevoisier et al. (1983) observed that an oral dose produced more marked effects than did the intravenous administration when comparing midazolam concentrations, suggesting contribution by an active metabolite. For this well-characterized example of metabolite pharmacokinetic data, PBPK modeling was demonstrated to predict the disposition of 1′-OH and 4-OH midazolam successfully. However, in the early stages of drug development, the development of PBPK models for drug metabolite may be challenging because of limited input data for the metabolite. In that scenario, the static model with less intensive parameters should be considered as a useful tool for assessment of metabolite-related concerns in new drug development.
In conclusion, this study shows that relative in vivo 1′-OH and 4-OH midazolam metabolite exposure can be predicted from in vitro data using the static model, and plasma concentration profiles can be estimated using PBPK modeling. This example showed the importance of measuring sequential metabolism of major metabolites as well as the relevance of estimating systemic availability of a metabolite from its tissue of formation. This relatively simple example merely lays a framework for attempting predictions of metabolite exposures for other drugs where metabolic pathways may be more complex and the clearance mechanism for the metabolite(s) may be less predictable from in vitro methods. The success observed for developing predictive models for 1′- and 4-hydroxymidazolam may not be replicated in more complex and/or less understood clearance pathways. Efforts are currently underway to employ the methods described in this work to other drug and metabolite pairs wherein overall clearance pathways and dispositional properties are different from the example of midazolam and its hydroxyl metabolites. It is likely that testing other examples will show the importance of other measurements that need to be made.
Acknowledgments
The authors thank Susanna Tse, Manthena Varma, Louis Leung, and Jian Lin for insightful suggestions/discussion and software assistance. Hoa Nguyen is a Pfizer Worldwide Research and Development Postdoctoral Fellowship awardee.
Authorship Contributions
Participated in research design: Nguyen, Callegari, and Obach.
Conducted experiments: Nguyen, Kimoto, and Obach.
Performed data analysis: Nguyen, Kimoto, Callegari, and Obach.
Wrote or contributed to writing of the manuscript: Nguyen, Callegari, and Obach.
Footnotes
- Received November 30, 2015.
- Accepted March 7, 2016.
Abbreviations
- AUC
- area under the concentration-time curve
- CL
- clearance
- CLint
- pass, unbound passive diffusion intrinsic clearance
- CLint
- u, met, unbound metabolic intrinsic clearance
- CLint
- uptake, unbound sinusoidal uptake intrinsic clearance
- CYP
- cytochrome P450 enzyme
- HBSS
- Hanks’ balanced salt solution
- HIM
- human intestinal microsomes
- HLM
- human liver microsomes
- IS
- internal standard
- LC-MS/MS
- liquid chromatography/tandem mass spectrometry
- MDZ
- midazolam
- 1′-OH MDZ
- 1′-hydroxy midazolam
- 4-OH MDZ
- 4-hydroxy midazolam
- PBPK
- physiologically based pharmacokinetic
- SCHH
- sandwich-cultured human hepatocytes
- UGT
- UDP-glucuronosyltransferase
- Copyright © 2016 by The American Society for Pharmacology and Experimental Therapeutics


