


Abstract
Although CYP2B6 catalyzes the biotransformation of many drugs used clinically for children and adults, information regarding the effects of development on CYP2B6 expression and activity are scarce. Utilizing a large panel of human liver samples (201 donors: 24 fetal, 141 pediatric, and 36 adult), we quantified CYP2B6 mRNA and protein expression levels, characterized CYP2B6 (bupropion hydroxylase) activity in human liver microsomes (HLMs), and performed an extensive genotype analysis to differentiate CYP2B6 haplotypes such that the impact of genetic variation on these parameters could be assessed. Fetal livers contained extremely low levels of CYP2B6 mRNA relative to postnatal samples and fetal HLMs did not appear to catalyze bupropion hydroxylation; however, fetal CYP2B6 protein levels were not significantly different from postnatal levels. Considerable interindividual variation in CYP2B6 mRNA expression, protein levels, and activity was observed in postnatal HLMs (mRNA, ∼40,000-fold; protein, ∼300-fold; activity, ∼600-fold). The extremely wide range of interindividual variability in CYP2B6 expression and activity was significantly associated with age (P < 0.01) following log transformation of the data. Our data suggest that CYP2B6 activity appears as early as the first day of life, increases through infancy, and by 1 year of age, CYP2B6 levels and activity may approach those of adults. Surprisingly, CYP2B6 interindividual variability was not significantly associated with genetic variation in CYP2B6, nor was it associated with differences in gender or ethnicity, suggesting that factors other than these are largely responsible for the wide range of variability in CYP2B6 expression and activity observed among a large group of individuals/samples.
Introduction
CYP2B6 is one of about 15 cytochrome P450 enzymes (P450) that are primarily responsible for the oxidation of drugs and other xenobiotics and is the only known functional member of the CYP2B subfamily in humans (Wang and Tompkins, 2008; Zanger and Klein, 2013). CYP2B6 was once believed to play an insignificant role in drug metabolism because it was initially reported to be present in low levels and expressed in only a small proportion of livers (Mimura et al., 1993). More recent studies have demonstrated that CYP2B6 is present in most postnatal livers (Stresser and Kupfer, 1999; Lamba et al., 2003; Croom et al., 2009) and has a relative abundance varying from 1% to 10% of the total P450 content (Wang and Tompkins, 2008). Today, CYP2B6 is known to catalyze the biotransformation of over 90 substrates (Wang and Tompkins, 2008), including clinically used drugs such as the antineoplastic agent cyclophosphamide (Roy et al., 1999), the antismoking cessation drug bupropion (Faucette et al., 2000), the anesthetic propofol (Court et al., 2001), and the antiretroviral efavirenz (Ward et al., 2003; Desta et al., 2007), as well as other compounds including drugs of abuse, pesticides, and environmental toxins. A few reactions, such as bupropion hydroxylation and efavirenz 8-hydroxylation, are almost exclusively catalyzed by CYP2B6 and have been used to assess CYP2B6 activity both in vitro and in vivo.
Previous studies noted marked interindividual variability in CYP2B6 expression and activity in human livers; in vitro CYP2B6 mRNA expression (Lamba et al., 2003; Hofmann et al., 2008), protein levels (Hesse et al., 2004) and activity (Croom et al., 2010) have all been reported to exceed 250-fold. This remarkable variation in CYP2B6 expression and activity has the potential to result in therapeutic and toxic responses to medications metabolized by this enzyme, particularly for those drugs with narrow therapeutic indices. Hence, it is imperative that the sources responsible for the observed variability in CYP2B6 expression and activity be identified. Numerous investigations have attempted to elucidate the mechanisms responsible for the variability in CYP2B6 expression and activity, examining factors such as age, gender, ethnicity, genetic polymorphisms, and chemical induction. In adults, CYP2B6 expression and activity appear to be determined largely by genotype and chemical regulation.
CYP2B6 is one of the most polymorphic P450 genes in humans with numerous single nucleotide polymorphisms (SNPs) encoding 38 CYP2B6 protein variants to date (http://www.cypalleles.ki.se/). The functional impact of these allelic variants is complex. At least 12 alleles have been associated with no or low activity; however, these alleles appear to be rare in the populations investigated (Zanger and Klein, 2013). SNPs associated with CYP2B6 allelic variants can result in protein expression levels that may be increased, decreased, or exhibit no change. The functional consequences of allelic variation on CYP2B6 activity in vitro have been shown to be allele, substrate, and expression-system dependent (Zanger and Klein, 2013). CYP2B6 is strongly inducible by several drugs, including the classical inducers rifampicin and phenobarbital, which regulate CYP2B6 expression through the constitutive androstane and pregnane X receptors CAR and PXR (Lamba et al., 2004; Faucette et al., 2007). Induction of CYP2B6 activity in cultured hepatocytes treated with phenobarbital has been shown to be as high as 32-fold (Yajima et al., 2014).
Although developmental age has been shown to have an impact on the expression of other P450s (Hines and McCarver, 2002; Hines, 2007, 2008, 2013,), little information exists regarding the effects of development on CYP2B6 expression and activity. Only a few studies have examined the effects of age on CYP2B6 expression and almost all of these studies are hampered by the inclusion of only a small number of fetal or pediatric samples. To date, the most comprehensive study of CYP2B6 developmental changes characterized CYP2B6 protein levels in 217 fetal and pediatric liver samples from donors ranging from 10 weeks gestation to 17 years of age (Croom et al., 2009). A 2-fold increase in median CYP2B6 protein expression was observed in those samples outside the neonatal period (birth to 30 days postnatal) compared with fetal and neonatal samples; however, CYP2B6 expression did not vary significantly with gender, CYP2B6*6 genotype, or postmortem interval.
The current study was undertaken to explore in greater detail factors involved in CYP2B6 expression and activity, with particular regard to the contributions of age and genetic variation. Utilizing a collection of liver samples from 201 donors that spanned a wide range of ages (∼11 weeks gestation to 79 years of age), the current study quantified CYP2B6 protein expression in human liver microsomes (HLMs) as in previous studies but also characterized CYP2B6 mRNA expression levels and CYP2B6 bupropion hydroxylase activities in HLMs, and performed an extensive genotype analysis to differentiate CYP2B6 haplotypes such that the impact of genetic variation on these parameters could be assessed. In addition, polymorphisms in genes that may impact CYP2B6 expression and activity were also investigated.
Materials and Methods
Materials and Reagents
Bupropion and hydroxybupropion were purchased from Toronto Research Chemicals (Toronto). EDTA, formic acid, glucose-6-phospate, glucose-6-phosphate dehydrogenase, and β-NADP were purchased from Sigma Aldrich Chemical Co. (St. Louis, MO). Acetonitrile (OPTIMAgrade) and triethylamine were purchased from Thermo-Fisher Scientific (Fairlawn, NJ). Criterion XT Bis-Tris 10% gels, XT Sample Buffer, XT Reducing Agent, XT MOPS running buffer, 10X Tris/Glycine transfer buffer, Kaleidoscope Protein Standard, and thin filter paper were purchased from Bio-Rad Life Science (Hercules, CA). Donkey anti-rabbit IgG horseradish peroxidase conjugate, ECL PlusWestern blotting detection reagents and analysis system, Hyperfilm ECL and Hybond ECL nitrocellulose membrane were purchased from GE Healthcare (Piscataway, NJ). Microsomes from baculovirus-infected insect cells expressing human CYP2B6 (Supersomes) and a polyclonal rabbit anti-human CYP2B6 antibody were purchased from Corning Gentest (Woburn, MA). Pooled HLMs (n = 16 donors, mixed gender) were a generous gift from Xenotech LLC (Lenexa, KS). All genotyping and gene expression assays were purchased from Applied Biosystems (Foster City, CA).
Liver Samples
A total of 201 prenatal and postnatal liver samples were included in this study. The use of these tissues was classified as nonhuman subjects research by the University of Missouri-Kansas City Pediatric Health Sciences Review Board. All prenatal and some postnatal tissue samples were obtained through the National Institute of Child Health and Human Development–supported tissue retrieval programs at the Central Laboratory for Human Embryology at the University of Washington (Seattle, WA), the Brain and Tissue Bank for Developmental Disorders at the University of Maryland (Baltimore, MD), and the National Institutes of Health–supported Liver Tissue Cell Distribution System at the University of Minnesota and the University of Pittsburgh. Additional postnatal liver samples were obtained from Vitron (Tucson, AZ). In addition, mRNA, DNA, and microsomes isolated from livers acquired by XenoTech LLC were donated for use in this study. Available demographic data are summarized in Table 1. Tissues were stored at −70°C or below prior to preparation of subcellular fractions. To improve haplotype determination with the PHASE (version 2.1) algorithm (Stephens et al., 2001; Stephens and Donnelly, 2003), we added CYP2B6 genotyped DNAs from 33 liver tissue samples (sources as described in Liver Samples) and 37 DNA samples isolated from bone marrow transplant patients’ blood for a total of 271 samples.
Demographic data for liver tissue samples
RNA Isolation
Total RNA was extracted from human liver tissues with a RNeasy Mini Kit (Qiagen, Valencia, CA). An on-column DNase digest was performed. The quality of the total RNA was assessed by running a microfluidic Experion RNA StdSense chip (Bio-Rad Laboratories, Hercules, CA). Only RNAs with an RNA quality index of >6.5 were used for expression quantification. RNA quality index values range from 1 to 10, with 1 being totally degraded and 10 being the highest quality of RNA. The RNA quantity was determined spectrophotometrically by measuring an aliquot on a NanoDrop 1000 Instrument (Thermo-Fisher Scientific, Rockford, IL).
RNA Extraction and Quantitative Reverse Transcriptase Polymerase Chain Reaction (PCR) Analysis
Reverse Transcription Quantitative PCR.
One-step quantitative PCR reactions were performed for the housekeeping gene cyclophilin A (PPIA) on 15 ng of total RNA per reaction using the qScript One-Step kit (Quanta BioSciences, Gaithersburg, MD) and for the CYP2B6 gene using the qScript One-Step SYBR kit (Quanta BioSciences). TaqMan reactions for PPIA (Applied Biosystems) were carried out on an Eppendorf Realplex instrument (Hauppauge, NY). Reverse transcription was performed for 3 minutes at 50°C and was immediately followed by a denaturation step at 95°C for 1 minute. Subsequently, 50 amplification cycles were performed consisting of denaturation at 95°C for 15 seconds and a combined annealing/extension at 60°C for 1 minute. SYBR Green reactions for CYP2B6 were carried out on an Applied Biosystems 7900 HT Real-Time PCR instrument (Life Technologies, Carlsbad, CA). A reverse transcription step of 10 minutes at 50°C was followed by an initial denaturation at 95°C for 5 minutes. Subsequently, 50 cycles of denaturation at 95°C for 15 seconds and a combined annealing/extension at 60°C for 45 seconds were performed. Serial dilutions of PCR amplicons were used to generate standard curves ranging in concentration from 10 to 107 molecules. Linear regression analysis was performed from the respective standard curves to calculate mRNA transcript numbers.
Determination of Limit of Blank, Limit of Detection, and Limit of Quantification.
In compliance with the minimum information for publication of quantitative real-time PCR experiments guidelines, the level at which accurate quantification of real-time PCR is attainable was determined using the following procedures with each gene (Bustin et al., 2009). Known dilutions were made from cDNA ranging from 3 to 1500 molecules/µl (CYP2B6) or 1250 molecules/µl (PPIA). Real-time PCR was carried out using these dilutions as input in triplicate reactions. The limit of blank, limit of detection, and limit of quantification were determined as described by Armbruster and Pry (2008).
Assay information.
CYP2B6: Equation: y = −3.6993048X + 33.11937; R2 = 0.999; E=0.863.
Primers:
2B6F: 5′ CAGCCACCAGAACCTCAACC (exon 6); and
2B6R: 5′ AAGGTCGGAAAATCTCTGAATCTCATA (exon 7).
Normalizer gene.
PPIA: Equation: y = −3.351X + 35.61; R2 = 0.999; E = 0.99 (Life Technologies).
Genomic DNA (gDNA) Isolation and Genotype Analyses
gDNA was isolated from ∼25 mg of tissue using a DNeasy Tissue Kit (Qiagen) or an Illustra Tissue and Cells Genomic Prep Kit (GE Healthcare). gDNA was assessed by agarose gel electrophoresis for quality; concentration was measured using a NanoDrop 1000 spectrophotometer (Thermo-Scientific, Waltham, MA). gDNA samples were diluted to 15 ng/µl.
Genotyping was carried out on an Applied Biosystems 7900 HT Real-Time PCR System using predesigned Life Technologies TaqMan assays for CYP2B6 rs34223104 (−82T>C); rs3745274 (516G>T, Q172H), rs28399499 (983T>C, I328T), and rs3211371 (1459C>T R487C). Reactions were scaled to 8 µl and contained 4 µl KAPA PROBE FAST Universal 2X qPCR Master Mix (KAPA Biosystems, Woburn, MA), and 0.2 or 0.4 µl TaqMan assay mix, respectively, depending on whether it was a 20× or 40× mix, and 12–18 ng gDNA. Cycle conditions were slightly modified from those recommended by KAPA Biosystems and consisted of an initial denaturation for 3 minutes at 95°C, followed by 40 cycles at 95°C for 15 seconds and at 60°C for 30 seconds. Each plate contained gDNA samples obtained from the Coriell Institute (Camden, NJ) to serve as controls for known genotypes.
To detect CYP2B6 rs2279343 (785A>G, K262R) a high-resolution melting curve assay was developed and performed as previously described (Twist et al., 2013). Briefly, a 70 base pair–long PCR product containing the SNP of interest was amplified from CYP2B6 on an Eco Real-Time PCR System (Illumina, San Diego, CA) and PCR products subjected to high-resolution melting curve analysis. High-resolution melting discriminated CYP2B6 785A>G as well as identified 777C>A SNP (rs45482602), which is located close by and defines the CYP2B6*3 allele. The PHASE (version 2.1) software was used to construct haplotypes from CYP2B6 genotype data as previously described (Stephens et al., 2001; Stephens and Donnelly, 2003). The n = 201 samples in this study were phased with another 70 samples [CYP2B6 genotyped DNAs from 33 liver tissue samples (sources as described in Liver Samples) and 37 bone marrow transplant patients’ blood DNAs] for a total of 271 samples in order to improve the accuracy of haplotype assignment.
TaqMan assays were also performed for the following sequence variations: POR1*28 (cytochrome P450 oxidoreductase, rs1057868), AKR1D1 (aldo-keto reductase family 1, member D1, rs1872930), and PPARα (peroxisome proliferator activated receptor α, rs4253728) using the modified conditions described previously.
Preparation of Liver Microsomes
HLMs were prepared by differential centrifugation, essentially as described by Lu and Levin (1972). Frozen liver samples were placed in homogenizing buffer (∼3 ml/g liver; 50 mM Tris.HCl, pH 7.4 at 4°C, containing 150 mM KCl and 2 mM EDTA) and allowed to thaw at 4°C. Liver samples were homogenized in Potter-Elvehjem–type glass mortars (round bottom) with Teflon pestles utilizing a motor-driven tissue homogenizer (Model BDC-3030, Caframo, Wiarton, Ontario, Canada). Nuclei and lysosomes were removed from the homogenate by centrifugation (∼800 gmax for 15 minutes at 4°C). The resulting supernatant was subjected to further centrifugation (∼12,000 gmax for 20 minutes at 4°C) and the supernatant fraction was subjected to ultra-centrifugation (∼105,000 gmax for 70 minutes at 4°C). The resulting supernatant (cytosol) was stored at −70°C. The pellet (microsomal fraction) was removed from the centrifuge tube, transferred to a low-volume glass mortar, manually resuspended in 0.25 M sucrose with a Teflon pestle and stored at −70°C until use. Protein concentrations were determined with the Micro BCA Protein Assay kit (Pierce Chemical Co., Rockford, IL) using bovine serum albumin (Sigma Aldrich Chemical Co.) as the standard.
Bupropion Hydroxylase Activity
Hydroxybupropion and bupropion were resolved by isocratic, reversed-phase high-performance liquid chromatography (HPLC) based on a modification of the method described by Faucette et al. (2000). HPLC analyses were performed with a Hewlett Packard HP1100 HPLC system equipped with a programmable HP1100 series diode array detector (Hewlett Packard Instruments, Santa Clara, CA). All data were collected and integrated with Chemstation 3D software, version B.03.07 (Agilent, Santa Clara, CA) set at 214 nm. Peaks of interest were separated on a Phenomenex (Torrance, CA) Prodigy C18 column (4.6 mm × 15 cm, 3 µm particle size) preceded by a Phenomenex C18 guard column (4 × 3 mm i.d., 5 µm particle size). The mobile phase was a 79:21 mixture of 0.25% triethylamine containing 0.1% formic acid and acetonitrile and was delivered at a constant flow rate of 1 ml/min. The column temperature was maintained at 40°C. Under these conditions hydroxybupropion and bupropion had retention times of 4.8 and 8.6 minutes, respectively; total sample analysis time was 10.5 minutes. The column effluent was monitored at 214 nm. Hydroxybupropion was quantified by comparison of peak areas with those of analytical standards. The lower limit of quantification for hydroxybupropion was 0.06 µM. The analytical method was linear (r2 > 0.998) over a standard concentration range of 0.06–200 µM. Standard curves run on three separate occasions produced intraday CVs that ranged from 0.0% to 15.7%, whereas interday CVs ranged from 3.1% to 10.9%.
In vitro enzyme assays were performed in 96-well microtiter plates. Incubations (100 μl) contained HLMs (30 μg of microsomal protein), potassium phosphate buffer (50 mM, pH 7.4), MgCl2 (3 mM), EDTA (1 mM), and bupropion (500 μM) at the final concentrations listed. Reactions were initiated by the addition of a NADPH-generating system, consisting of NADP (1 mM), glucose-6-phosphate (5 mM), and glucose-6-phosphate dehydrogenase (1 U/ml), incubated at 37 ± 0.1°C in a Thermo Forma (Marietta, OH) Benchtop Orbital Shaker and terminated after 30 minutes by the addition of 50 μl of ice-cold acetonitrile. Protein was precipitated by centrifugation at 10,000g for 10 minutes and a direct injection of an aliquot (70 μl) of the supernatant was analyzed by HPLC. Incubations were performed in triplicate. Bupropion stock solutions were dissolved in methanol; however, the concentration of methanol present in the incubation mixtures did not exceed 0.25%. The rate of bupropion hydroxylation was proportional to the protein concentration and incubation time under the conditions used in these experiments.
Immunoquantitation of Microsomal CYP2B6 Protein
HLMs or insect cell microsomes containing recombinant human CYP2B6 were diluted with Bio-Rad XT Sample Buffer and XT Reducing Agent according to the manufacturer’s instructions and heated for 5 minutes at 95°C. Microsomal proteins (1–40 µg per lane) were loaded on a polyacrylamide gel based on each sample’s bupropion hydroxylase activity to insure that observed CYP2B6 protein levels would fall within the narrow, linear quantitative range available on western immunoblot. Subsequently, microsomal proteins were separated on precast Criterion 26-well XT Bis-Tris 10% gels in Bio-Rad XT MOPS Running Buffer, pH 6.9, at 150 V for 2 hours at 4°C. Proteins were transferred to nitrocellulose membranes using the Bio-Rad Criterion Blotter with Bio-Rad Tris/glycine transfer buffer containing 39 mM glycine, 48 mM Tris, 0.0375% SDS, and 20% methanol at 30 V for 2 hours at 4°C. Membranes were blocked for 2 hours at room temperature on a rocker in 10 mM Tris HCl, 150 mM NaCl, and 0.05% Tween-20, pH 8.0 containing 4% dry milk powder (M-TNT). Blocked membranes were placed in hybridization tubes (protein side facing inward), rotated horizontally over night at 4°C and incubated with primary rabbit anti-human CYP2B6 antibody that was diluted 1:5000-fold in M-TNT. Blots were washed with TNT (10 minutes) and subsequently washed with deionized water (10 minutes). The washes were repeated two additional times. Blots were then incubated with horseradish peroxidase–conjugated donkey anti-rabbit antibody diluted 1:40,000-fold in M-TNT at room temperature. After 2 hours, the blots were repeatedly washed with TNT followed by deionized water (5 minutes ×6) and then incubated with ECL Plus chemiluminescence reagents according to the manufacturer’s instructions (GE Healthcare). Florescence was captured by exposing the blots to Hyperfilm ECL (GE Healthcare) for 10 minutes. Films were scanned using a flatbed scanner and densitometric analysis of immunoreactive protein was performed using Kodak Molecular Imaging Software, version 4.0.4 (Eastman Kodak Co., Rochester, NY). Microsomes from baculovirus-infected insect cells (Supersomes) expressing human CYP2B6 (BD Gentest) were used to derive a standard curve using 0, 5, 10, 33, 66, and 100 fmol of CYP2B6 protein. Prestained molecular weight markers served as the negative control and a pooled, adult human liver microsomal sample was used as the positive control. CYP2B6 standards and control samples were included on each membrane. Standard curves were linear over the range of standards and coefficients of determination (r2 values) and ranged from 0.963 to 0.998. Values presented are the mean of two or more determinations.
Data and Statistical Analyses
Expression of mRNA transcripts was normalized for the expression of PPIA mRNA. Linear regression was used to determine the response range for standard curves comprised of recombinant cDNA-expressed CYP2B6 or hydroxybupropion that was then subsequently used to quantify CYP2B6 protein levels and rates of hydroxybupropion formation, respectively. Statistical analyses were performed using JMP version 10.0 (SAS, Cary, NC). CYP2B6 mRNA, protein, and activity data were not normally distributed. Log transformation of CYP2B6 mRNA, protein, and activity approximated normal sample distributions; however, each failed the Shapiro-Wilk normality test (P < 0.05). Spearman’s rho correlation coefficients were calculated to measure associations between age and log-transformed mRNA, protein, and activity data. Statistical analyses between age, gender, ethnicity, and CYP2B6 genotype with log-transformed CYP2B6 mRNA expression levels, protein contents, and rates of bupropion hydroxylation were compared with the Wilcoxon test or Kruskal-Wallis nonparametric analysis of variance (ANOVA) followed by a Dunn’s post hoc test. Log-transformed CYP2B6 RNA expression levels, protein contents, and rates of hydroxybupropion formation were used in partitioning analyses to search for age breakpoints. Logworth values ≥1.95 and P values <0.05 were considered significant. Groups were compared using Kruskal-Wallis nonparametric ANOVA followed by a Dunn’s post hoc test.
A linear regression model was developed in JMP version 10 (SAS) to assess the association of age, gender, ethnicity, CYP2B6 genotype, and exposure to known inducers on CYP2B6 activity or protein expression. The log of CYP2B6 activity or protein level was assigned as the dependent variable, and the other factors were assigned as independent covariables. Following formulation of the model, each independent cofactor was removed from the model (one at a time) in order to assess the contribution of the factor to the association with CYP2B6 activity or protein level.
Results
CYP2B6 mRNA Expression, Protein Levels, and Bupropion Hydroxylase Activity.
Microsomes and RNA were isolated from liver samples obtained from 24 fetal, 141 pediatric, and 36 adult donors. mRNA preparations from 72 liver samples had RNA quality index values that were <6.5, which was below the acceptance criteria established to generate meaningful quantitative mRNA expression data. Hence, quantitative mRNA expression data were obtained on only 129 of the 201 liver samples (Table 1). Although CYP2B6 mRNA expression was extremely low in fetal livers (Fig. 1A), a dramatic increase in postnatal CYP2B6 mRNA expression was evident as early as the first day of life. Considerable variability in CYP2B6 mRNA expression was observed among the evaluated postnatal liver samples; mRNA expression levels varied >40,000-fold (range: 0.7–28,744 molecules/reaction/15 ng total RNA).

Relationship between age and CYP2B6 mRNA transcript levels (A), protein expression (B), and activity (C) in human liver samples and microsomes. CYP2B6 mRNA transcript levels were determined by quantitative reverse transcription PCR, protein levels by western immunoblot, and bupropion hydroxylase activity by HPLC/UV, as described in Materials and Methods. The x-axis was expanded for the prenatal and 0–2 years of age range to better visualize the data in this range (gray-filled circles). Note that no activity was detected in fetal liver microsomes, explaining the absence of respective data points in (C). CYP2B6 protein determinations were performed in duplicate, whereas CYP2B6 mRNA transcript determinations and bupropion hydroxylase activity determinations were performed in triplicate.
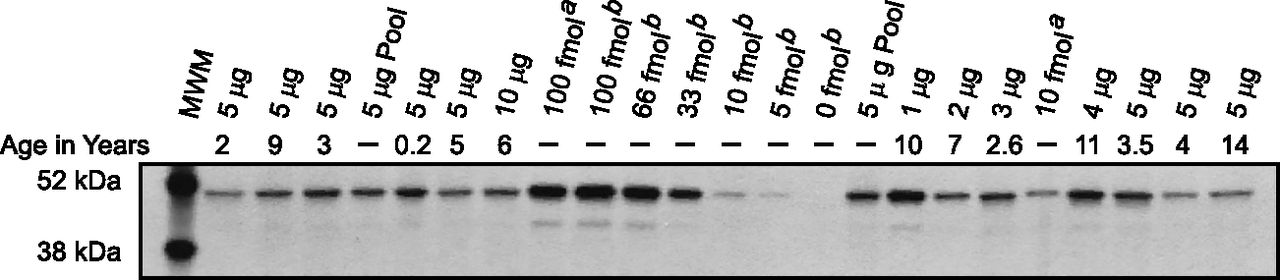
Polyclonal antibodies raised against CYP2B6 revealed a predominant immunoreactive band with an apparent molecular mass of approximately 50 kDa in HLMs. This immunoreactive protein comigrated with full-length, cDNA-expressed CYP2B6. A representative immunoblot illustrating a range of protein contents is shown in Fig. 2. Quantifiable levels of immunoreactive CYP2B6 protein were detected in all 201 microsomal preparations, although considerable interindividual variation (316-fold, range: 0.15–47.39 pmol/mg protein) was observed in CYP2B6 protein content across the entire liver tissue panel (Fig. 1B).

Immunoquantitation of CYP2B6 protein by western blot analysis. Representative western immunoblot showing the relative amounts of CYP2B6 protein from 1 to 10 µg of microsomal protein in a random set of HLMs. Immunoreactive CYP2B6 content was determined using a rabbit anti-human CYP2B6 antibody (Corning Gentest). A five-point standard curve from 5 to 100 fmol of heterologously expressed CYP2B6 (Corning Gentest; rCYP2B6: superscript a represents lot 5 and superscript b represents lot 18, as indicated) was used to quantify CYP2B6 protein. Pooled, adult HLMs served as a positive control, as well as an interassay control, and a molecular weight marker (MWM) was included to show protein size and also served as a negative control. Microsomal protein was loaded in proportion to bupropion hydroxylase activity to insure that CYP2B6 protein levels would fall within the linear, quantitative range of the standard curve. CYP2B6 protein determinations were performed in duplicate for each microsomal, Woburn, MA sample.
CYP2B6 activity was characterized by the rates that HLMs catalyzed bupropion hydroxylation (results shown in Fig. 1C). All 24 of the fetal liver microsomes failed to catalyze bupropion hydroxylation at discernable rates (i.e., yielding concentrations above the limits of detection). Postnatal microsomes prepared from five of the pediatric and two of the adult donors also did not appear to catalyze bupropion hydroxylation. An additional 21 pediatric and two adult microsomal preparations formed small quantities of hydroxbupropion but at levels below the limit of quantitation of the assay. CYP2B6 activity appears as early as the first day of life; bupropion hydroxylase activity was measurable (15.8 pmol/mg/min) in liver microsomes prepared from a 0-day-old donor. Consistent with the interindividual variation noted in mRNA and protein expression levels, considerable interindividual variation was observed in postnatal CYP2B6 activity where bupropion hydroxylase activity varied 648-fold (range: 5.73–3714 pmol/mg protein/min) among the panel of liver microsomes.
CYP2B6 mRNA, protein, and activity data were not normally distributed. Log transformation of CYP2B6 mRNA, protein, and activity approximated normal sample distributions; however, each failed the Shapiro-Wilk normality test (P < 0.05). Hence, relationships between various parameters (e.g., age, gender, etc.) with log-transformed mRNA, protein, and activity data were subsequently evaluated using nonparametric tests. Significant associations between age and log-transformed mRNA expression (Spearman’s ρ = 0.268, P < 0.002), protein content (ρ = 0.211, P < 0.003), and bupropion hydroxylase activity (ρ = 0.227, P < 0.006) were observed. Log-transformed mRNA expression was significantly associated with log-transformed CYP2B6 protein levels (ρ = 0.293, P < 0.001) and log-transformed bupropion hydroxylase activity (ρ = 0.560, P < 0.0001). Log-transformed CYP2B6 protein levels were also significantly associated with log-transformed bupropion hydroxylase activities (ρ = 0.828, P < 0.0001).
To determine if any developmental thresholds in CYP2B6 expression or activity were present, partitioning analyses were performed on log-transformed data. A breakpoint was identified for log-transformed mRNA expression at approximately 0.1 years of age (logworth value 71.6), which corresponds to the end of the neonatal period. Samples from donors with an age greater than or equal to 0.1 years of age had mean expression levels (geometric mean = 721 molecules/15 ng total RNA) 1000-fold greater than those from younger prenatal and neonatal donors (geometric mean = 0.72 molecules/15 ng total RNA). Similarly, breakpoints were observed for log-transformed protein levels at 0, 2, 11.5, and 39 years of age (logworth value scores of 8.54, 2.04, 2.11, and 5.30, respectively). Mean log-transformed CYP2B6 protein levels were ∼2-fold higher in fetal samples (geometric mean = 2.19 pmol/mg protein) than in samples from donors between the ages of 0 and 2 years (geometric mean = 0.85 pmol/mg protein). Protein levels subsequently increased in the samples from donors between the ages of 2 and 11.5 years of age (geometric mean = 2.39 pmol/mg protein), followed by a return to protein levels similar to those observed in the 0–2 age group in samples from donors between 11.5 and 39 years of age (geometric mean = 1.06 pmol/mg protein), with a subsequent rise in protein levels in samples from donors over 39 years of age (geometric mean = 4.62 pmol/mg protein). Breakpoints in log-transformed CYP2B6 activity appeared at 11 months and 12.4 and 39 years of age (logworth values of 3.52, 5.25, and 1.98, respectively). The geometric means of log-transformed bupropion hydroxylase activities were 19.8 pmol/mg protein/min in samples from pediatric donors less than 11 months of age, 129 pmol/mg protein/min in samples from donors 11 months to 12.4 years of age, 36 pmol/mg protein/min in samples from donors between 12.4 and 39 years of age, and 246 pmol/mg protein/min in samples from donors over 39 years of age.
Based on a composite of the breakpoints identified previously, the following age groups were constructed to uniformly evaluate changes in log-transformed CYB2B6 mRNA expression, protein content, and bupropion hydroxylase activity: fetal (prior to birth); 0 to <1; 1 to <12; 12 to <18; and >18 years of age. The results are given in Table 2. Similar to the results presented previousy, fetal mRNA expression was significantly different from all other age groups (Kruskal-Wallis followed by Dunn, P < 0.0005), but all other age groups were not statistically different. In contrast, fetal CYP2B6 protein content was not significantly different from protein levels observed in samples from donors aged 1 to <12 and >18 years of age. Significant decreases (>2-fold) were observed between CYP2B6 protein content in the 0 to <1 and 12 to <18 years of age groups and the aforementioned groups (Kruskal-Wallis followed by Dunn, P < 0.005 and P < 0.03, respectively), although these latter two groups were not significantly different from one another. Rates of CYP2B6 activity (as measured by rates of bupropion hydroxylation) among the age groups segregated similarly to that observed for protein, with the exception that activity in the fetal samples (no activity observed) was significantly different compared with rates from all other groups (P < 0.0001). Rates of CYP2B6 activity in the 0 to <1 years of age group were significantly lower (>5-fold) than those of either the 1 to <12 and >18 years of age groups (P < 0.0007), as were the CYP2B6 activity rates of the 12 to <18 years of age group (P < 0.03). No other significant differences between age groups were observed for CYP2B6 activity.
CYP2B6 mRNA expression, protein content, and bupropion hydroxylase activity
CYP2B6 expression and activities were compared among African American (n = 51), Caucasian (n = 92), and Hispanic (n = 6) samples along with a group combining samples with no reported ethnicity (n = 50) (Note two individuals were excluded from the comparison: one identified as Native American, the other as Pacific Islander.) No significant differences in CYP2B6 mRNA expression, protein levels, or activities were observed among each of the ethnic groups. Log-transformed CYP2B6 mRNA expression, protein levels, and activities did not differ significantly between females and males either (Wilcoxon, P = 0.765, 0.180, and 0.071, respectively), although mean CYP2B6 protein levels and activities were slightly higher in females compared with males (geometric mean, female/male: 1.96 versus 1.50 pmol CYP2B6/ mg protein; 104 versus 67 pmol/mg/min, respectively).
Donor sample quality and the potential for degradation of mRNA and enzymatic protein between the time of death and tissue freezing, known as the postmortem interval (PMI), is always a concern with studies of the type described here. The PMI was documented for 118 samples and ranged from 25 minutes to 25 hours (mean ± S.D.: 9.7 ± 5.9 hours). The PMIs were not significantly correlated with log-transformed CYP2B6 mRNA expression (ANOVA, P = 0.714; data not shown) or protein levels (P = 0.234), but were significantly correlated with bupropion hydroxylase activities (P = 0.007). However, the line of best fit between the PMI and the rates of bupropion hydroxylation had a positive slope, indicating that bupropion hydroxylase activities increased with increasing PMIs, a situation contrary to expectation. Because there are differences in the procedures used to process organs for research, we separated data from tissues recovered and frozen (but not perfused) from data arising from tissues that were perfused with preservation solution with the potential for transplantation, and we subsequently evaluated the relationship between the PMI and CYP2B6 mRNA expression, protein levels, and activities. Although perfused, postnatal livers tended to have a longer PMI (mean ± S.D.: 15.3 ± 5.8 hours) than samples from nonperfused livers (mean ± S.D.: 8.2 ± 4.8 hours), PMIs from both groups were not significantly correlated with CYP2B6 mRNA expression (ANOVA, P = 0.475 and 0.610, respectively), protein levels (P = 0.554 and 0.472, respectively), or bupropion hydroxylase activities (P = 0.772 and 0.934, respectively). Because there was no detectable bupropion hydroxylase activity observed in the fetal liver microsomes used in this study, it is important to note that these same microsomal samples have demonstrated CYP3A7 enzymatic activity, catalyzing the 2α- and 16β-hydroxylation of testosterone and the 16α-hydroxylation of dehydroepiandrosterone (Leeder et al., 2005).
It should also be noted that liver samples were collected on a convenience basis. As such, no power analyses were conducted prior to study initiation in order to determine the minimum number of samples required to detect statistically significant differences in each of the various groupings. Thus, there is the potential for false negative associations in groups containing small sample numbers, such as those in the neonatal age range and for certain genotypes.
Genotype Analyses.
Seven CYP2B6 sequence variations were interrogated and haplotypes constructed. Table 3 provides a summary of the SNPs present in each haplotype and their respective P450 nomenclature designations as well as estimated allele frequencies. For reference and ease of comparison, all allelic variants defined to date are listed in Table 3. None of the tentative novel haplotypes (*N1–*N6) corresponded to haplotypes defined by the Cytochrome P450 Nomenclature Committee (http://www.cypalleles.ki.se/).
CYP2B6 haplotype definitions and allele frequencies
Nucleotide numbering is based on the cDNA National Center for Biotechnology Information Reference Sequence NM_000767.4. Polymorphic nucleotides are shown in bold. Twelve variants are shown in bold; these are not identified by this SNP panel, and if present are defaulted to a CYP2B6*1 assignment. CYP2B6*29 and *30 are not listed because these are CYP2B7/CYP2B6 and CYP2B6/CYP2B7 hybrids, respectively, and CYP2B6*31 and *32 have not yet been released. The novel haplotypes identified in this study are labeled *N1–*N6. Allele frequencies are estimates based on PHASE (version 2.1) analysis that comprise a total of n = 271 samples including the n = 201 + 33 samples of the liver tissue panel.
The samples from this study were analyzed in combination with an additional 70 samples to increase the accuracy of the PHASE (version 2.1) output data. The three most common allelic variants were CYP2B6*5, *6, and *18 with frequencies of 9.03%, 27.55%, and 3.23%, respectively. The SNP frequencies were in Hardy-Weinberg equilibrium, with the exception of 983 T>C (rs28399499), which is part of the CYP2B6*16 and *18 haplotypes. This is likely due to the presence of two homozygous CYP2B6*18/*18 subjects among the liver tissue samples.
As shown in Table 4, diplotypes could not unequivocally be determined for 11 tissue samples. Different haplotype combinations may theoretically exist in these samples based on the genotype data for seven SNPs obtained from a total number of 271 samples including the 201 of the liver tissue panel. These samples have more likely and less likely (or alternate) diplotype assignments as listed in Table 4.
CYP2B6 diplotype frequencies
CYP2B6 haplotypes were determined by PHASE (version 2.1) and haplotypes were assigned according to CYP2B6 nomenclature and are summarized in Table 3. For 11 of the 201 liver tissue samples, haplotype combinations could not unequivocally be determined, i.e., there is a probability that a subject has an alternate diplotype. The less likely diplotype is provided as the alternate diplotype; probabilities are shown in parentheses.
Frequencies of POR (rs1057868), AKR1D1 (rs1872930), and PPARα (rs4253728) variant alleles were calculated to be 27.61%, 23.13%, and 21.14%, respectively, in the liver tissue panel. These were in Hardy-Weinberg equilibrium and were within ranges expected for a predominantly Caucasian sample cohort.
Impact of Genetic Variation on CYP2B6 mRNA Expression, Protein Levels, and Activity.
Due to the differences in mRNA expression and bupropion hydroxylase activity noted between prenatal and postnatal samples, the impact of genetic variation on CYP2B6 mRNA expression, protein levels, and activity were investigated only with postnatal samples, and the results are shown in Fig. 3. Compared with expression of the reference sequence, significantly lower mRNA expression (∼7-fold decrease, Kruskal-Wallis followed by Dunn, P = 0.038) was observed in samples from donors homozygous for the SNP at position 516 G>T (rs3745274), which is part of the CYP2B6*6 haplotype. There was also a trend for lower mRNA expression (∼7-fold reduction) in donor samples that were homozygous for 785 A>G (rs2279343), which is found in several allelic variants, including the CYP2B6*6 haplotype (Table 3). However, this decrease was not statistically significant (Kruskal-Wallis followed by Dunn, P = 0.073). Neither of these SNPs was associated with significant changes in either protein content or bupropion hydroxylase activity, nor was any other SNP found to be associated with significant differences in mRNA expression, protein levels, or CYP2B6 activity.

Relationship between diplotype and CYP2B6 mRNA transcript levels (A), CYP2B6 protein content (B), and bupropion hydroxylase activity (C) in human liver samples and microsomes. Solid diamonds represent postnatal samples and open circles represent fetal samples. Boxes represent the interquartile values and the line within each box represents the median value for postnatal samples. Whiskers represent boundaries for outliers (1.5 times interquartile boundaries). Note that no activity was detected in fetal liver microsomes, explaining the absence of respective data points in (C). CYP2B6 protein determinations were performed in duplicate, whereas CYP2B6 mRNA transcript determinations and bupropion hydroxylase activity determinations were performed in triplicate.
Although several CYP2B6 diplotypes (consisting of phased haplotypes) had higher or lower mean RNA expression, protein content, or bupropion hydroxylase activity (Fig. 3) compared with the values for samples from CYP2B6*1/*1 donors, no significant associations between CYP2B6 diplotypes and CYP2B6 mRNA expression, protein levels, or bupropion hydroxylase activities were observed (Tukey-Kramer). There were also no associations between CYP2B6 mRNA expression, protein levels, or CYP2B6 activity with either POR1*28 (rs1057868), AKR1D1 (rs1872930), or PPARα (rs4253728).
Modeling of CYP2B6 Activity and Protein Levels.
A linear regression model incorporating age, gender, ethnicity, CYP2B6 diplotype, and known exposure to CYP2B6 chemical inducers was formulated and the impact of each of the factors on log-transformed CYP2B6 activity or protein levels was assessed. The model accounted for 26% and 23% of the variability in CYP2B6 activity and protein expression, respectively. Individual contributions of each of the factors to CYP2B6 activity and protein expression were as follows: age, 5.1% and 6.3%; gender, 1.5% and 1.0%; ethnicity, 9.6% and 5.9%; genotype, 6.4% and 7.3%; and known inducer exposure, 3.0% and 2.6%, respectively. The low contribution of known inducer exposure to the model may be an underestimate of the true impact of CYP2B6 inducers on interindividual variability of CYP2B6 activity and protein levels. For most of the tissue donors included in this study, medication and drug exposure history were not well documented; only seven individuals had a documented history of chronic alcohol use or exposure to medications known to cause CYP2B6 induction. Hence, there is a strong possibility that there are donors in our sample set that may have had exposure to inducing agents that are not identified as such.
Discussion
Information regarding the effects of development on CYP2B6 expression and activity are scarce. Two early studies failed to detect CYP2B6 mRNA or protein expression in fetal liver samples (Mäenpää et al., 1993; Hakkola et al., 1994). Subsequently, Tateishi et al. (1997) compared liver microsomal cytochrome CYP protein expression between one group of 10 subjects less than 1 year of age (six infants and four perinatal subjects) with a second group of 10 subjects over the age of 1 year [including six pediatric-aged subjects (2–16 years) and four adults (22–72 year)] and found higher levels of CYP2B6 expressed after infancy than during infancy. CYP2B6 protein was detected in only two of the 10 samples from donors between 37 weeks gestation and 10 months of age (2.7 ± 5.9 pmol/mg protein) versus seven out of 10 samples for those older than 10 months of age (19.4 ± 23.9 pmol/mg protein).
To date, the most comprehensive study of CYP2B6 developmental changes characterized CYP2B6 protein levels in 217 fetal and pediatric liver samples from donors ranging from 10 weeks gestation to 17 years of age and compared protein expression levels with a limited genotype analysis (only CYP2B6*6 was tested) (Croom et al., 2009). Samples from donors with postnatal age >30 days had 2-fold higher CYP2B6 levels (median = 1.3; range = 0.0–23.9 pmol/mg protein) than samples from donors younger than 30 days of age (median = 0.6; range = 0.0–36.7 pmol/mg protein). CYP2B6 protein was detected in 64% of the fetal samples, whereas 90% of the samples from donors over the age of 6 months expressed quantifiable protein levels. It should be noted that none of the aforementioned studies characterized CYP2B6 activity in their samples. Several other studies have found no difference in CYP2B6 expression or activity in relation to age; however, each of these studies included only a few pediatric microsomal samples between the ages of 2 and 18 in their sample set (Hesse et al., 2004; Parkinson et al., 2004; Desta et al., 2007; Hofmann et al., 2008).
In the current study, we detected CYP2B6 protein in all of the microsomes prepared from liver samples obtained from 201 donors that spanned a wide range of ages (∼11 weeks gestation to 79 years of age). Our limit of quantitation was 5 fmol/lane, which represents a 6-fold reduction over the 31 fmol/lane limit of quantitation reported by Croom et al. (2009) and is comparable to limits of quantitation determined by highly accurate HPLC tandem mass spectrometry methods (Gröer et al., 2014) This increased sensitivity potentially explains, in part, our success in detecting CYP2B6 in all of our liver samples.
Although the infant and postinfant levels of CYP2B6 protein in our study were similar to those noted in previous studies (Tateishi et al., 1997; Hesse et al., 2004; Hofmann et al., 2008; Croom et al., 2009), we observed elevated levels of fetal CYP2B6 (∼4-fold). Interestingly, fetal livers contained extremely low levels of CYP2B6 mRNA relative to postnatal samples and all of the fetal microsomal samples failed to catalyze bupropion hydroxylation. It is unclear whether the fetal protein observed in our samples is an inactive form of CYP2B6, a previously unrecognized CYP2B isoform, or another protein of similar size that possesses an epitope that is recognized by the CYP2B6 antibody. Whatever the case, the protein recognized by the CYP2B6 antibody appears to have little or no capacity to catalyze bupropion hydroxylation and merits further investigation.
Our results demonstrate that CYP2B6 activity can appear as early as the first day of life. Liver microsomes prepared from a donor that died on their day of birth had measurable CYP2B6 activity (15.8 pmol/mg protein/min) and expression of mRNA (108 molecules/15 ng total RNA) that vastly exceeded those observed in the fetal samples. Our data suggest that CYP2B6 increases through infancy, and by 1 year of age CYP2B6 levels and activity may approach those of adults, which are 2- to 5-fold higher than the levels/activities in infants. We observed a decline in CYP2B6 protein and activity during adolescence followed by a return to child/preadolescent levels in adulthood. However, it is possible that the decrease observed during adolescence is an artifact of our sample set since this trend has not been corroborated by other studies (Hesse et al., 2004; Parkinson et al., 2004; Hofmann et al., 2008; Croom et al., 2009).
Tateishi et al. (1997) originally proposed that CYP developmental trajectories followed one of three paths. This model was based on only 20 human liver microsomal samples; however, it was corroborated in studies that provided supporting evidence for this classification for several hepatic CYP enzymes utilizing much larger sample numbers (Hines, 2007, 2013). The first group consists of those enzymes that are expressed at the highest levels in the fetus with a subsequent decline in expression following birth; CYP3A7 is a member of this group of enzymes. The second group consists of enzymes that are expressed in the fetus and remain at a relatively constant level throughout postnatal development; CYP2C19 exemplifies the members of this group. The third group of enzymes is expressed at very low levels (or not at all) in the fetus and just after birth, but demonstrates marked increases in expression thereafter; CYP3A4 and CYP2D6 belong in this last group of enzymes. Based on the protein expression observed by Croom et al. (2009), Hines (2013) classified CYP2B6 as a group 2 enzyme. However, the results of the current study suggest that CYP2B6 is perhaps more accurately classified as a group 3 enzyme based on the low level of mRNA expression and lack of bupropion hydroxylase activity in fetal liver, followed by a subsequent rise in expression of CYP2B6 mRNA and protein and in catalytic activity through the first year of life.
We observed considerable interindividual variation in CYP2B6 mRNA expression, protein levels, and activity across our entire set of postnatal HLMs (mRNA, ∼40,000-fold; protein, ∼300-fold; activity, ∼600-fold). However, the geometric mean of log-transformed CYP2B6 mRNA expression, protein levels, and activity in infants were only 2- to 5-fold lower than those of subjects older than 1 year of age. Interindividual variability in CYP2B6 expression and activity was not significantly associated with differences in gender, ethnicity, or CYP2B6 genetic variation. Although several CYP2B6 diplotypes were noted to have higher or lower mean expression or activity, these were not significant. Even individuals homozygous for the CYP2B6*6 allele, which causes reduced protein expression (Lang et al., 2001; Hofmann et al., 2008) and has been linked with lower bupropion hydroxylase activity both in vitro and in vivo (Desta et al., 2007; Hofmann et al., 2008; Benowitz et al., 2013), did not have significantly different expression levels or bupropion hydroxylase activities from those individuals homozygous for the CYP2B6*1 wild-type allele. Similar to our findings, Croom et al. (2009) also did not observe any significant difference in protein expression levels between samples genotyped as CYP2B6*6/*6 and those not carrying this allele.
Also, no significant associations were observed for ethnicity or gender, although females had mean CYP2B6 protein levels and activities that were slightly higher than those found in males. Gender differences in CYP2B6 are controversial. Although a few studies have reported gender differences in CYP2B6 protein or activity (Lamba et al., 2003; Al Koudsi and Tyndale, 2010; Naidoo et al., 2014), a number of other studies have not observed this phenomenon (Hesse et al., 2004; Parkinson et al., 2004; Hofmann et al., 2008; Croom et al., 2009). Exposure to inducers potentially could account for a portion of the large variability observed in this study; however, only two individuals had known exposure to drugs capable of inducing CYP2B6 (both 7 year olds) and five individuals had a history of chronic alcohol use (five adults), which has been shown to cause CYP2B6 induction (Hesse et al., 2004; Ferguson et al., 2013). However, it should also be noted that the medication and drug exposure history was not well documented for most of the tissue donors.
Individualizing doses of CYP2B6 medications to achieve therapeutic concentrations may prove to be challenging due to the polymorphic nature of the CYP2B6 gene and the fact that CYP2B6 is highly inducible. Further complicating the predictive ability of phenotype from genotype is that for some CYP2B6 variants the relative catalytic activity appears to be dependent on the substrate examined (Helsby et al., 2010; Helsby and Tingle, 2011, 2012). For example, individuals with a CYP2B6*6 allele demonstrate decreased efavirenz 8-hydroxylation and clearance in vivo (Naidoo et al., 2014) but increased cyclophosphamide 4-hydroxylation and clearance (relative to CYP2B6*1 homozygotes) (Xie et al., 2006). Hence, to accurately estimate CYP2B6 biotransformation capacity for a particular medication in an individual, an understanding of the influence of CYP2B6 genetic variation on the clearance of the drug will be required, and it may even be necessary to empirically determine drug clearance for some compounds, given the wide range of CYP2B6 interindividual variability.
In conclusion, this study has demonstrated that CYP2B6 mRNA expression levels and CYP2B6 activity are extremely low during fetal development, they increase after birth, and by 1 year of age they approach levels and activity observed in adults. Although a protein reacted with antibodies raised against CYP2B6 in fetal liver microsomes, this protein had no activity. Hence, it is unclear whether the protein observed in fetal samples is truly CYP2B6. CYP2B6 protein was observed in neonatal samples (confirmed by the presence of bupropion hydroxylase activity), increased to adult levels somewhere between 1 and 2 years of age, and possibly declined slightly during adolescence. Considerable interindividual variation in CYP2B6 mRNA expression, protein levels, and activity was observed in our extensive cohort of postnatal HLMs (mRNA, ∼40,000-fold; protein, ∼300-fold; activity, ∼600-fold). The extremely wide range of interindividual variability in CYP2B6 expression and activity in the present study was significantly associated with age following log transformation of the data. Surprisingly, CYP2B6 interindividual variability was not significantly associated with genetic variation in CYP2B6, nor was it associated with differences in gender or ethnicity, suggesting that factors other than these are largely responsible for the wide range of variability in CYP2B6 expression and activity observed among a large group of individuals/samples.
Acknowledgments
The authors thank Xenotech LLC for the generous gift of mRNA, DNA, and microsomes isolated from pediatric and adult human livers. Furthermore, we thank Dr. Jignesh Dalal and Dr. Kathleen Neville for the contribution to securing funding for this project from the Tom Keaveny Endowed Fund, participation in project discussions, and critical reading of the manuscript.
Authorship Contributions
Participated in research design: A. Gaedigk, R. Gaedigk, Leeder, Pearce.
Conducted experiments: R. Gaedigk, Pearce, Riffel, Twist.
Performed data analysis: Dai, A. Gaedigk, R. Gaedigk, Pearce, Riffel, Twist.
Wrote or contributed to the writing of the manuscript: A. Gaedigk, R. Gaedigk, Leeder, Pearce, Riffel, Twist.
Footnotes
- Received September 30, 2015.
- Accepted November 19, 2015.
This project was supported by a grant from the Tom Keaveny Endowed Fund for Pediatric Cancer Research and discretionary division funding. The Liver Tissue Cell Distribution System is funded by the National Institutes of Health [Contract N01-DK-7-0004/HHSN267200700004C]. The project, entitled “Laboratory of Developmental Biology,” was supported by an award from the Eunice Kennedy Shriver National Institute of Child Health & Human Development of the National Institutes of Health [Award 5R24HD0008836]. The content does not necessarily represent the official views of the Eunice Kennedy Shriver National Institute of Child Health and Human Development of the National Institutes of Health.
Abbreviations
- ANOVA
- analysis of variance
- gDNA
- genomic DNA
- HLM
- human liver microsome
- HPLC
- high-performance liquid chromatography
- M-TNT
- TNT containing 4% dry milk powder
- PCR
- polymerase chain reaction
- P450
- cytochrome P450 enzyme
- PMI
- postmortem interval
- SNP
- single nucleotide polymorphism
- TNT
- 10 mM Tris HCl, 150 mM NaCl, and Q:13 0.05% Tween-20, pH 8.0
- Copyright © 2016 by The American Society for Pharmacology and Experimental Therapeutics


