


Abstract
Clopidogrel is an antiplatelet agent widely used in cardiovascular diseases and an inactive prodrug that needs to be converted to an active metabolite in two sequential metabolic steps. Several CYP450 isoforms involved in these two steps have been described, although the relative contribution in vivo of each enzyme is still under debate. CYP2C19 is considered to be the major contributor to active metabolite formation. In the current study, net CYP2C19 contribution to the active metabolite formation was determined from exposure of the active metabolite in two clinical studies (one phase I study with well balanced genetic polymorphic populations and a meta-analysis with a total of 396 healthy volunteers) at different clopidogrel doses. CYP2C19 involvements were estimated to be from 58 to 67% in intermediate metabolizers (IMs), from 58 to 72% in extensive metabolizers (EMs), and from 56 to 74% in ultrarapid metabolizers (UMs), depending on the study and the dose. For this purpose, a static model was proposed to estimate the net contribution of a given enzyme to the secondary metabolite formation. This static model was compared with a dynamic approach (Simcyp model) and showed good consistency. In parallel, in vitro investigations showed that omeprazole is a mechanism-based inhibitor of CYP2C19 with KI of 8.56 μM and Kinact of 0.156 min−1. These values were combined with the net CYP2C19 contribution to the active metabolite formation, through a static approach, to predict the inhibitory effect at 80-mg omeprazole doses in EM, IM, and UM CYP2C19 populations, with good consistency, compared with observed clinical values.
Introduction
The antiplatelet agent clopidogrel is a prodrug, which is metabolized in a two-step oxidative process by the hepatic cytochrome P450 (P450) isozymes CYP1A2, CYP2B6, CYP2C19, and CYP3A4 and is converted to its active metabolite (clopi-H4) (Kazui et al., 2010). This leads to inhibition of adenosine diphosphate-induced aggregation by irreversible binding of the platelet P2Y12 receptor. An esterase-dependent step leads to an inactive carboxylic acid derivative that represents 85% of circulating plasma compounds (Lins et al., 1999). Polymorphisms of CYP2C19 affect both the pharmacodynamic and pharmacokinetic profiles of clopi-H4, and it has been determined that this isoform is one of the major determinants of interindividual variability in clopidogrel pharmacodynamic and pharmacokinetic responsiveness (Hulot et al., 2006; Kim et al., 2008; Umemura et al., 2008; Mega et al., 2009), although CYP3A4 has also been described as contributing to clopi-H4 pharmacokinetic variability in the clinic (Farid et al., 2007). In addition, CYP2C19 involvement in the formation of clopi-H4 was recently confirmed in a randomized crossover study conducted in four balanced CYP2C19 phenotype-defined metabolizer groups (n = 10/group) (Simon et al., 2011). The authors of this study also performed a meta-analysis on data from 396 healthy subjects and confirmed that CYP2C19 is the most important polymorphic P450 involved in clopi-H4 formation and antiplatelet response, whereas CYP1A2, CYP2C9, CYP3A5, and CYP2D6 played no significant roles.
Because of increased risk of bleeding, antiplatelet therapy recipients are often coprescribed proton pump inhibitors (PPIs), e.g., omeprazole. The reduced ability of clopidogrel to inhibit platelet aggregation in omeprazole recipients was documented in a randomized, double-blind trial (Gilard et al., 2008). In contrast, the PPI pantoprazole did not significantly affect the antiplatelet activity of clopidogrel; only a small decrease (14%) in clopi-H4 exposure was observed (Angiolillo et al., 2011). In a recent study, a hypothesis was proposed to interpret the phenomenon of PPI inhibition and omeprazole in particular. This hypothesis is based on the finding that clopidogrel itself is a mechanism-based inhibitor of CYP2C19 and that the amplified effect of PPIs is mainly due to the inhibition of their own metabolism by clopidogrel (Zhang et al., 2009).
This study was designed to evaluate an alternative hypothesis. To explain the impact of omeprazole on clopi-H4 exposure, a mechanism-based inhibition of omeprazole toward CYP2C19 was hypothesized, and a static drug-drug interaction (DDI) modeling approach was used to estimate the in vivo effect. This hypothesis is supported by the similar effect observed when omeprazole and clopidogrel were administered simultaneously or 12 h apart (Angiolillo et al., 2011). Even if omeprazole is a well known CYP2C19 inhibitor, it has been commonly considered to be a competitive reversible inhibitor (Li et al., 2004; Liu et al., 2005). No in vitro parameters of mechanism-based inhibition (MBI) are available in the literature (literature databases sources: University of Washington Drug Interaction database; AurSCOPE ADME/DDI from Aureus Sciences, Paris, France; for both, requests were sent on March 10, 2011). Nevertheless, MBI of omeprazole has been proposed previously (Paris et al., 2008).
In this study, the net relative contribution (Fm) of CYP2C19 to clopi-H4 formation was estimated in three different CYP2C19 metabolizer groups, intermediate (IMs), extensive (EMs) and ultrarapid (UMs) metabolizers, with data obtained from a phase I clinical study with well balanced genetic polymorphic populations and from the meta-analysis described previously (Simon et al., 2011). A static model was proposed and can be generalized for more metabolic steps to estimate the net contribution of a given polymorphic (or total inhibition of) enzyme to the secondary metabolite formation. A dynamic model in Simcyp software was used to compare the predictions with the two types of models. The dynamic model is based on physiologically based pharmacokinetic (PBPK) modeling, in which all the calculations that are time- and concentration-dependent are taken into account, as well as organ parameters such as changes in enzymes synthesis or degradation rates, and the corresponding intersubject variabilities. In addition, for the current analysis, a special module of the Simcyp software was used, which takes into account two sequential metabolic steps.
The inhibitory mechanism of omeprazole and the mechanism-based inhibition parameters toward CYP2C19 were determined in vitro to predict, via a static model, the inhibitory effect of several doses of this PPI on clopi-H4 plasma levels after clopidogrel loading and maintenance doses in IM, EM, and UM CYP2C19 subjects. To support these predictions, they were compared with available clinical pharmacokinetic data (i.e., after repeated doses of 80 mg of omeprazole with clopidogrel loading and maintenance doses).
Materials and Methods
Chemicals.
Clopidogrel [2-(2-chlorophenyl)-2-(2,4,5,6,7,7ahexahydrothieno [3,2c]pyridine-5yl-acetic acid methylester, 7S] and active clopi-H4 metabolite [(3Z)-a-methyl ester, 3-(carboxymethylene)-a-(2-chlorophenyl)-4 (R or S)-mercapto-1-piperidineacetic acid] were synthesized at sanofi-aventis (Montpellier, France). Omeprazole, 1H-benzimidazole (5-methoxy-2-[[(4-methoxy-3,5-dimethyl-2-pyridinyl)methyl]sulfinyl]-5-methoxy-2-[[(4-methoxy-3,5-dimethyl-2-pyridinyl)methyl]sulfinyl]benzimidazole), and pantoprazole [6-(difluoromethoxy)-2-[(3,4-dimethoxypyridin-2-yl)methylsulfinyl]-1H-benzimidazole] were obtained from Sigma-Aldrich and stored in a 1:1 (v/v) mixture of methanol-water.
In Vitro Study Determination of Mechanism-Based Inhibition by Omeprazole or Pantoprazole.
A pooled human liver microsome (HLM) preparation from 50 donors was obtained from XenoTech, LLC (Lenexa, KS) and stored at −80°C. CYP2C19 and CYP3A activity assays and bioanalytical methods were previously validated for the quantification of marker metabolites, hydroxymephenytoin (CYP2C19), hydroxymidazolam, or 6β-hydroxytestosterone (CYP3A) in HLM mixtures. To determine KI and Kinact, HLM reaction mixtures were preincubated for various time periods at 37°C with test compounds (at multiple concentrations selected to observe 10–90% inhibition or up to maximal solubility), an NADPH-regenerating system, and 10-fold concentrated microsomal protein relative to typical conditions. At the end of the preincubation period, reaction mixtures were diluted 10-fold into a second set of reaction mixtures containing probe substrate (at 4- to 8-fold of Km concentrations) and fresh NADPH-regenerating systems and incubated for an additional time specified for each P450 activity assay as described by Grimm et al. (2009). The amount of metabolite formed from the probe substrate was quantified using LC-MS/MS methods that were specific for each P450 activity assay.
To determine the inactivation rates (Kobs) at different test compound concentrations, the decrease in natural logarithm of activity versus time was plotted, and Kobs values were described as the negative slope of the line for each test compound concentration.
Apparent Kinact and KI values were determined by nonlinear regression analysis using SigmaPlot (version 10.0; SPSS, Inc., Chicago, IL) based on eq. 1:
 where Kobs (minutes−1) is the inactivation rate for a single test compound concentration, I (micromolar concentration) is the concentration of test compound, Kinact (minutes−1) is the maximal rate of enzyme inactivation, and KI (micromolar concentration) is the test compound concentration that produces one-half the maximal rate of enzyme inactivation.
Static Prediction Models.
General static model.
The AUC of a given metabolite, after oral administration of the drug, is defined with eq. 2 (Houston, 1986; Pang 1995). Gut metabolism is considered as negligible (Fg = 1); therefore, the simplified equation, derived from Pang, 1995, is proposed:
 where Fm1 is the fraction of the drug converted into the metabolite M1 and Cl(M1) is the clearance of the metabolite M1. Fa and Fh (M1) are the fraction absorbed of the drug and the systemic availability of the metabolite that can be conceived as the ratio of the amount of the metabolite leaving the liver to the amount of metabolite formed. Fh (M1) is dependent on its extraction ratio [Eh (M1)], which in turn is dependent on the metabolite hepatic clearance and blood flow (Qh) with Fh (M1) = 1 − Clh (M1)/Qh. Assuming that M1 is partially metabolized into M2 as represented in Fig. 1, then the AUC of the M2 metabolite can be defined as eq. 3, also derived from Pang, 1995:
 where Fm2 is the fraction of M1 converted into M2, Cl(M2) is the clearance of the metabolite M2, and Fh (M2) is availability of the M2 metabolite.

Schematic representation of the sequential metabolic steps up to the production of the metabolite of interest (M2 in the figure). In this illustration, M2 is produced only from metabolite M1 through CYP,Y and CYP,Z isoforms and is eliminated through a non-P450 mechanism. The CYP,Y isoform is involved in the first and second metabolic steps and can be considered to be CYP2C19 in the clopidogrel situation. Ma and Mb represent the metabolites at the first and second metabolic steps, respectively; these are not involved in the formation of the metabolite of interest. Fm refers to the fraction of drug or metabolite that is eliminated by the pathway shown with an arrow. In this diagram, only two metabolic steps are represented.
A general equation can then be proposed (eq. 4):
 where q represents the metabolic steps for a given metabolite produced after q sequential metabolic steps and only at the last metabolic step and Cl(M, q) and Fh (M, q)are the clearance and the systemic availability of this metabolite.
Considering that several CYP450 isoforms are able to generate the downstream metabolites at each step, and one of these CYP450 isoforms (called CYP,Y) is polymorphic (or totally inhibited after coadministration of a strong inhibitor), then, in the PM population (no activity of CYP,Y isoform), exposure of metabolite M1 is defined by eq. 5:
 where Fm1, CYP, Y is the dose fraction converted into M1 due to the genetic polymorphic enzyme CYP,Y and Cl′(M1) and F′h (M1) are the new clearance and availability of M1 different from ClM1 and Fh (M1) if CYP,Y is involved in the metabolism of M1. Fm1 − Fm1, CYP, Y represents the fraction of drug conversion into M1 that is not due to CYP,Y in EMs.
If metabolite M1 is formed by only one additional P450, called CYP,X (in addition to CYP,Y in EMs), then the equation is simplified to that in eq. 6:
 for a given metabolite produced after q sequential metabolic steps (and only at the last metabolic step), the AUC metabolite ratio (R) in the case of total P450 inhibition or P450 genetic polymorphism comparison (i.e., PM versus EM) can be calculated as in eq. 7:
 or eq. 8:
 where q represents the metabolic steps and k represents the P450 isoforms involved at each metabolic step in the formation of the corresponding sequential metabolite. CYP,Y represents the inhibited or the shut down (i.e., genetic polymorphism CYP2D6, CYP2C19) isoform involved. Fml and F′ml are the relative contributions, at each metabolic step 1 of the sequential metabolites leading to the metabolite of interest (Fig. 1) without and with inhibition (or EM versus PM), respectively. CYP,Y can be involved at one or more than one metabolic step. Fml, CYP,Y is the relative contribution of a given CYP,Y involved in the formation of the sequential metabolite produced at the metabolic step 1. Cl(M, q) and Cl′(M, q) are the clearance of the metabolite of interest without and with total inhibition (or in EM versus PM) respectively, produced after q metabolic steps. Fh (M, q) and F′h (M, q) are the systemic availabilities of the metabolite of interest without and with total inhibition (or in EM versus PM), respectively, produced after q metabolic steps.
These equations allow the estimation of the metabolite AUC ratio in different situations (i.e., PM population, total inhibition of one enzyme), using the different contribution of each enzyme at each metabolic step, through a static approach. Assuming the same clearance and systemic availability for the metabolite of interest, the same fraction absorbed of the drug, it is noteworthy that the exposure ratio of the metabolite, even with one metabolic step, does not equal the contribution in the drug clearance of the polymorphic enzyme.
Application to the clopidogrel situation.
Based on the AUC of clopi-H4 metabolite in the four CYP2C19 genetic polymorphic groups, CYP2C19 Fm values for UMs, EMs, and IMs (represented by EMs in the following equations) were determined using the following equations:
In EM CYP2C19 (eq. 9):

In PM CYP2C19 (eq. 10):
where Fm and F′m are the fractions of the dose converted to active metabolite in EM and PM subjects, respectively. These fractions are relatively low (no more than 0.10–0.15) because the majority of clopidogrel is converted in nonactive metabolites in vivo (Lins et al., 1999; Close, 2011) as well as in vitro (Hagihara et al., 2009) so that AUCH4 is likely to change after inhibition or induction of the P450 isoforms involved in its formation. Fm, 2C19 is the fraction of clopidogrel dose converted to clopi-H4 due to CYP2C19; Fm, x is the fraction of clopidogrel dose converted to clopi-H4, not due to CYP2C19 (other P450 isofroms involved in its formation). Fh (H4) is the availability of the active metabolite H4.


With Fm = Fm, x + Fm, 2C19 in EM and F′m = F′m, x in PM subjects (because F′m, 2C19 = 0 in PM subjects), we have, in PM, eq. 11 (equivalent to eq. 6):
 Assumptions are the following:
Cl(H4) (elimination clearance of clopi-H4) and Fh (H4) (availability of the H4 metabolite) are considered to be the same in both populations. This assumption is reasonable because the clopi-H4 metabolite is likely to be mainly eliminated through covalent binding to platelets because of the mechanism of action (i.e., irreversible modification of the platelet P2Y12 receptor), as stated in a recent review on the clopidogrel metabolic pathway (Sangkuhl et al., 2010). Therefore, Cl(H4) as well as Clh (H4) (metabolic clearance of the clopi-H4 metabolite) and the corresponding Fh (H4) (see above definition of Fh (M)) are assumed to be similar in both populations. Fraction absorbed (Fa) is also considered to be the same in all genetically polymorphic populations.
The two metabolic steps from clopidogrel to active metabolite were gathered in a global approach. Therefore, eqs. 7 or 8 can be simplified in eq. 12. The AUC ratio of clopi-H4 can then be calculated with eq. 12:
Clopidogrel is mainly converted to a nonactive acid metabolite. Therefore, Fm, 2C19 can be assumed to be very low relative to unity (Gurbel et al., 2009). In vitro data suggest that Fm, 2C19 = 0.04 to 0.02 (Hagihara et al., 2009). Thereby, eq. 12 can be simplified in eq. 13:
where 1 − R represents the fractional decrement in total clopi-H4 “clearance” formation due to CYP2C19, (i.e.. Fm H4, 2C19) and is defined by eq. 14:
or
The same calculations were used to determine Fm, 2C19 in UM and IM CYP2C19 metabolizers.In this static model, as previously mentioned, gut metabolism is not taken into account (Fg = 1). Generally speaking, it has been shown that clopidogrel is mainly metabolized by a specific carboxylesterase, CES1, and not CES2. In humans, CES1, is highly expressed in the liver and lung, whereas the CES2 isozyme CE2 is mainly expressed in the small intestine (Tang et al., 2006; Imai and Ohura, 2010). In addition, in vitro investigations showed that CYP1A2, CYP2B6, and CYP2C19 contributed to clopidogrel thiolactone metabolite formation from clopidogrel in human liver microsomes (Hagihara et al., 2009). Therefore, CYP3A4, considered to be the major isoform in the gut, does not seem to be involved in the first step of clopidogrel metabolism, leading to the active metabolite. These results suggest that the CYP450 isoforms involved in the active metabolite formation, are only slightly expressed in the gut, generally speaking, compared with the liver; reflecting no major contribution of the gut. This hypothesis is also stated in the recent clopidogrel metabolic pathway review (Sangkuhl et al., 2010).


DDI prediction model: predicted decrease of clopi-H4 exposure after coadministration of omeprazole.
With AUC′H4 and AUCH4 clopi-H4 exposures with and without omeprazole, respectively, eq. 15 was used (adapted from Rowland and Martin, 1973; Venkatakrishnan and Obach, 2005; Grimm et al., 2009),
 with eq. 16 for MBI (from Mayhew et al., 2000,
 and with eq. 17 for reversible inhibition (not used in this study):

It has been previously shown that for MBI the best predictions are obtained using unbound systemic maximum concentration (Cmaxu) for the inhibitor concentration (Fahmi et al., 2009; Boulenc et al., 2011): [I] = Cmaxu.
Dynamic Prediction Model.
To estimate the accuracy of the proposed static model, predicted ratios of the metabolite exposures in PMs and EMs were compared with those obtained with a dynamic model. Simcyp algorithms (version 10.05 SE; Simcyp Ltd., Sheffield, UK) were used to predict M2 exposure in CYP2C19 PM and EM populations with several CYP2C19 involvements (Fm, 2C19) at metabolic steps 1 and 2 (Fig. 1). In the current Simcyp version, the pharmacokinetics of only one metabolite (first step) can be addressed. Nevertheless, for modeling a secondary metabolite, a sequential metabolite of the primary metabolite was implemented as a specific module, through collaboration between Simcyp Ltd. and sanofi-aventis, with the following assumptions: the secondary metabolite is only formed from a primary metabolite of the substrate; the secondary metabolite is available for metabolism and inhibition instantaneously; and the substrate is given orally and can be administered as a single dose or multiple doses. In line with the substrate primary metabolite, only a one-compartment absorption model is considered by a minimal PBPK model. As a result, transporter kinetic models (e.g., hepatic transporters) are not applicable. Differential equations describing the formation and elimination of metabolites in Simcyp are described by Rowland Yeo et al. (2010) and are available as supplemental data.
Simcyp models were set up using clopidogrel and its metabolites (i.e., 2-oxo metabolite for M1 and clopi-H4 for M2), with the following input data. For unchanged drug (i.e., clopidogrel): mol. wt., 321.8; log P, 3.89; monoprotic base, pKa = 4.6; blood/plasma = 1, fu = 0.02; first-order absorption with fa = 0.75 and ka = 1.38 h−1; and Vss = 140 l/kg. For M1 (i.e., 2-oxo metabolite) metabolite: mol. wt., 337.8; log P, 2.96; monoprotic base, pKa = 3.41; blood/plasma = 1, fu = 0.02; and Vss = 0.796 l/kg. For M2 metabolite (i.e., clopi-H4): mol. wt., 355.8; log P, 3.6; diprotic base, pKa1 = 5.1, pKa2 = 3.2; blood/plasma = 1, fu = 0.02; Vss = 3.0 l/kg; and Cl(IV) = 150 l/h (for both PM and EM populations).
This model was not validated, strictly speaking, with a formal comparison between observed and predicted exposure parameters. The aim of this investigation was to use the same set of Fm values in the dynamic and static model for comparison purposes.
Dynamic and Static Model Comparison.
Dynamic and static models are not using the same type of parameters as input data. Fm values cannot be directly implemented as input data in Simcyp software. Therefore, different CYP2C19 intrinsic clearance values were selected to simulate different sets of Fm values (Table 4). FM values determined by Simcyp for each subject (individual values) in the Simcyp population (i.e., 10 virtual subjects per simulation) were used in the static model, individually. Thereby, the same individual Fm values were used to run simulations in static and dynamic approaches; means and S.D. were calculated for each simulation. In Simcyp, simulations were conducted with the same PM and EM virtual populations of 10 subjects, generated by a Monte Carlo simulation, regardless of the CYP2C19 metabolic status, to discard any other sources of variability and to have a pure comparison between the dynamic (PBPK model with differential equations) and the static models. Ratio exposures of the secondary metabolite in EMs versus PMs were calculated for each subject, with means and S.D. reported.
Clinical Trial Outcomes.
Details of clinical trials used in this publication have been described previously (Angiolillo et al., 2011, regarding the effect of PPI on H4 active metabolite; Simon et al., 2011, regarding the effect of CYP2C19 polymorphism and meta-analysis results).
Four randomized, single-center, placebo-controlled, two-treatment, two-period crossover studies were conducted. The trial designs were as follows: clopidogrel 300-mg loading dose plus 75 mg/day for 4 days or placebo ± omeprazole 80 mg/day administered simultaneously (study 1) or 12 h apart (study 2); clopidogrel 600-mg loading plus 150 mg/day for 4 days or placebo ± omeprazole 80 mg/day administered simultaneously (study 3); and clopidogrel 300-mg loading plus 75 mg/day for 4 days or placebo ± pantoprazole 80 mg/day administered simultaneously (study 4) (Angiolillo et al., 2011). Regardless of the treatment sequence, omeprazole was given for 5 days before clopidogrel or placebo administration to achieve steady-state pharmacokinetic and pharmacodynamic conditions, and pantoprazole was given for 7 days before clopidogrel or placebo to reach its maximum pharmacological effect. The clopidogrel washout duration between the two periods was >14 days. Healthy subjects aged 18 to 65 years were eligible for enrollment if they provided written informed consent, had a body weight of 50 to 95 kg (40–85 kg for women), and had a body mass index of 18 to 30 kg/m2. The number of subjects in each study ranged from 66 (study 4, including 6 placebo subjects) to 72 (studies 1, 2, and 3).
A clinical study was also conducted to compare clopidogrel and clopi-H4 in four CYP2C19-defined metabolizer groups (study 5). This single-center, randomized, placebo-controlled, two-treatment, two-period crossover study in four CYP2C19-defined metabolizer groups (PM, IM, EM, and UM) was conducted to determine whether CYP2C19 polymorphisms affect the pharmacokinetics of 300 mg/75 mg or 600 mg/150 mg clopidogrel (Simon et al., 2011). The number of subjects was 40 (10/group).
In addition, a pooled analysis of data obtained from healthy subjects enrolled in seven phase I studies (study 6) was also performed to replicate the CYP2C19 genetic analysis on clopidogrel and clopi-H4 (Simon et al., 2011). The numbers of subjects for each CYP2C19 population having received loading or maintenance doses are presented in Table 1. This meta-analysis was conducted with a total of 396 subjects. Overall, the pharmacokinetic population included 388 subjects for the loading dose and 353 subjects for the maintenance dose.
Cytochrome P450 2C19 alleles assessed as part of the meta-analysis (study 6) and their corresponding genotypes, predicted metabolizer phenotypes, and distribution
Bioanalysis and Pharmacokinetic Analysis.
Clinical bioanalytical and pharmacokinetic analyses of clopi-H4 active metabolite, omeprazole, and pantoprazole have been accurately described previously (Angiolillo et al., 2011; Simon et al., 2011).
Clopi-H4 analysis.
For studies 1 to 5, plasma samples for pharmacokinetic assessment of clopidogrel and clopi-H4 were collected on day 1 and day 5 at T0, T0.25, T0.5, T1, T1.5, T2, T3, T4, T6, T10, T16, and T24 in both periods, except that clopi-H4 was not assessed at T16 and T24 in study 4. Clopi-H4 plasma concentrations were assayed by sanofi-aventis, (Bridgewater, NJ; Malvern, PA; and Montpellier, France) using validated LC-MS/MS with lower limits of quantification (LLOQ) of 0.5 ng/ml (Tuffal et al., 2011). Stability investigations covered all the plasma concentration measurements conducted in these clinical trials. Among the pharmacokinetic parameters calculated, only the AUC extrapolated to infinity on day 1, and area under the plasma concentration versus time curve calculated using the trapezoidal method from T0 to Tlast (AUClast) on day 5 are used in the current analysis.
PPI analysis.
In studies 1 and 3, plasma samples for pharmacokinetic assessment of omeprazole were collected on day −5 at T0 and T2, on day 1 at T0 and T2, and on day 5 at T0 and T2 in the period of clopidogrel or placebo + omeprazole. In study 2, plasma samples for pharmacokinetic assessment of omeprazole were collected on day −5 at T0 and T2 after the dose of omeprazole, on day −1 at T12 after the dose of omeprazole dose (before the dose of clopidogrel or placebo dose on day 1 T0), on day 1 at T0 and T2 after the omeprazole dose (T12 and T14, respectively, after the dose of clopidogrel or placebo), on day 4 at T12 (before the dose of clopidogrel or placebo on day 5), and on day 5 at T0 and T2 after the dose of omeprazole (T12 and T14, respectively, after the dose of clopidogrel or placebo on day 5). Omeprazole was assayed using a validated LC-MS/MS method with an LLOQ of 5 ng/ml by Covance (Indianapolis, IN). In study 3, plasma samples for pharmacokinetic assessment of pantoprazole were collected on day −7 and day 1 at T0 and T2 and on day 5 at T0, T0.5, T1, T1.5, T2, T3, T4, T6, T10, T12, and T24 in the period of clopidogrel or placebo + pantoprazole. Pantoprazole was assayed using a validated liquid chromatography-mass spectrometry method with a LLOQ of 20.0 ng/ml by Anapharm (Québec City, QC, Canada).
All pharmacokinetic parameters were calculated using noncompartmental techniques and PKDMS (version 2.0), incorporating WinNonlin Professional (version 5.2.1; Pharsight, Mountain View, CA).
Statistical Analyses.
Effects of omeprazole at days 1 (loading dose) and 5 (maintenance dose) were assessed on AUC (day 1) and AUClast (day 5) for clopidogrel and clopi-H4 compounds based on data from studies 1, 2, and 3. A linear mixed-effects model was used with fixed terms for treatment, sequence, period, and sex and with an unstructured R matrix of treatment (i,j) variance and covariance, grouped by treatment for subject within sequence blocks, using SAS PROC MIXED. Estimates and 95% CIs for the ratios of clopidogrel + omeprazole 80 mg versus clopidogrel alone at days 1 and 5 were obtained by computing estimates and 95% CIs for the differences between treatment means within the linear mixed-effects model framework and then converting to ratios by the antilog transformation. In all models, two-sided P values with a threshold of <0.05 were used to test for significance.
For the pharmacogenetic study (study 5), day 1 (loading dose) and 5 (maintenance dose) estimates of clopi-H4 AUC (day 1), and AUClast (day 5) were obtained separately for each dose regimen by computing estimates and 95% CIs for the ratios of PMs versus IMs, EMs, and UMs within a linear fixed-effects model framework (with fixed terms phenotype, period, and sex) on log-transformed data and converting to ratios by antilog transformation.
For the pooled analysis (study 6), log-transformed AUC (day 1) and AUClast (day 5) of clopi-H4 were analyzed by using a linear fixed-effects model for CYP2C19 with fixed terms for study, dose, sex, and phenotype plus covariates for age and weight. Estimates and 95% CIs for the ratios of PMs versus IMs, EMs, and UMs were obtained by computing estimates and 95% CIs for the differences between phenotype means within the linear mixed-effects model framework and then converting to ratios by the antilog transformation.
A two-sample t test for unequal variances or the two-sample t test for equal variances was used to conclude whether the mean plasma omeprazole concentrations of the clopidogrel + omeprazole treatment was significantly different from the mean plasma omeprazole concentrations of the placebo + omeprazole treatment.
Results
PPI with and without Clopidogrel.
Omeprazole and pantoprazole plasma concentrations after coadministration with clopidogrel or placebo are presented and compared in Tables 2 and 3, respectively.
Omeprazole plasma concentrations coadministered with placebo or clopidogrel in studies 1, 2, and 3 (see Materials and Methods)
Data are arithmetic means (S.D.).
Pantoprazole exposures after coadministration with clopidogrel or placebo in study 4 on day 5
Data are arithmetic mean (S.D.) after administration of 80 mg/day pantoprazole for 12 days (see Materials and Methods).
Clopidogrel did not have a pronounced effect on omeprazole or pantoprazole plasma concentrations after coadministration. In Table 2, even if the comparison between the group receiving placebo and clopidogrel is unbalanced, there is no trend suggesting an increase of omeprazole plasma concentration when it was coadministered with clopidogrel, supported by the lack of statistical difference when the two treatments are compared. Clopidogrel coadministration had minimal effect on omeprazole pharmacokinetic time dependence. Moreover, an increase in omeprazole was observed after repeated administration as already described, suggesting a clearance decrease of the compound (Shi and Klotz, 2008). These results are addressed under Discussion.
After repeated coadministration of pantoprazole and clopidogrel, a 35% increase in pantoprazole maximum concentration (Cmax) and a small concomitant increase in AUC (8%) were observed, suggesting no clear impact of clopidogrel toward pantoprazole clearance in our conditions, with no clear statistical significance even if the effect on Cmax is nearly significant.
Determination of Kinetic Parameters for Mechanism-Based Inhibition.
Omeprazole.
Mechanism-based inhibition of CYP2C19 and CYP3A4 activities by omeprazole was observed, based on a shift in IC50 values in the HLM reaction mixtures after preincubation. Irreversible inhibition of CYP2C19 metabolic activity by omeprazole was characterized by determining the enzyme kinetic constants, apparent Kinact and KI, in HLM reaction mixtures using nonlinear regression analysis (Figs. 2 and 3). Experiments were also conducted in reaction mixtures containing HLM to determine kinetic constants for irreversible inhibition of CYP3A4 by omeprazole, but the kinetic constants could not be determined because omeprazole caused minor mechanism-based inhibition of CYP3A4 activity at concentrations up to 500 μM (maximal solubility).
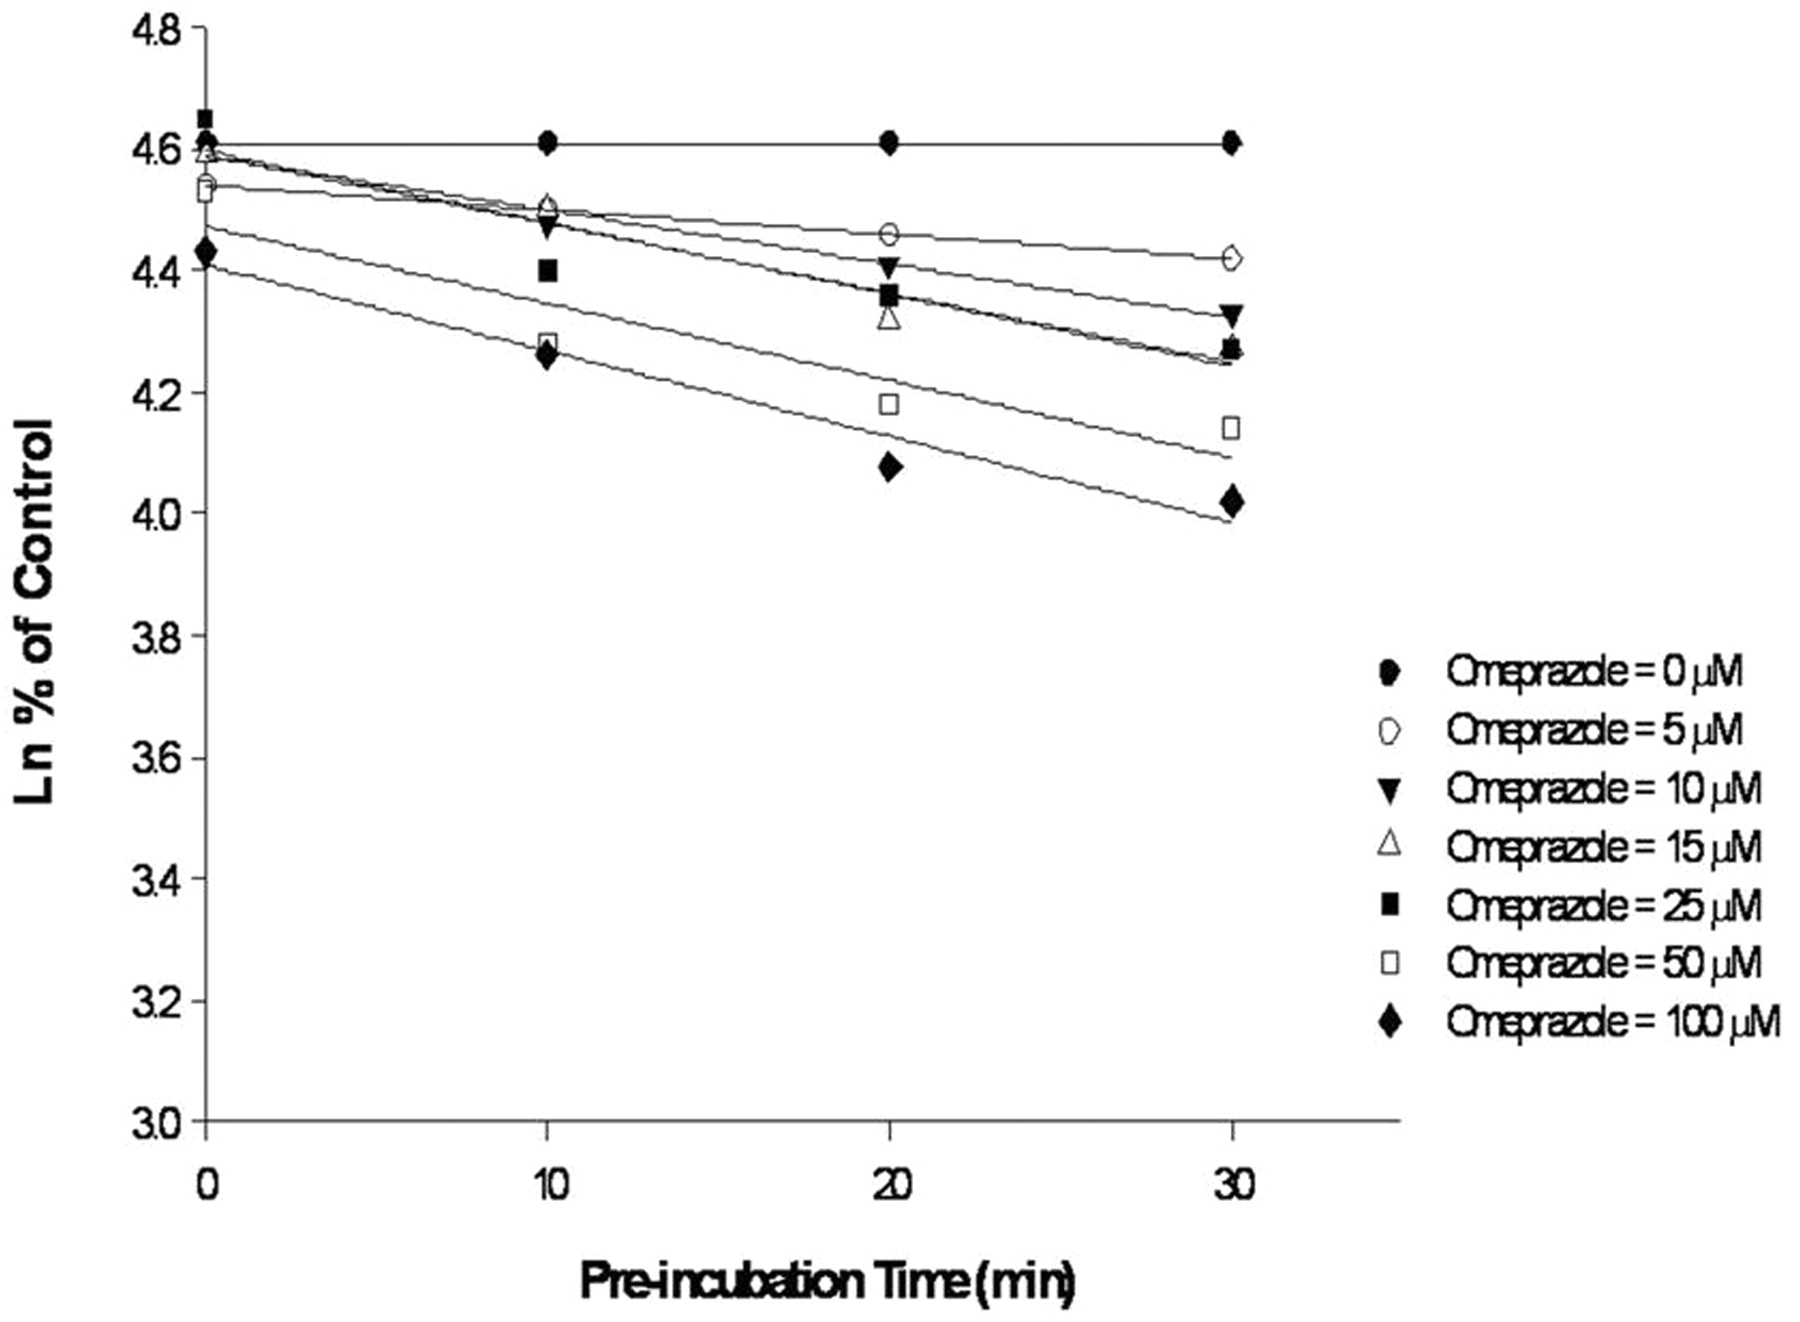
Determination of Kobs in HLM with increasing concentrations of omeprazole.

Determination of Kinact and KI for irreversible inhibition of CYP2C19 by omeprazole in HLM.
Pantoprazole.
No irreversible inhibition of CYP2C19 activity by pantoprazole was observed in HLM reaction mixtures after preincubation. A minor increase in the inhibition of CYP3A4 activity by pantoprazole was observed in HLM reaction mixtures after preincubation with either midazolam or testosterone as probe substrates, but kinetic constants could not be determined because of the limited solubility of pantoprazole (tested up to 500 μM).
All results obtained with positive and negative controls, investigated with MBI and reversible inhibitors, with or without cofactor (NADPH), were as expected.
Static and Dynamic Comparison of Metabolite Exposure Ratios in PM and EM Populations.
A static model was proposed (see Materials and Methods) to calculate the metabolite exposure ratios with the Fm values at each metabolic step. Considering two metabolic steps (Fig. 1), M2 exposure ratios were estimated with the static model and compared with values obtained through a dynamic model as implemented in Simcyp. The predicted ratios were assessed with the two models as described under Materials and Methods and are reported in Table 4 and Fig. 4. Regardless of the Fm values and relative CYP2C19 involvement used in the formation of M1 and M2, very good consistency was found between the two models, with a ratio slightly lower when it was calculated with the dynamic model (see Discussion).
Predicted M2 (i.e., clopidogrel active metabolite H4) exposure ratios in CYP2C19 PMs vs. EMs using static and dynamic models
Compared with the general situation schematized in Fig. 1, CYP2C19 was considered to be involved in the two metabolic steps to mimic the clopidogrel situation. With use of the static model, M2 exposure ratios were determined using the static model with eqs. 7 or 8 and using Simcyp as described under Materials and Methods. In the clopidogrel situation, FM, X, FM, Z, and FM, 2C19 represent CYP450-dependent pathways; FM, a and FM, b represent the undefined clearance (esterase for FM, a). Several studies have shown that Fm, a (esterase) is high compared with CYP450-dependent pathways at the first metabolic step and that Fm, b would be equivalent at the second metabolic step (Kazui et al., 2010; Gurbel et al., 2009). In the six simulations, Fm values were selected to mimic this situation. Data are arithmetic means (S.D.).

Comparison of the M2 exposure ratios in CYP2C19 PMs versus EMs, as predicted using static and dynamic models. Data are presented as means and S.D.
Determination of CYP2C19 Involvement in Clopi-H4 Exposure.
CYP2C19 Fm values in the clopi-H4 formation were determined in the polymorphic genetic populations from study 5 (well balanced populations; 10 subjects/group) and from study 6 (meta-analysis) in which several phase I outputs were combined. In study 6, these investigations were conducted for both loading (300 or 600 mg) and maintenance doses (75 or 150 mg). CYP2C19 Fm values for each population were determined with AUC ratios of clopi-H4, using eq. 14, as reported in Table 5.
Calculated ratios of clopi-H4 AUClast (75- or 150-mg maintenance doses) or AUC, calculated with extrapolation lower than 20% (300- or 600-mg loading doses) between PM versus the other phenotypic groups from studies 5 and 6 and CYP2C19 involvement in the clopi-H4 formation in each CYP2C19 genetic polymorphic population
Analysis of study 5 revealed similar clopi-H4 exposure ratios with clopidogrel dose across the populations (UM, EM, and IM) (Table 5). However, in study 6, an increase in CYP2C19 Fm value was observed in UMs and EMs compared with IMs, whereas only a trend was observed between UMs and EMs. This last study reflects a higher CYP2C19 contribution in UMs and EMs versus IMs, whereas a slight tendency observed between UMs versus EMs. The lack of consistency between studies 5 and 6 may be due to the lower number of subjects in study 5, compared with study 6 (meta-analysis). For both loading and maintenance doses in study 6, Fm values were ranked as follows: UM > EM ≫ IM, reflecting an increase in the CYP2C19 isoform during clopi-H4 formation (Table 5). CYP2C19 contributions were higher at maintenance than at loading doses, suggesting a possible saturation effect at the loading doses.
Because of the large intersubject variability of the clopi-H4 metabolite exposure variability, overlaps of the 95% confidence intervals are observed between the populations as well as between the doses, showing that even if some Fm estimates are consistent with what is expected from a theoretical point of view (e.g., increase in CYP2C19 Fm values from IM to UM, in study 6), the power of these datasets is not sufficient to clearly ascertain these differences.
Prediction of Omeprazole Effect on Clopi-H4 Formation.
The effects on clopi-H4 metabolite AUC ratios were predicted for several omeprazole doses in IM, EM, and UM populations, using MBI parameters for omeprazole (Fig. 3) and Fm values calculated from studies 5 and 6 (Tables 6 and 7). For study 5, because the CYP2C19 Fm values were similar regardless of the clopidogrel dose, a mean value was used to estimate the omeprazole effect (0.60 and 0.64 for IMs and EMs, respectively). For study 6, interaction ratios were calculated from loading and maintenance doses in IM, EM, and UM populations. For 80 mg of omeprazole, the calculated values were similar to those previously obtained in the clinical interaction trials (pooled analysis of studies 1, 2, and 3). In particular, for both predicted and observed values, a slight but consistent ratio decrease was observed in UMs compared with IMs, reflecting a higher CYP2C19 involvement in clopidogrel active metabolite formation for UMs (Table 7).
Predicted clopi-H4 AUC ratios after clopidogrel and omeprazole coadministration at steady state
Clopidogrel H4 metabolite AUC ratios were calculated from study 5 with eqs. 15 and 16 and observed AUC ratios (AUClast and AUC for maintenance and loading dose, respectively). KI was corrected with a fumic function (fumic = 0.796), and prediction was done with Aureus DDI predict (Aureus Sciences) (fumic = 0.796), using a Hallifax model (Hallifax and Houston, 2006), fup = 0.05 was obtained from Voltano et al. (2006), and kdeg = 0.00044 min−1 was obtained from Yang et al. (2008). For observed values, ratios of geometric means (clopidogrel + omeprazole versus clopidogrel alone) and 95% confidence intervals are presented (with P < 0.001 for all ratios), coming from pooled studies 1, 2, and 3 with at least approximately 40 subjects per metabolizer group. LD: 300 and 600 mg; MD: 75 and 150 mg. AUC ratios for UMs are not reported because they are similar to those calculated for EMs. For IM and EMs, because the CYP2C19 Fm values are similar regardless of clopidogrel dose (Table 5), a mean value was considered to estimate the omeprazole effect. The value obtained with 75 mg of clopidogrel was not taken into account (Table 5).
Predicted clopi-H4 AUC ratios after clopidogrel and omeprazole coadministration at steady state
Predicted clopi-H4 AUC ratios were calculated from study 6 from loading and maintenance doses with eqs. 15 and 16 and observed AUC ratios (AUClast and AUC for maintenance and loading doses, respectively). For fumic, fup, and kdeg values and observed values, see explanation to Table 6.
Discussion
This is the first study proposing a static model to determine the comparative net involvement of CYP2C19 in clopidogrel active metabolite (clopi-H4 metabolite) formation in populations with genetically different activity of this enzyme. An approach gathering the two metabolic steps (clopidogrel to 2-oxo-clopidogrel and 2-oxo-clopidogrel to H4 active metabolite) was performed, to determine the net CYP2C19 contribution to the active metabolite formation using pharmacokinetic data from two clinical studies: one pharmacokinetic study with well balanced genetic polymorphic populations (CYP2C19 PMs, IMs, EMs, and UMs) and a meta-analysis of approximately 400 healthy subjects. A static model was developed to determine the contribution of a given enzyme to the secondary metabolite formation. The relative involvement of CYP2C19 in clopi-H4 formation was predicted to be between 56 and 64% in the different phenotypic populations (IM, EM, and UM). The relative contribution of CYP2C19 increased from IMs to UMs, in particular in study 6, as expected on the basis of the theoretical quantities of CYP2C19 in these populations. The CYP2C19 contribution tends to be higher at maintenance doses than at loading doses, suggesting a possible saturation effect of CYP2C19 at high clopidogrel doses. Nevertheless, these differences (between the populations as well as the doses) are not statistically significant, with overlaps of the 95% confidence intervals of the AUC ratios, reflecting the high intersubject variability of clopi-H4 metabolite exposure.
In addition, a dynamic model in Simcyp was set up to compare with the static model. A specific secondary metabolite module to cope with the clopidogrel active metabolite situation was implemented in Simcyp. Virtual Fm values were selected to test the consistency between the two models in two virtual populations of 10 PM and EM subjects. Predicted exposure metabolite ratios with the two approaches were similar, with slightly higher (approximately 5%) values, when calculated with the static model. One of the limitations of the static approach is that it does not account for P450 isoforms at the gut level, yielding a slight underestimation of CYP2C19 involvement in the formation of M2. This is reflected by the slightly higher M2 exposure PM/EM ratio observed with the static model (Fig. 4).
The mechanism of P450 inhibition by omeprazole was also investigated. An MBI toward CYP2C19 was clearly identified and the corresponding in vitro parameters (KI and Kinact) were calculated (8.56 μM and 0.0156 min−1, respectively). These values are in line with those reported previously (Paris et al., 2008): 9.10 μM and 0.0457 min−1, respectively. This mechanism of inhibition is supported by clinical studies showing similar effects after coadministration of omeprazole and clopidogrel simultaneously or 12 h apart (Angiolillo et al., 2011). In addition, an increase in the omeprazole plasma concentration after repeated once-daily administration was observed in our clinical conditions (Table 2) and has also been described previously, despite a very short terminal half-life (1 h) of the compound in EMs (Shi and Klotz, 2008), which would suggest minimal accumulation. It has been hypothesized that omeprazole increases its own bioavailability after repeated dosing either by decreased first-pass elimination and/or by reduced degradation in the stomach due to the profound decrease in intragastric acidity caused by omeprazole (Andersson et al., 1990). The results presented suggest that the increase in the omeprazole plasma concentration is likely to stem, at least partially, from MBI, with which its metabolic clearance is reduced after repeated administration. An interesting comparison of omeprazole clearance after single versus repeated dosing in PMs (in which metabolic-based hypotheses are not relevant) and EMs suggests that these two mechanisms (increased absorption and reduced clearance) coexist clinically in non-PM subjects (Shirai et al., 2001). Although it was not the primary objective of this study, the authors observed a nonstatistically significant increase (∼20%) in the omeprazole AUC after repeated dosing in PMs compared with that after a single dose and a statistically significant increase (∼50%) in EMs. These data, presented by Shirai et al. (2001), suggest that the metabolic-based mechanism is the primary cause of the reduced oral clearance after repeated administration of omeprazole in EM subjects even if an absorption increase cannot be ruled out, on the basis of the results obtained in PM subjects. Omeprazole MBI also supports the inhibition of moclobemide clearance by omeprazole, because this effect was more pronounced after 1 week of repeated administration of omeprazole compared with a single dose (Yu et al., 2001). Thus, these clinical data clearly support our findings regarding the mechanism of inhibition of omeprazole.
A static model in combination with net CYPC219 contribution as determined from clinical outcomes was used to predict omeprazole inhibition of active metabolite formation in CYP2C19 IMs, EMs, and UMs. The results are consistent with those previously observed in clinical studies after repeated administration of 80 mg of omeprazole.
The consistency between predicted and observed data is in agreement with the observed lack of a class effect and in particular the lack of a pH effect, because these predictions are only metabolic-based. Pantoprazole is a weak reversible inhibitor of CYP2C19 and showed only a slight effect on the active metabolite plasma concentration and pharmacological response (Cuisset et al., 2009; Angiolillo et al., 2011). In our conditions, no clear increases in omeprazole and pantoprazole plasma concentration were observed after coadministration of clopidogrel, in contrast to the hypothesis proposed by Zhang et al., 2009. However, a weak inhibition of omeprazole clearance after coadministration with clopidogrel in CYP2C19 EM subjects has been described by Chen et al., 2009. This apparent inconsistency may be due to the different study populations included in our interaction studies (IM, EM, and UM). Even if no omeprazole or pantoprazole plasma concentration increases were observed after coadministration of clopidogrel, supported by the lack of statistical significance in our analysis, it must be emphasized that the studies were not primarily designed to investigate a clinical interaction between clopidogrel and PPIs. Therefore, further investigations are required.
It is also unlikely that the weak omeprazole plasma level increases observed previously (28%) (Chen et al., 2009) were sufficient to support the hypothesis proposed by Zhang et al. (2009). As also hypothesized by these authors, the effect of omeprazole toward the AUC of the active clopidogrel metabolite is likely to involve an MBI mechanism, as shown in the current study. It is also noteworthy that these two hypotheses are not mutually exclusive and could coexist to some extent.
This is the first attempt to simulate omeprazole inhibition in clopidogrel active metabolite formation. A general static model for metabolite AUC ratio calculation was developed to account for total inhibition and genetic polymorphism. To our knowledge, this is the first report of such a static model, enabling us to estimate the contribution of a given polymorphic enzyme or its inhibition in the formation of a secondary metabolite, although metabolite kinetics had been described previously (Pang, 1995). However, because only net CYP2C19 involvement in the formation of the active metabolite has been estimated from clinical data (and not CYP2C19 contribution in each metabolic step), the general static model has been simplified, assuming only one virtual metabolic step (net effect). The relative involvement of each P450 isoform in clopidogrel metabolism will therefore need to be considered in the future. Moreover, this approach cannot mix several sources of variability (e.g., effect of omeprazole in elderly population), provide a concentration-time profile, and reflect the effect of an inhibitor on the active clopidogrel metabolite pharmacokinetic parameters other than clearance, as Cmax, for example. A static model cannot reflect the impact of CYP2C19 in special population (e.g., hepatic-impaired subjects) and is limited to coadministration of victim (clopidogrel) and perpetrator (omeprazole). Any study designs with no coadministration of clopidogrel with omeprazole, such as dose staggering, that can mitigate the effect of the inhibitors (reversible inhibitor in particular) cannot be simulated. Owing to these limitations of the static model, a full PBPK model will need to be developed to allow for interindividual variability and a full pharmacokinetic profile and to provide improved estimates of any DDIs, different populations, and clinical conditions for the pharmacokinetics of the clopidogrel active metabolite.
Authorship Contributions
Participated in research design: Boulenc, Djebli, and Hurbin.
Conducted experiments: Shi, Brian, and Van Horm.
Performed data analysis: Boulenc and Perrin.
Wrote or contributed to the writing of the manuscript: Boulenc and Hurbin.
Acknowledgments
We thank Xavier Benain, Franck Poitiers, and Laure Siraudin for their contributions to the interaction studies as statisticians and Olivier Nicolas, Céline Ollier, and Christine Farenc for their contributions to the interaction studies as pharmacokineticists.
Footnotes
This work was supported by sanofi-aventis and Bristol-Myers Squibb. The authors are all employees of sanofi-aventis. Editorial support was funded by sanofi-aventis and provided by Alpha-Plus Medical Communications Ltd.
Article, publication date, and citation information can be found at http://dmd.aspetjournals.org.
↵
The online version of this article (available at http://dmd.aspetjournals.org) contains supplemental material.-
ABBREVIATIONS:
- P450
- cytochrome P450
- clopi-H4 metabolite
- active metabolite of clopidogrel (H4)
- PPI
- proton pump inhibitor
- DDI
- drug-drug interaction
- MBI
- mechanism-based inhibition
- IM
- intermediate metabolizer
- EM
- extensive metabolizer
- UM
- ultrarapid metabolizer
- PBPK
- physiologically based pharmacokinetic
- HLM
- human liver microsomes
- LC
- liquid chromatography
- MS/MS
- tandem mass spectrometry
- AUC
- area under the plasma concentration versus time curve
- PM
- poor metabolizer
- LLOQ
- lower limits of quantification
- CI
- confidence interval.

- Received May 6, 2011.
- Accepted October 17, 2011.
- Copyright © 2012 by The American Society for Pharmacology and Experimental Therapeutics


