


Abstract
Magnolol is a food additive that is often found in mints and gums. Human exposure to this compound can reach a high dose; thus, characterization of magnolol disposition in humans is very important. Previous studies indicated that magnolol can undergo extensive glucuronidation in humans in vivo. In this study, in vitro assays were used to characterize the glucuronidation pathway in human liver and intestine. Assays with recombinant human UDP-glucuronosyltransferase enzymes (UGTs) revealed that multiple UGT isoforms were involved in magnolol glucuronidation, including UGT1A1, -1A3, -1A7, -1A8, -1A9, -1A10, and -2B7. Magnolol glucuronidation by human liver microsomes (HLM), human intestine microsomes (HIM), and most recombinant UGTs exhibited strong substrate inhibition kinetics. The degree of substrate inhibition was relatively low in the case of UGT1A10, whereas the reaction catalyzed by UGT1A9 followed biphasic kinetics. Chemical inhibition studies and the relative activity factor (RAF) approach were used to identify the individual UGTs that played important roles in magnolol glucuronidation in HLM and HIM. The results indicate that UGT2B7 is mainly responsible for the reaction in HLM, whereas UGT2B7 and UGT1A10 are significant contributors in HIM. In summary, the current study clarifies the glucuronidation pathway of magnolol and demonstrates that the RAF approach can be used as an efficient method for deciphering the roles of individual UGTs in a given glucuronidation pathway in the native tissue that is catalyzed by multiple isoforms with variable and atypical kinetics.
Introduction
Magnolia officinalis is an herb medicine that has been used to treat many diseases such as nervous disturbance, abdominal disorders, gastrointestinal food stagnancy, abdominal distention, constipation, coughing, and dyspnea in Asian countries for thousands of years (Lee et al., 2011). Magnolol, the most abundant constitute in M. officinalis, is a natural biphenyl compound with a centro-symmetric structure containing two free phenol groups (Fig. 1). Much research has indicated that magnolol possesses various desired pharmacological activities, especially as a potent agonist for peroxisome proliferator-activated receptor-γ, a treatment target for type 2 diabetes and metabolic syndrome (Fakhrudin et al., 2010).

Glucuronidation pathway of magnolol.
Human are often exposed to magnolol in daily life because Magnolia bark supercritical carbon dioxide extract (containing >92.5% magnolol) is added to mints and gums to freshen breath (Greenberg et al., 2007). It is estimated that teenage exposure to magnolol can reach 1.64 mg/kg per day (data from http://www.food.gov.uk/multimedia/pdfs/applicmagbarkextract.pdf). Previous studies indicated that magnolol can undergo extensive glucuronidation in human and rats (Hattori et al., 1986; Homma et al., 1993; Tsai et al., 1995). Considering the high dose intake of magnolol, characterizing its glucuronidation pathway is very important for understanding its beneficial and potential harmful effects on humans. However, this pathway in humans is not yet well elucidated. The aim of this work was to identify the individual UDP-glucuronosyltransferases (UGTs) that can catalyze magnolol glucuronidation and their respective contributions in human liver and intestine.
The UGTs are membrane enzymes of the endoplasmic reticulum that catalyze the conjugation of their substrates with glucuronic acid from UDP-glucuronic acid (UDPGA), making the substrates more soluble and readily excreted (Wells et al., 2004). The human UGT isoforms are divided into three subfamilies (1A, 2A, and 2B) based on amino acids sequence identities and gene structure (Mackenzie et al., 2005). They are expressed in various tissues with a tissue-specific manner. Liver and intestine are recognized as the two most important glucuronidation sites for orally administrated drugs. Many UGTs are expressed in both liver and intestine, but some of them exhibit tissue-specific expression. For example, UGT1A10 is expressed in small intestine but not in liver (Ohno and Nakajin, 2009).
UGTs exhibit distinct overlapping substrate specificities, indicating that the glucuronidation pathway of interest in native tissue (e.g., liver and intestine) is often catalyzed by several different UGTs. Even more, UGTs usually exhibit different affinity toward the “shared” substrate or even different kinetic models. This, in combination with a lack of selective UGT inhibitors, makes it difficult to perform glucuronidation phenotyping. At present, glucuronidation phenotyping depends heavily on assays with recombinant UGT isoforms. However, there are significant activity differences between native tissue microsomes and recombinant enzymes. Results from recombinant enzyme assays will not accurately reflect the true contributions of individual UGTs in native tissues. One possible way to estimate the contributions of individual UGTs to a given reaction in tissue microsomes is to use the relative activity factor (RAF) approach.
The RAF approach was first developed to reflect the differences between recombinant cytochromes P450 and human liver microsomes, and it has been proved to be a powerful tool in cytochrome P450 reaction phenotyping (Crespi and Miller, 1999). For UGT reaction phenotyping, the RAF approach was seldom used, possibly because of the lack of specific substrates. Because glucuronidation metabolism is drawing increasing attention, more and more specific substrates for UGTs are being reported. Although a full set of specific substrates is not available yet (Miners et al., 2010), the RAF approach was used occasionally in UGT phenotyping. To our knowledge, the RAF approach was once used to clarify the glucuronidation pathway of buprenorphine, norbuprenorphine, and (R)-(−)-2-(4-bromo-2-fluorobenzyl)-1,2,3,4-tetrahydropyrrolo[1,2-α]pyrazine-4-spiro-3′-pyrrolidine-1,2′,3,5′-tetrone (AS-3201) in UGT phenotyping (Toide et al., 2004; Rouguieg et al., 2010). However, no validation was conducted in these studies. In the current study, the RAF approach was used to find the isoforms having a significant contribution to hepatic and intestinal glucuronidation of magnolol, and contributions of isoforms were also tested and verified by selective or partial-selective chemical inhibitors. It is hoped that the results presented here will encourage the use of the RAF approach in UGT phenotyping.
Materials and Methods
Notes.
This study was performed, in unequal parts, in two different laboratories. Most of the planning and the experimental work was done at the Dalian Institute of Chemical Physics of the Chinese Academy of Sciences in Dalian, China (DICP laboratory), and additional experiments, mainly for testing and validating the significant role of UGT1A10 in magnolol glucuronidation in the intestine, were performed at the Centre for Drug Research, University of Helsinki, Finland (Helsinki laboratory). Because of difficulties in transportation, the two laboratories used a different set of recombinant human UGTs and different batches of liver and intestine microsomes. In addition, the HPLC instruments and analytical methods in two laboratories were also different. In the following, we have indicated in which materials and methods were used in each laboratory.
Materials: DICP Laboratory.
Magnolol (purity >98%) was purchased from the Victory Company (Chengdu, China). UDPGA (trisodium salt), alamethicin, diclofenac sodium, niflumic acid, phenylbutazone, d-saccharic acid 1,4-lactone-β-d-glucuronidase, dopamine, propofol, and 3′-azido-3′-deoxy-thymidine (AZT) were purchased from Sigma-Aldrich (St. Louis, MO). Ethinylestradiol and 4-methylumbelliferyl-β-d-glucuronide (≥98%) were purchased from Alfa Aesar (Beijing, China). Propofol glucuronide and AZT glucuronide were obtained from Toronto Research Chemicals Inc. (North York, ON, Canada). Pooled human liver microsomes (HLM) from 25 donors (lot LSL) and pooled human intestine microsomes (HIM) from 10 donors (lot UGU) were purchased from the Research Institute for Liver Diseases (Shanghai, China). Pooled Sprague-Dawley rat liver microsomes (n = 10) were produced as described previously (Li et al., 2008). A panel of recombinant human UGT isoforms (UGT1A1, -1A3, -1A4, -1A6, -1A7, -1A8, -1A9, -1A10, -2B4, -2B7, -2B15, and -2B17) expressed in baculovirus-infected insect cells were purchased from BD Gentest (Woburn, MA). Catalytic activities of the 12 UGTs were measured again in the laboratory before the experiment, and the activities were equal to those provided by the supplier. All other reagents were of HPLC grade or of the highest grade commercially available.
Materials: Helsinki Laboratory.
AZT, alamethicin, dopamine, and UDPGA (triammonium salt) were purchased from Sigma-Aldrich. Magnolol was obtained from the DICP laboratory. HIM, a pool of 6 donors (lot 15031), were from BD Biosciences (San Jose, CA). Recombinant UGT1A10 and UGT2B7 were produced in our laboratory, as described previously (Kuuranne et al., 2003; Kurkela et al., 2007). To avoid confusion due to the different sources of recombinant UGTs, those from the Helsinki laboratory will be indicated in this article by an asterisk (*), namely UGT1A10* or -1A10* and UGT2B7* or -2B7*. This marking (*) is also used to indicate the tissue microsomes that were used in Helsinki (HIM*). All the solvents used in the Helsinki laboratory were of HPLC grade.
Methods and Assays: DCIP Laboratory.
Magnolol glucuronidation assays.
Magnolol was incubated with HLM, HIM, or recombinant UGT isoforms in a reaction mixture containing 50 mM Tris-HCl buffer (pH 7.4), 5 mM MgCl2, and 10 mM d-saccharic acid 1,4-lactone in a final volume of 200 μl. When HLM or HIM were assayed, the microsomes were fully activated by the addition of alamethicin (5% protein concentrations). Before the glucuronidation reactions were started, all the samples were incubated at 37°C for 5 min, and then the reaction was initiated by the addition of UDPGA to a final concentration of 4 mM. The incubations were performed for different times, as specified below, and they were terminated by the addition of 100 μl of methanol and then transferred to an ice bath and kept there for 20 min. The samples were then centrifuged at 20,000g for 10 min to remove protein. Control incubations were performed either without microsomes, without UDPGA, or without magnolol. The assays were analyzed by both ultra-fast liquid chromatography (UFLC)-diode array detector (DAD) and UFLC-MS.
To ensure the formation of glucuronide, the hydrolysis of product in the incubation mixture with β-glucuronidase was also performed. After incubation for glucuronidation for 0.5 h in 200 μl of reaction mixture (without d-saccharic acid 1,4-lactone), 200 μl of 0.15 M acetate buffer (pH 5.0) with or without β-glucuronidase (1800 Fishman units) was added to the reaction mixture, and then the incubation was performed at 37°C for another 0.5 h. The reaction was quenched by the addition of 200 μl of methanol and centrifuged at 20,000g for 10 min; the supernatant was analyzed by UFLC-DAD.
Analysis of magnolol glucuronidation samples.
Magnolol and its glucuronide were analyzed by a UFLC spectrometry system (Shimadzu, Kyoto, Japan), equipped with two LC-20AD pumps, a DGU-20A3 vacuum degasser, a SIL-20ACHT autosampler, a CTO-20AC column oven, an SPD-M 20A DAD, a CBM-20A communications bus module, a mass detector (2010EV) with an electrospray ionization (ESI) interface, and a computer equipped with UFLC-MS solution software (version 3.41; Shimadzu). A Shim-pack XR-ODS (75.0 × 2.0 mm i.d., 2.2 μm; Shimadzu) analytical column with an ODS guard column (5 × 2.0 mm i.d., 2.2 μm; Shimadzu) was used to separate magnolol and its glucuronide. Column temperature was kept at 40°C. The mobile phase was acetonitrile (A) and 0.2% formic acid (B) at a flow rate of 0.3 ml/min, with the following gradient: 0 to 9 min, 90% B to 30% B; 9 to 12.5 min, 5% B; and 12.5 to 16 min, balance to 90% B. The glucuronidation sample was stable over 72 h at 4°C. Magnolol glucuronidation was quantified by the standard curve of the glucuronide at the detector wavelength of 290 nm, which was linear from 0.1 to 20 μM (correlation coefficient was >0.999). The quantitative method displayed good sensitivity, with the limit of detection of magnolol glucuronide less than 0.5 ng. The method also displayed good reproducibility, with the intraday and interday variances both less than 3%.
Mass detection was performed on a Shimadzu LCMS-2010EV instrument with an ESI interface both in positive and negative ion mode (ESI−) from m/z 100 to 800. The detector voltage was set at +1.55 kV and −1.55 kV for positive and negative ion detection, respectively. The curved desolvation line temperature and the block heater temperature were both set at 250°C, whereas the curved desolvation line voltage was set at 40 V. Other MS detection conditions were as follows: interface voltage, +4.5 kV and −4.0 kV for positive and negative ion detection, respectively; nebulizing gas (N2) flow, 1.5 l/min; and drying gas (N2) pressure, 0.06 MPa. Data processing was performed using the LC-MS solution software (version 3.41; Shimadzu).
Probe glucuronidation assays and analysis.
Ethinylestradiol (100 μM) was incubated with UGT1A1, HIM, or HLM for 30 min, with the final protein concentrations of 0.25 mg/ml. Ethinylestradiol glucuronidation samples were analyzed on the UFLC system (see above). A Shim-pack XR-ODS (50.0 mm × 2.0 mm i.d., 2.2 μm; Shimadzu) analytical column with an ODS guard column (5 mm × 2.0 mm i.d., 2.2 μm; Shimadzu) was used and kept at 40°C. The mobile phase consisted of acetonitrile (A) and 0.2% formic acid (B) at a flow rate of 0.3 ml/min, with the following gradient: 0 to 9 min, 90% B to 30% B; 9 to 12.5 min, 5% B; and 12.5 to 16 min, balance to 90% B. The ethinylestradiol glucuronide was detected by UV absorbance at 250 nm.
Propofol (200 μM) was incubated with UGT1A9 or HLM for 20 min, with the final protein concentration of 0.5 mg/ml. Propofol glucuronide was analyzed by LC-MS as described previously (Liang et al., 2011).
AZT (5 mM) was incubated with either UGT2B7 (commercial isoform), HLM, or HIM for 20 min, with the final protein concentrations of 0.5 mg/ml. AZT glucuronidation samples were analyzed on an HPLC system (Shimadzu), equipped with a SCL-10A system controller, two LC-10AT pumps, a SIL-10A autosampler, and a SPD-10AVP UV detector. A C-18 column (4.6 × 250 mm, 5 mm, Kromasil) was used to separate AZT and its glucuronide. The mobile phase was acetonitrile (A) and 0.2% formic acid (B) at a flow rate of 1.0 ml/min, with an isocratic gradient: 0 to 25 min 90% B. The AZT glucuronide was detected by UV absorbance at 260 nm.
Dopamine (10 mM) was incubated with either UGT1A10 (commercial isoform) or HIM for 40 min, with the final protein concentrations of 0.5 mg/ml. Glucuronidation samples were analyzed on a Shimadzu LCMS-2010EV instrument with an ESI interface (see above). A self-made polar-copolymerized stationary phase named C18HCE (150 × 4.6 mm, 5 mm) was used. Millipore water containing 0.2% formic acid was used as the mobile phase. The ESI probe voltage was set at −1.5 kV for detection. Mass spectrometry data were collected at m/z 281 in the select ion monitoring mode with negative ESI to detect the dopamine glucuronide.
Biosynthesis of metabolites and NMR analysis.
The metabolites were biosynthesized using mixed liver microsomes from rat and human (90% rat liver microsomes and 10% HLM) and purified for structure elucidation and quantitative analysis. In brief, 200 μM magnolol was incubated with mixed liver microsomes (0.5 mg of protein/ml), 50 mM Tris-HCl (pH 7.4), 5 mM MgCl2, Brij 58 (0.1 mg/mg protein), and 2 mM UDPGA in 200 ml of reaction mixtures for 4 h at 37°C. The reaction was terminated by adding 100 ml of methanol, and the vessel was then put in an ice bath for 20 min. Proteins were removed by centrifugation at 20,000g for 30 min at 4°C, and the combined supernatants were loaded on a SPE cartridge (C18 and anion exchange resin, 1000 mg; Dalian Sipore, Dalian, China). The SPE cartridge was preconditioned by sequential washing with 6 ml of methanol and 6 ml of Millipore water. After sample loading, the SPE cartridge was sequentially eluted with 6 ml of Millipore water, 12 ml of methanol, and 12 ml of methanol containing 5% formic acid. The entire process was monitored by UFLC, and the metabolites were assembled in methanol containing 5% formic acid. After vacuum evaporation, 3.2 mg of metabolites were obtained, and the purity was greater than 95% by UFLC-DAD analysis.
The structure of the metabolite was determined by NMR spectra including 1H NMR and 13C NMR. All experiments were performed on an INOVA-400 NMR spectrometer (Varian, Inc., Palo Alto, CA). The purified metabolites were stored at −20°C before dissolving in dimethyl sulfoxide-d6 (Euriso-Top, Saint-Aubin, France) for NMR analysis. Chemical shifts were given on the δ scale and referenced to tetramethylsilane at 0 ppm for 1H NMR (400 MHz) and 13C NMR (100 MHz).
UGT isoform screening.
The commercial recombinant UGT isoforms 1A1, 1A3, 1A4, 1A6, 1A7, 1A8, 1A9, 1A10, 2B4, 2B7, 2B15, and 2B17 were assayed for magnolol glucuronidation activity, in the presence of 12, 128, or 256 μM substrate. The protein concentrations were 0.1 mg of protein/ml, and the incubations were performed at 37°C for 60 min.
Kinetic analysis.
To obtain the kinetic parameters in HLM and HIM, magnolol (0–100 μM) was incubated with pooled HLM (0.01 mg/ml) and HIM (0.04 mg/ml) at 37°C for 20 min. Preliminary experiments were performed to be sure that the formation of the glucuronides was in the linear range of both time (0–60 min) and protein concentrations (0.01–0.1 mg/ml). Kinetic analysis was also performed for UGT1A1, -1A3, -1A7, -1A9, and -2B7, which exhibited significant magnolol glucuronidation activity. Magnolol (0–250 μM) was incubated with commercial UGT1A1 (0.1 mg of protein/ml), UGT1A3 (0.1 mg of protein/ml), UGT1A7 (0.025 mg of protein/ml), UGT1A9 (0.04 mg of protein/ml), and UGT2B7 (0.0125 mg of protein/ml) for 20 min, respectively. The kinetic models that were used to analyze the results were either substrate inhibition (eq. 1) or biphasic kinetics (eq. 2):
 where v is the rate of the reaction, [S] is the substrate concentration, Vmax is the maximum velocity estimate, Ks is the substrate affinity constant, and Ksi is the substrate inhibition constant.
 where Vmax1 and Vmax2 represent the estimated maximum velocity for the two metabolic phases and Ks1 and Ks2 represent the affinity constants for the two metabolic phases.
All incubations were performed in three independent experiments in duplicate. Kinetic constants were obtained using Origin 7.5 (OriginLab Corp., Northampton, MA) and are reported as value ± S.E. of the parameter estimate.
Chemical inhibition studies.
To better understand the roles of UGT enzymes in hepatic and intestinal magnolol glucuronidation, chemical inhibition studies with diclofenac, phenylbutazone, and niflumic acid were performed.
Chemical inhibition for recombinant UGT enzymes.
In the DICP laboratory, magnolol (6 μM) was incubated with individual isoforms of UGT1A1, -1A3, -1A7, -1A9, and -2B7 in the presence or absence of the inhibitors: diclofenac (10 and 100 μM), phenylbutazone (100 and 500 μM), and niflumic acid (10 and 100 μM). Commercial UGT1A8 and UGT1A10 were not included here because of very low magnolol glucuronidation activity.
Chemical inhibition for HLM.
To test the inhibitory effects of the inhibitors on magnolol glucuronidation in HLM, incubations of magnolol (6 μM) with HLM in the presence or absence of diclofenac (10 and 100 μM), phenylbutazone (100 and 500 μM), and niflumic acid (10 and 100 μM) were performed, respectively.
Given the possible dependence of contributions of UGTs on substrate concentration, inhibition of diclofenac (0–200 μM) of magnolol glucuronidation by HLM and UGT2B7 was investigated at three different magnolol concentrations (6, 12, and 24 μM) to get a clearer insight into the roles of UGT2B7 in liver. The IC50 (inhibitor concentration that inhibits 50% of control activity) values for inhibition of diclofenac on magnolol glucuronidation by HLM and UGT2B7 were determined by nonlinear curve fitting with Origin 7.5 as described previously and then were compared with each other (Zhang et al., 2009).
Chemical inhibition for HIM.
To test the inhibitory effects of these inhibitors (above) on magnolol glucuronidation in HIM, incubations of magnolol (6 μM) with HIM in the presence or absence of diclofenac (10 and 100 μM), phenylbutazone (100 and 500 μM), and niflumic acid (10 and 100 μM) were performed, respectively.
RAF approach application.
To achieve an accurate understanding of the roles of UGT enzymes in hepatic and intestinal glucuronidation, magnolol glucuronidation activity was scaled from recombinant systems to HLM and HIM through the RAF approach. The RAF value was calculated by dividing the velocity of the probe reaction in HLM or HIM by that in the recombinant enzyme (eq. 3) (Crespi and Miller, 1999):

The magnolol glucuronidation rate of the individual isoforms in HLM or HIM (Vi) is estimated by multiplying the reaction rate in the recombinant enzyme (vi) by the corresponding RAF value (RAFi) (eq. 4):

The relative contribution of the individual isoform (Contributioni) is calculated by dividing Vi by the magnolol glucuronidation rate in HLM or HIM (Vtotal) (eq. 5):

Calculations of RAF values.
Glucuronidation rates of ethinylestradiol, propofol, and AZT were reported to be probe reactions for catalytic activity of human UGT1A1, UGT1A9, and UGT2B7, respectively, in human liver (Court et al., 2003; Soars et al., 2003). In addition, ethinylestradiol, dopamine, and AZT can be used as probe substrates for UGT1A1, UGT1A10, and UGT2B7, respectively, in human small intestine (Court et al., 2003; Soars et al., 2003; Itäaho et al., 2009). The glucuronidation rates of propofol and AZT were quantified by using a standard curve made with authentic compounds. Because no ethinylestradiol and dopamine glucuronide was commercially available for the DCIP laboratory, areas under the glucuronide peak were used to calculate the RAF values in these cases.
Contributions of individual isoforms.
Given possible dependence of contributions of UGT enzymes on concentrations of the parent compound, magnolol glucuronidation rates at different substrate concentrations (6, 12, and 24 μM) by HLM, HIM, or recombinant UGT isoforms were measured simultaneously with probe reactions. After multiplying magnolol glucuronidation rates in recombinant UGT (vi) by the corresponding RAF values (eq. 4), rates of the individual UGT isoforms in HLM or HIM (Vi), respectively, were obtained. After Vi was divided by magnolol glucuronidation rates in HLM or HIM (Vtotal) (eq. 5), relative contributions of individual isoforms (Contributioni) to hepatic or intestinal glucuronidation, respectively, were obtained.
Methods and Assays: Helsinki Laboratory.
Magnolol glucuronidation assays.
In the magnolol glucuronidation assays in the Helsinki laboratory, the protein concentrations were either 0.02 mg/ml UGT1A10* or HIM* or 0.05 mg/ml UGT2B7*. The 100-μl reaction mixtures contained 50 mM sodium phosphate buffer (pH 7.4), 10 mM MgCl2, alamethicin (5% of the protein concentration) when HIM* was assayed, and 5 mM UDPGA. All the reaction mixtures for the HIM* reactions (before UDPGA addition but in the presence of alamethicin) were preincubated for 30 min on ice. Before reaction initiation by the addition of UDPGA, all the reaction mixtures were incubated at 37°C for 5 min, followed by UDPGA addition and subsequent incubation at 37°C for 30 min. The assays were terminated by the addition of 60 μl of methanol-4 M perchloric acid (5:1) mix and cooling on ice for 10 min, followed by centrifugation at 13,000 rpm for 10 min in a bench top centrifuge. The resulting supernatants were analyzed to detect the glucuronides.
Magnolol glucuronidation samples were analyzed by both UV absorbance (290 nm) and fluorescence (excitation was at 225 nm and emission at 353 nm) using a Shimadzu LC-10 model HPLC system equipped with a Chromolith SpeedROD RP-18e (50 × 4.6 mm) column at 40°C. The mobile phase was acetonitrile (A) and 0.1% formic acid (B) at a flow rate of 1 ml/min, with the following gradient: 1 to 8 min, 70% B to 5% B; 8 to 8.5 min, 5% B; 8.5 to 8.6 min, 5% B to 70% B; and 8.6 to 10 min, 70% B. Because of the lack of authentic magnolol glucuronide standard in the Helsinki laboratory, the standard curve for quantification of the magnolol glucuronide in the different samples was based on magnolol UV absorbance at 290 nm. The DCIP laboratory found that the excitation of the glucuronide at 290 nm is 1.2 times higher than the corresponding value for magnolol, and the rates were adjusted accordingly.
Magnolol glucuronidation kinetics was performed for UGT1A10* in the 2 to 200 μM substrate concentration range. To get the kinetic constants, substrate inhibition (eq. 1) and the Michaelis-Menten model (eq. 6) were used:
 where v is the rate of the reaction, [S] is the substrate concentration, Vmax is the maximum velocity estimate, and Km is the apparent affinity constant.
The chemical inhibition experiments in the Helsinki laboratory were performed for UGT1A10*. The concentrations of chemical inhibitors and magnolol were the same as those in the DICP laboratory, whereas other incubation conditions were the same as those described above for the magnolol glucuronidation assays in the Helsinki laboratory (above).
Probe glucuronidation assays.
The AZT glucuronidation rates of UGT2B7* and HIM* and the dopamine glucuronidation rates of UGT1A10* and HIM* were measured. The incubation mixture contained 0.5 mg of protein/ml enzyme. The AZT concentration in the respective analyses was 5 mM, and the dopamine concentration in the respective experiments was 10 mM. AZT glucuronidation samples were analyzed by ultraperformance liquid chromatography-MS. The system consisted of a Waters Acquity ultraperformance liquid chromatograph equipped with an Acquity BEH C18 column (1.7 μm, 2.1 × 100 mm) and an Acquity PDA detector and a Waters Xevo Q-Tof mass spectrometer. Mass spectrometry was performed in negative ion mode from m/z 100 to 1000, as described previously (Zhang et al., 2011). Dopamine glucuronidation was analyzed using a Waters Acquity ultraperformance liquid chromatograph and an Agilent 6410 triple-quadrupole mass spectrometer, as described previously (Uutela et al., 2009).
Results
Identification of Magnolol Glucuronidation.
Incubation of magnolol with either HLM or HIM in the presence of UDPGA yielded a single glucuronide peak. This glucuronide was absent in control samples without microsomes, UDPGA, or magnolol. Mass spectrometry in the negative ion mode showed an m/z value of 441.1 for the deprotonated metabolite, a value that corresponds well to magnolol (266 − 1) with m/z 176 of the glucuronosyl substitution (Fig. 2). Treatment with β-glucuronidase further indicated that the metabolite was a β-glucuronide (data not shown).

Representative LC profiles of magnolol and its glucuronide. The glucuronide and magnolol were eluted at 5.6 and 7.7 min, respectively. The m/z of the glucuronide in negative ion mode is displayed as the inset. mAU, milliabsorbance units.
The magnolol glucuronide was biosynthesized and purified for structure elucidation, as well as for use as a standard in different analyses. The glucuronide structure determination was performed by NMR, using both 1H NMR and 13C NMR analyses (Table 1). In comparison with magnolol, the 13C NMR spectrum of the glucuronide revealed an upfield shift at C-2 to δ 152.7 (Δδ −0.4), which is probably due to a glycosidation shift of a phenolic compound. In the sugar moiety, the G1 protons and carbons exhibited characteristic chemical shifts near 5 and 100 ppm, whereas the G6 carbon (−COOH) showed chemical shifts of approximately 170 ppm. Taken together, the evidence clearly demonstrated that the location of the glucuronic acid substitution was at the C-2 phenolic group of magnolol (Fig. 1).
Proton and carbon NMR chemical shift assignments for magnolol and its metabolite
UGT Isoform(s) Screening.
A panel of 12 commercial recombinant human UGT isoforms was screened for their magnolol glucuronidation activity. The results demonstrated that UGT1A1, -1A3, -1A7, -1A8, -1A9, -1A10, and -2B7 could catalyze this reaction, whereas UGT1A4, -1A6, -2B4, -2B15, and -2B17 did not exhibit any activity toward this compound. Of these, UGT2B7 showed the highest magnolol glucuronidation activity, whereas UGT1A8 and UGT1A10 exhibited very low magnolol glucuronidation activity (Fig. 3). The screening assays were performed using three different substrate concentrations (12, 128 and 256 μM) to detect all UGTs with magnolol glucuronidation activity, without missing the isoform whose activity is highly sensitive to substrate inhibition. The screening results (Fig. 3) indeed gave strong indications for substrate inhibition in many of the UGTs, a property that was then studied in more detail.

Formation of magnolol glucuronide by recombinant UGT isoforms. Magnolol (12, 128, and 256 μM) was incubated with various recombinant human UGTs (0.1 mg/ml) at 37°C for 60 min. Data columns represent the mean of duplicate determinations.
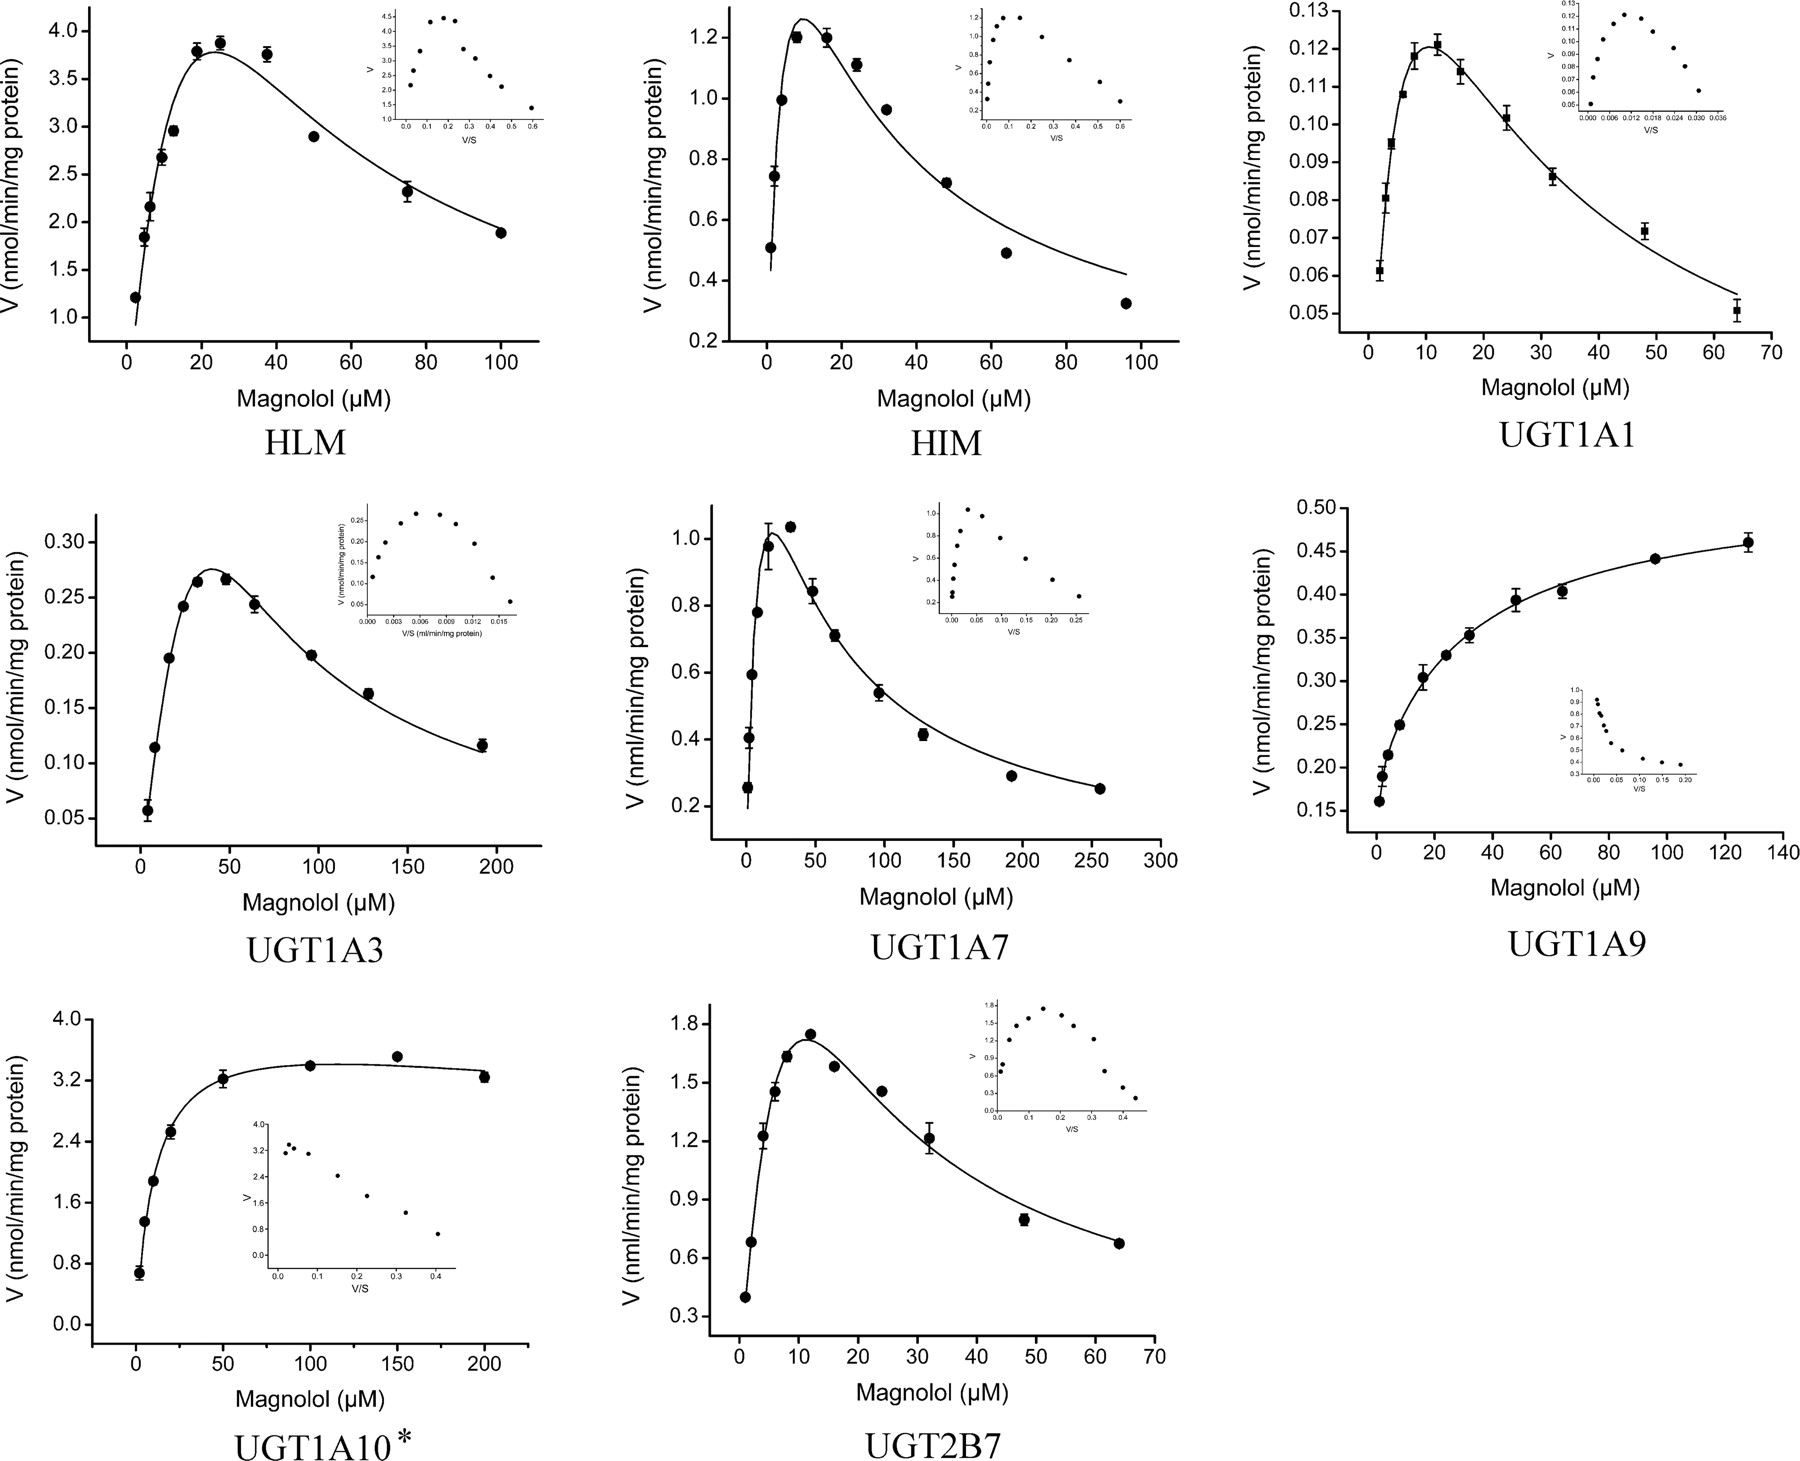
Kinetic Analyses.
Kinetic analyses were performed in HLM, HIM, and commercial recombinant UGT1A1, -1A3, -1A7, -1A9, and -2B7. The results were best simulated by the substrate inhibition kinetic model for all the tested enzymes and microsomes, with the exception of UGT1A9 (Fig. 4). In the case of recombinant UGT1A9, biphasic kinetics was observed rather than substrate inhibition (Fig. 4). In the case of UGT1A10, self-expressed enzyme (termed UGT1A10*) rather than commercial enzyme was used to perform the kinetic analysis. Results indicated that substrate inhibition and the Michaelis-Menten model could both describe it well (Table 2). For recombinant UGT1A8, the magnolol glucuronidation activity of this enzyme was too low to get reliable kinetic constants (data not shown). Kinetic parameters are listed in Table 2.

Kinetics of magnolol glucuronidation by HLM, HIM, and the commercial recombinant UGT1A1, -1A3, -1A7, -1A9, and -2B7 (DICP laboratory) and UGT1A10* (Helsinki laboratory). Eadie-Hofstee plots (V/S − V) are displayed as insets. Data points represent the mean of triplicate independent determinations, and error bars represent the calculated S.D.
Kinetic parameters for magnolol glucuronidation by HLM, HIM, and recombinant UGT isoforms
Data represent means ± S.E. of computer calculation.
Chemical Inhibition Studies.
Further information on the contribution of individual UGTs to magnolol glucuronidation in HLM or HIM may be obtained from UGT inhibition experiments with isoform-specific inhibitors. Therefore, we tried to inhibit magnolol glucuronidation by the main UGTs, using different inhibitors.
Chemical Inhibition for the Commercial Recombinant UGT Enzymes.
Although inhibition of diclofenac, phenylbutazone, and niflumic acid on UGTs had already been reported by several other investigations (Uchaipichat et al., 2004, 2006; Miners et al., 2011), given the possible dependence of substrate, inhibitory effects of the chemicals on recombinant UGTs were first tested to confirm the inhibition selectivity. Chemical inhibitors displayed concentration-dependent inhibition to magnolol glucuronidation by various UGT isoforms (data not shown). As displayed in Fig. 5, among the isoforms involved, diclofenac was a selective inhibitor for UGT2B7, niflumic acid for UGT1A7 and UGT1A9, and phenylbutazone for all UGT1As involved except UGT1A10. All inhibitors lacked effective inhibition to UGT1A10*. In the presence of diclofenac (100 μM), activity of UGT2B7 decreased to 24% of the control and activities of other isoforms decreased slightly. Phenylbutazone (500 μM) lowered glucuronidation activity of UGT1A1, -1A3, -1A7, and -1A9 to 24, 21, 28, and 36%, respectively, and had little inhibition on UGT2B7. In the presence of niflumic acid (100 μM), no metabolite was detected for UGT1A7, and remaining activity was approximately 21% of the control for UGT1A9. In contrast to the previous report (Miners et al., 2011), the inhibition of niflumic acid on UGT1A1 was not observed in the current study, possibly because of the use of a different substrate. It should be noted that the inhibition of these chemicals on recombinant UGT1A8 was not tested because of its low magnolol glucuronidation activity.

Inhibitory effects of phenylbutazone (500 μM), diclofenac (100 μM), and niflumic acid (100 μM) toward glucuronidation of magnolol (6 μM) by HLM, HIM, and recombinant UGT1A1, -1A3, -1A7, -1A9, -1A10*, and -2B7. Data columns represent the means of duplicate determinations.
Subsequent inhibition experiments with HLM revealed that magnolol glucuronidation was inhibited by approximately 71% in the presence of 100 μM diclofenac. However, the presence of either phenylbutazone or niflumic acid exerted only minimal inhibition on the magnolol glucuronidation activity of HLM (Fig. 5). Further examination of the inhibitory effect of diclofenac demonstrated that in both UGT2B7 and HLM, the IC50 values at three different substrate concentrations were very similar (Table 3).
IC50 values for inhibitory effects of diclofenac on magnolol glucuronidation by HLM and UGT2B7
Data are means ± S.E. of computer calculation.
Although the above chemical inhibition results strongly suggested that most of the magnolol glucuronidation activity in HLM was catalyzed by UGT2B7, they also revealed that the situation in HIM is different. The presence of either diclofenac or phenylbutazone caused moderate inhibitory effects on magnolol glucuronidation activity in HIM, whereas niflumic acid showed no detectable inhibition. The inhibitory effect of diclofenac on HIM, under the same conditions as used for HLM above, was (only) 44% of the control, whereas the presence of 500 μM phenylbutazone led to 37% inhibition. Hence, the chemical inhibition studies suggested that an additional UGT (or UGTs) in HIM is playing a significant role in magnolol glucuronidation and that this enzyme (or enzymes) is less sensitive to diclofenac than UGT2B7.
Contributions of UGT Enzymes.
Because chemical inhibition studies were not sufficient to distinguish possible contributors to magnolol glucuronidation in HIM, the RAF approach was used to determine the roles of UGTs in magnolol glucuronidation in HIM as well as in HLM (Table 4; Fig. 6).
RAF values for major isoforms

Relative contributions of UGT isoforms to HLM (A, DICP laboratory) and HIM (B, DICP laboratory; C, Helsinki laboratory). because of the low activity of the commercial recombinant UGT1A10, the contribution of this isoform to intestinal magnolol glucuronidation (6 μM) is not separately displayed and is included in the contribution of others (B).
Contributions of UGTs to hepatic glucuronidation.
The rate of ethinylestradiol glucuronidation by the recombinant (commercial) UGT1A1 was almost equal to that of HLM, leading to a RAF value of 0.96 for this enzyme. The rate of propofol glucuronidation by HLM was lower than that by recombinant UGT1A9 and the resulting RAF value for UGT1A9 in HLM was 0.49. The rate of AZT glucuronidation by HLM was higher than that by recombinant UGT2B7, and the derived RAF value for this enzyme in HLM was 1.9.
When magnolol glucuronidation rates by HLM and UGT1A1, -1A9, and -2B7 at a substrate concentration of 6 μM were determined, the respective RAF values for these UGTs suggested that UGT2B7 contributes approximately 81% of this activity in HLM, whereas UGT1A1 and UGT1A9 contribute 5 and 3%, respectively. Repeating these assays at a substrate concentration of 12 μM suggested that UGT2B7, -1A1, and -1A9 contribute approximately 87, 4, and 6%, respectively, to the magnolol glucuronidation in HLM. A further increase in the magnolol concentration, to 24 μM, led to a minor further increase in the contribution of UGT2B7 to approximately 89%, whereas the respective contributions of UGT1A1 and UGT1A9 were approximately 5 and 4%. Hence, the outcomes of the RAF approach in HLM were in full agreement with the results of the chemical inhibition experiments, namely that UGT2B7 is by far the main contributor to magnolol glucuronidation in HLM.
Contributions of UGTs to intestinal glucuronidation.
Based on the success of the RAF approach in hepatic magnolol glucuronidation phenotyping, we extended it to phenotype the reaction in intestine. The rate of ethinylestradiol glucuronidation by the recombinant UGT1A1 was higher than that by HIM, leading to a RAF value of 0.30 for this enzyme. The rate of AZT glucuronidation by HIM was much lower than that by recombinant UGT2B7 and the derived RAF value was (only) 0.18. To determine the contribution of UGT1A10 to magnolol glucuronidation in HIM, dopamine was used as the selective substrate. The dopamine glucuronidation rate by HIM was much higher than that by the commercial recombinant UGT1A10, and the derived RAF value was 4.3. On the basis of these values, it was concluded that at a substrate concentration of 6 μM UGT1A1 and UGT2B7 contributed, respectively, 6 and 35% to the magnolol glucuronidation in HIM. Because the rate of magnolol glucuronidation by UGT1A10 at 6 μM substrate was below the detection limit, the contribution of UGT1A10 was not calculated. At 12 μM magnolol, UGT2B7 and UGT1A10 contributed, respectively, 42 and 29% to intestinal magnolol glucuronidation, whereas UGT1A1 contributed 7%. A further increase in the magnolol substrate concentration, to 24 μM, led to only a minor increase in the contribution of UGT1A1 and UGT2B7, respectively, 8 and 44%, but to a much larger increase in the contribution of UGT1A10, approximately 43% to the magnolol glucuronidation in HIM.
However, there was a problem that should have been addressed at that point. It was difficult to reconcile the significant contribution of UGT1A10, as suggested by RAF, with the low magnolol glucuronidation activity of the (commercial) recombinant enzyme. To overcome this difficulty and to examine the possibility that the source of the problem was in the activity of the recombinant UGT1A10, we selected another UGT1A10 preparation in the Helsinki laboratory, one that was previously reported to exhibit significantly higher activity than the commercial UGT1A10 (Itäaho et al., 2009).
In contrast to the results with the commercial UGT1A10 in the DICP laboratory, the dopamine glucuronidation rate of UGT1A10* was significantly higher than that of HIM*, resulting in an RAF value of 0.28. Also different from the results in the DICP laboratory, in the Helsinki laboratory, the rate of AZT glucuronidation in HIM* was higher than that in UGT2B7*, and the RAF value for this enzyme in HIM was found to be 1.3. On the basis of these RAF values, the Helsinki laboratory results indicated that at 5 μM magnolol, UGT1A10 contributed approximately 33% to magnolol glucuronidation in HIM, whereas UGT2B7 contributed 27%. At a 20 μM magnolol concentration, the contributions of UGT1A10 and UGT2B7 were 26 and 37%, respectively.
Hence, regardless of the use of different enzyme preparations and microsomes samples, the results in both the DICP and Helsinki laboratories showed that UGT1A10, alongside UGT2B7, is a significant contributor to magnolol glucuronidation in HIM (Fig. 6).
Discussion
This study is focused on the characterization of the glucuronidation of magnolol in human liver and intestine. Both HLM and HIM can effectively catalyze magnolol glucuronidation, forming the 2-O-monoglucuronide. Magnolol glucuronidation exhibits two distinct features. First, multiple UGT isoforms, including several hepatic UGTs (UGT1A1, -1A3, -1A9, and -2B7) and a few extrahepatic enzymes (UGT1A7, -1A8, and -1A10), are all involved in magnolol glucuronidation. Second, nearly all UGTs, with the possible exception of UGT1A10, exhibit atypical kinetics toward magnolol glucuronidation (Table 2). Among them, UGT1A9 is an interesting exception that exhibits biphasic kinetics, a rare interaction model with the substrate.
Because multiple UGTs are involved in magnolol glucuronidation, and each enzyme shows atypical kinetics, it is quite challenging to correctly determine the relative contributions of individual isoforms in liver and intestine. Because only a limited number of UGT selective inhibitors are currently available, magnolol glucuronidation in the recombinant UGT is essential to estimate the relative contributions of individual isoforms. However, the rate of magnolol glucuronidation by a recombinant UGT rarely reflects the true glucuronidation rate of the individual UGTs in HLM and HIM. This finding is fully exemplified in this study. The rate of a marker reaction in the recombinant enzyme differed a lot from that in tissue microsomes, making the RAF value rarely approximately 1. Thus, the glucuronidation rate by the recombinant enzyme often gives misleading information of the contribution of this isoform in native tissues, such as magnolol glucuronidation by commercial UGT1A10. The RAF approach offered a new possibility to closely estimate the roles of individual UGTs in human liver and intestine.
The RAF approach is seldom used in UGT phenotyping. A possible reason for this may be that determination of a RAF value requires enough specific substrates for the different UGTs, with selectivity of at least 80% (Crespi and Miller, 1999). Nevertheless, whereas there are still only a few fully specific substrates for individual UGTs, it is easier to find suitable substrates when the expression pattern of the UGTs in the tissue tested is taken into account. In the current study, magnolol glucuronidation phenotyping in HLM and HIM was separately conducted, under full consideration of expression of UGTs in liver and intestine. The following substrates were used: ethinylestradiol for UGT1A1 in HLM and HIM (Soars et al., 2003), propofol for UGT1A9 in HLM (Soars et al., 2004), dopamine for UGT1A10 in HIM (Itäaho et al., 2009), and AZT for UGT2B7 in HLM and HIM (Court et al., 2003).
According to the tissue-specific UGT expression pattern (Ohno and Nakajin, 2009), UGT1A7, -1A8, and -1A10 can be excluded from hepatic magnolol glucuronidation. Among the other UGTs, the RAF approach indicated that UGT2B7 was almost solely responsible for the hepatic magnolol glucuronidation, with only limited contribution from UGT1A1, -1A3, and -1A9. The contribution of UGT2B7 to the liver reaction was in full agreement with the chemical inhibition results. Diclofenac showed potent inhibition to both HLM and recombinant UGT2B7 and even similar inhibition IC50 values (Table 3). In particular, at a 24 μM substrate concentration, the reaction rate began to decrease in assays with recombinant UGT2B7. It was assumed that the contribution of UGT2B7 would decrease; however, diclofenac also gave inhibition values similar to those of UGT2B7 and HLM, strongly suggesting that UGT2B7 plays the predominant role in the liver reaction through the whole concentration range. In addition, very little inhibition was exerted by the non-UGT2B7 inhibitors on HLM (phenylbutazone and niflumic acid). The consistencies of these experiments fully validated use of the RAF approach, leading to its further application in intestinal reaction phenotyping.
Compared with the hepatic magnolol glucuronidation, the intestinal reaction was more complicated. According to the tissue-specific UGTs expression pattern (Ohno and Nakajin, 2009), it can be assumed that all magnolol glucuronidation UGTs contribute to intestinal magnolol glucuronidation. Both diclofenac and phenylbutazone showed moderate inhibition to magnolol glucuronidation in HIM, indicating that the reaction in HIM was mediated by multiple isoforms with comparable contributions. Of note, niflumic acid, a potent inhibitor of UGT1A7 and UGT1A9, exhibited no inhibition to intestinal magnolol glucuronidation. Thus, UGT1A7 and UGT1A9 contributed little to the intestinal reaction, despite the recombinant enzymes, particularly UGT1A7, exhibiting considerable magnolol glucuronidation activities. This result may be evidence of low expression of UGT1A7 and UGT1A9 in human intestine (Strassburg et al., 1998, 2000).
Chemical inhibition failed to give further detailed information on the contribution of individual UGTs to intestinal magnolol glucuronidation. The RAF approach indicated that both UGT2B7 and UGT1A10 contributed significantly, whereas UGT1A1 contributed insignificantly (less than 10%). Of interest, the significant contribution of UGT1A10 is contrary to the assays with commercial recombinant enzyme that exhibited the low magnolol glucuronidation activity. To further investigate whether UGT1A10 acts as a significant contributor, a more active enzyme (UGT1A10*) was used to perform magnolol glucuronidation assays. Assays with UGT1A10* are in agreement with the RAF results for the commercial recombinant enzyme.
It should be noted here that the RAF values are dramatically different between the two laboratories because different sources of UGT1A10, UGT2B7, and HIM were used. Take UGT1A10, for example. Because the commercial recombinant UGT1A10 showed much lower activity than the self-constructed one (UGT1A10*), the RAF value for UGT1A10 was much higher when the commercial enzyme was used. The differences in RAF values may be caused by the different levels of UGT1A10 expression and the percentage of active UGT1A10 as well as other factors in the enzyme sources used. These differences in sample activity between laboratories did not undermine the usefulness of the RAF methodology. On the contrary, it may even make this approach more important. The results of this study demonstrated how successful the methodology was for deciphering the contributions of individual UGTs from assays with one poor recombinant enzyme without being aware of the activity problem. Although recombinant (commercial) UGT1A10 showed poor activity, the RAF approach did not underestimate the true role of this enzyme in intestinal magnolol glucuronidation.
This study provided a very good example of the powerful value of application of the RAF approach in detecting individual UGTs that contribute to specific reactions in human tissues. However, one item of note is that the respective roles of UGT1A3 and UGT1A8 in intestine glucuronidation are still not clear in the current study because of the lack of a selective inhibitor and substrate. On the other hand, according to this study, the total contributions of UGT1A1, -1A10, and -2B7 to intestinal magnolol glucuronidation are more than 80%. Thus, the roles of UGT1A3 and UGT1A8 are insignificant in the intestinal reaction. One more item of note is that because not all UGTs are currently commercial available, several other UGTs (including UGT1A5, -2B10, -2B11, -2A1, and -2A2) can also potentially catalyze the magnolol glucuronidation. However, they contribute little to the reaction in human liver and intestine, either based on this study or on their low expression level in these two tissues (Ohno and Nakajin, 2009; Sneitz et al., 2009).
This study not only presented the power of RAF in glucuronidation phenotyping but also issued an alarm for the application of magnolol. From this study, it can be concluded that UGT1A10 and UGT2B7 play important roles in magnolol glucuronidation. Magnolol glucuronidation occurs at a relatively low rate in those with impaired glucuronidation activities of these two enzymes. Previous studies indicated that glucuronidation activity of UGT2B7 was low in children (Strassburg et al., 2002; Zaya et al., 2006). Of note, children may take a high dose of magnolol (1.64 mg/kg per day). It can be anticipated that magnolol may reach a relatively high concentration in plasma. Based on this study, magnolol showed high affinity for several UGTs with low Ks or Ksi values, in particular for UGT1A9, with one Ks value less than 1 μM (Table 2), suggesting that magnolol may possibly act as an potent UGT inhibitor. The risk of magnolol inducing undesired drug-drug interactions through inhibition of UGT enzymes should be evaluated, particularly in children with an overdose of this compound.
In summary, multiple UGT isoforms are involved in magnolol glucuronidation, and most of them exhibit atypical kinetics. The RAF approach is proved to be a powerful tool in glucuronidation phenotyping on this condition, compensating for a lack of selective UGT inhibitors. The results clearly indicate UGT2B7 is a predominant isoform in magnolol glucuronidation in human liver, whereas UGT1A10 and UGT2B7 are significant contributors in intestine.
Authorship Contributions
Participated in research design: Zhu, Ge, H. Zhang, Liu, Finel, and Yang.
Conducted experiments: Zhu, H. Zhang, Liang, and Fang.
Contributed new reagents or analytic tools: Zhu and Ge.
Performed data analysis: Zhu, H. Zhang, Y. Zhang, and Dong.
Wrote or contributed to the writing of the manuscript: Zhu, Ge, H. Zhang, He, Finel, and Yang.
Acknowledgments
We thank Dr. Xiaochi Ma from Dalian Medical University for help in NMR analysis and Joann Mosorin of the Helsinki laboratory for recombinant UGT preparations.
Footnotes
This work was supported by the National Natural Science Foundation of China [Grants 30973590, 81001473]; the National Key Technology Research and Development Program of China [Grant 2009BADB9B02]; the State Key Development Program of Basic Research of China [Grant 2009CB522808]; the National High Technology Research and Development Program of China [Grant 2009AA02Z205]; the Knowledge Innovation Program of the Chinese Academy of Sciences [Grant KSCX2-YW-G-050]; and the Sigrid Juselius Foundation, Finland.
Article, publication date, and citation information can be found at http://dmd.aspetjournals.org.
-
ABBREVIATIONS:
- UGT
- UDP-glucuronosyltransferase
- UDPGA
- uridine diphosphate glucuronic acid
- RAF
- relative activity factor
- AS-3201
- (R)-(−)-2-(4-bromo-2-fluorobenzyl)-1,2,3,4-tetrahydropyrrolo[1,2-α]pyrazine-4-spiro-3′-pyrrolidine-1,2′,3,5′-tetrone
- HPLC
- high-performance liquid chromatography
- HLM
- human liver microsomes
- AZT
- 3′-azido-3′-deoxy-thymidine
- HIM
- human intestine microsomes
- UFLC
- ultrafast liquid chromatography
- DAD
- diode-array detector
- MS
- mass spectrometry
- ESI
- electrospray ionization
- LC
- liquid chromatography
- SPE
- solid-phase extraction.
- Received August 4, 2011.
- Accepted December 16, 2011.
- Copyright © 2012 by The American Society for Pharmacology and Experimental Therapeutics


