


Abstract
Canagliflozin is an oral antihyperglycemic agent used for the treatment of type 2 diabetes mellitus. It blocks the reabsorption of glucose in the proximal renal tubule by inhibiting the sodium-glucose cotransporter 2. This article describes the in vivo biotransformation and disposition of canagliflozin after a single oral dose of [14C]canagliflozin to intact and bile duct-cannulated (BDC) mice and rats and to intact dogs and humans. Fecal excretion was the primary route of elimination of drug-derived radioactivity in both animals and humans. In BDC mice and rats, most radioactivity was excreted in bile. The extent of radioactivity excreted in urine as a percentage of the administered [14C]canagliflozin dose was 1.2%–7.6% in animals and approximately 33% in humans. The primary pathways contributing to the metabolic clearance of canagliflozin were oxidation in animals and direct glucuronidation of canagliflozin in humans. Unchanged canagliflozin was the major component in systemic circulation in all species. In human plasma, two pharmacologically inactive O-glucuronide conjugates of canagliflozin, M5 and M7, represented 19% and 14% of total drug-related exposure and were considered major human metabolites. Plasma concentrations of M5 and M7 in mice and rats from repeated dose safety studies were lower than those in humans given canagliflozin at the maximum recommended dose of 300 mg. However, biliary metabolite profiling in rodents indicated that mouse and rat livers had significant exposure to M5 and M7. Pharmacologic inactivity and high water solubility of M5 and M7 support glucuronidation of canagliflozin as a safe detoxification pathway.
Introduction
Type 2 diabetes mellitus (T2DM), a chronic disease with worldwide prevalence (Chen et al., 2012), is characterized by hyperglycemia caused by excessive hepatic glucose production, a deficiency in insulin secretion, and/or peripheral insulin resistance. Drugs for T2DM act by increasing insulin levels, enhancing insulin sensitivity, or reducing glucose absorption. Despite an armamentarium of agents with antihyperglycemic efficacy in T2DM, only 50% of patients achieve the glycemic treatment goals set forth by expert societies (Stark Casagrande et al., 2013). Thus, there is a need to develop new agents with novel mechanisms of action to control glucose levels in patients with T2DM. The most desirable drugs would improve glycemic control with little or no risk of hypoglycemia, promote weight loss, and improve pancreatic β-cell function.
Sodium glucose cotransporter 2 (SGLT2) is expressed primarily in the early proximal renal tubule and is responsible for most of the glucose reabsorption in the kidney (Wright et al., 2007). Inhibition of SGLT2 decreases glucose reabsorption in the renal tubule and increases glucose excretion (Hardman and Dubrey, 2011). Partitioning of glucose out of the body through increased urinary glucose excretion directly reduces elevated blood glucose concentrations. As a result of urinary caloric loss secondary to glucose excretion, body weight neutrality or weight loss is expected with SGLT2 inhibitor treatment.
Canagliflozin [CAS 842133-18-0, (1S)-1,5-anhydro-1-[3-[[5-(4-fluorophenyl)-2-thienyl] methyl]-4-methylphenyl]-d-glucitol], a new oral antihyperglycemic agent and a selective SGLT2 inhibitor, has been shown to reduce the renal threshold for glucose reabsorption, increase urinary glucose excretion, reduce plasma glucose, and promote weight loss in preclinical and clinical studies (Nomura et al., 2010; Sha et al., 2011; Liang et al., 2012; Rosenstock et al., 2012; Devineni et al., 2013).
The objective of the present study was to determine the metabolism and excretion of canagliflozin in preclinical species (mice, rats, and dogs) and humans after a single oral dose of [14C]canagliflozin. Major and minor metabolites were quantified in plasma, in urine and feces, and in mouse and rat bile. Information generated from these studies was used to support the nonclinical safety evaluation of canagliflozin.
Materials and Methods
Test Article
Canagliflozin, specifically labeled with 14C at the methylene carbon (Fig. 1), was synthesized by Janssen Research & Development, LLC (Spring House, PA). The 14C label at this position is metabolically stable, as evidenced by the lack of 14CO2 exhalation in the rat after oral dosing of [14C]canagliflozin. The stock solution of [14C]canagliflozin had a specific activity of 2.0 GBq/mmol (4.5 MBq/mg) and a radiochemical purity of 99.8%. Dosing formulations were prepared by combining appropriate amounts of radiolabeled and unlabeled canagliflozin to meet the target specific activity. Radiochemical purities of [14C]canagliflozin in study formulations ranged between 97.2% and 99.8%. Metabolite reference standards were synthesized at Janssen Pharmaceutical Research & Development.

Structure of [14C]canagliflozin with position of 14C label (*)
Animal Experiments
All animal experiments were conducted according to the standards recommended by the Guide for the Care and Use of Laboratory Animals (Institute of Laboratory Animal Resources, 1996), and protocols were approved by the Janssen Research & Development, LLC, Animal Care and Use Committee. All animals were treated with a single dose of [14C]canagliflozin followed by collection of plasma, urine, and feces at predefined intervals (see individual studies in the following sections). Mass balance of total radioactivity (TR) for excreta was determined by summing radioactivity in samples for the entire collection period, plus radioactivity in cage debris and cage washings obtained at terminal sample times. Biliary excretion studies were conducted in bile-duct cannulated (BDC) mice and rats.
Intact Mouse Study.
Male and female Swiss SPF Albino (CD1) mice obtained from Charles River Laboratories, Inc. (Sulzfeld, Germany) were divided into two groups. Group A animals were used for generating plasma metabolite profiles and were housed by sex in grid-bottomed polypropylene cages (n = 40/sex; 10 per cage). Those in group B were used for the metabolism-excretion balance study and were placed in glass metabolism cages (n = 16/sex; four per cage). A suspension of [14C]canagliflozin in 0.5% hypromellose with a specific activity of 22.2 kBq/mg was given by oral gavage to 5-week old mice at 100 mg/kg (2.2 MBq/kg). After the dose, plasma samples were collected from group A animals (n = 10/sampling time/sex) at 1, 4, 7, and 24 hours, and for group B animals, urine was collected at defined intervals of 0–7, 7–24, 24–48, 48–72, and 72–96 hours, and feces were collected every 24 hour sfor 4 days. All samples were stored at −20°C until analysis.
Intact Rat Study.
Sprague-Dawley rats of either sex were obtained from Charles River Laboratories, Inc. (Wilmington, MA) at approximately 8–10 weeks of age and were divided into two groups. Group A animals were used for generating plasma metabolite profiles and were housed by sex in plastic cages (n = 10/sex; 2 per cage), and group B animals, used for mass balance and metabolic profiling, were placed in metabolic cages (treated, n = 4/sex, one per cage; vehicle control n = 1/sex). [14C]Canagliflozin was formulated as a suspension in 0.5% hypromellose with a specific activity of 1.5 MBq/mg. The rats were given an oral gavage dose of 3 mg/kg (approximately 4.6 MBq/kg). After dose administration, plasma samples were collected from group A animals (n = 2/sampling time/sex) at 1, 2, 4, 8, and 24 hours. For group B animals, urine was collected during intervals of 0–4, 4–8, 8–24, 24–48, 48–72, 72–96 and 96–120 hours, and feces were collected daily for 5 days. All samples were stored at −20°C until analysis.
Intact Dog Study.
[14C]Canagliflozin was formulated as a 0.5% hypromellose suspension at a specific activity of 103 kBq/mg. After an acclimatization period, three male dogs obtained from Covance (Cumberland, VA) received an oral gavage dose of [14C]canagliflozin at 4 mg/kg (approximately 0.4 MBq/kg). Postdose sample collections were obtained at 0.5, 1, 4, 8, 24, 72, and 96 hours for plasma, at several intervals between 0 and 144 hours for urine and on 6 consecutive days for feces. All samples were stored at −20°C until analysis.
BDC Mouse Study.
Biliary excretion of radioactivity and canagliflozin metabolites in bile were studied in BDC male CD-1 mice obtained from Charles River, Inc. (Raleigh, NC) at approximately 8–10 weeks of age. Five BDC mice (weighing ∼30 g) were housed individually in plastic metabolism cages. Mice fasted overnight received [14C]canagliflozin as a 0.5% hypromellose suspension with a specific activity of 62 kBq/mg. After a single oral gavage dose of 100 mg/kg (approximately 6.16 MBq/kg), the mice were afforded unlimited access to food and water. Bile was collected at intervals of 0–4, 4–8, or 8–24 hours after the dose. A single pool for each time interval was prepared by mixing common fractions from each mouse. A 0- to 24-hour bile pool was created for each mouse by proportional pooling of samples from the three single time-interval pools. Feces were not collected in this study. All bile samples were stored at −20°C until analysis.
BDC Rat Study.
Biliary excretion of canagliflozin and its metabolites was investigated in BDC male Sprague-Dawley rats obtained from Harlan Laboratories (Horst, The Netherlands) at approximately 9–11 weeks of age. BDC rats were individually housed in plastic metabolism cages. A single oral dose of [14C]canagliflozin, formulated as a 0.5% hypromellose suspension with a specific activity of 493 kBq/mg, was administered to four rats by oral gavage at a dose level of 3 mg/kg (1.48 MBq/kg). During sample collection, bile salts were replenished with a solution of 0.5% (w/v) sodium taurocholate in 0.9% NaCl infused at 0.6 ml/h via the duodenal catheter. After dose administration, bile was collected at intervals of 0–4, 4–8, 8–12, 12–16, and 16–24 hours, and urine and feces were collected over a 0- to 24-hour period. Single bile pools for each time interval were created by proportional mixing of samples from each rat. All samples were stored at −20°C until analysis. Representative rat bile samples (0- to 8-hour intervals after dose) were incubated in vitro with β-glucuronidase/arylsulfatase from Helix pomatia (Roche Applied Science, Indianapolis, IN) to facilitate identification of glucuronide conjugates of canagliflozin and/or its metabolites. Enzyme-treated and -untreated bile samples were analyzed by ultrahigh performance liquid chromatography (UHPLC) with radioactivity detection. Mono-oxygenated and O-glucuronide metabolites of canagliflozin were identified from product ion spectra generated by an LTQ-Orbitrap mass spectrometer.
Human Study
The metabolism and excretion of canagliflozin were conducted as a single-dose, single-center, open-label study in healthy adult males. The protocol of the clinical trial was approved by an internal review committee and an independent ethics committee, and the trial was performed in accordance with the Declaration of Helsinki and its subsequent revisions. Six healthy male subjects with the following profile participated in the study: age 19–45 years; body mass index 18–26 kg/m2, body weight 62–87 kg, and good health based on medical history. All subjects gave their full informed consent before the start of the study.
A target radioactivity level of 1480 kBq (or 40 µCi) for the intended [14C]canagliflozin dose was considered sufficient to accurately detect and study canagliflozin metabolism. Human radiation exposure from 1480 kBq of internal 14C was estimated to be less than 1 mSv. These dosimetry calculations were derived from tissue distribution of total radioactivity in a single-dose [14C]canagliflozin study in male Long-Evans rats and from [14C]canagliflozin excretion-mass balance data in rats and dogs. Radiation doses between 100 and 1000 μSv are classified as category IIa, defined as a minor level of risk to the subject (Verbruggen et al., 2008).
Subjects were admitted to the investigator’s facility on day −1 and fasted overnight for at least 8 hours. [14C]Canagliflozin was formulated as a 0.5% hypromellose suspension with a specific activity of 7.72 kBq/mg. On day 1, each subject received a single 188 mg of [14C]canagliflozin dose by orally consuming 4 ml of formulation containing approximately 1451 kBq (39.2 μCi) of radioactivity. Subjects then drank the water (approximately 240 ml) used to rinse drug residue from the medication bottle. Standardized lunch and dinner were provided approximately 4 hours and 10 hours after drug administration, and a snack was allowed in the evening throughout the confinement period. After dose administration, blood samples were obtained at 1.5, 4, 8, 12, and 24 hours; urine was collected at intervals of 0–4, 4–8, 8–12, 12–24, 24–48, 48–72, 72–96, 96–120, 120–144, and 144–168 hours; and feces (per stool) were collected every 24 hours through day 8. For subjects who had to extend their residency in the study unit, feces were collected for each 24-hour interval. Plasma, urine, and feces were kept at −20°C until sample analysis.
Analysis of Radioactivity
Radioactivity in plasma, urine, and bile samples from animal studies was quantified by liquid scintillation counting (LSC) using a Packard 3100TR liquid scintillation counter (PerkinElmer, Shelton, CT). Aliquots of plasma (0.2 ml), urine (0.2 ml), and bile (0.05 ml) were mixed with 15 ml of Ultima Gold scintillation fluid (PerkinElmer) and analyzed directly by LSC. Feces from animals and humans were processed as described in the following sections, and samples were subsequently combusted in a Packard sample oxidizer (A307). Rat and dog fecal samples were homogenized in methanol/water (50/50, v/v), and aliquots were added directly to the sample oxidizer. Mouse and human feces samples were homogenized in methanol followed by centrifugation of the suspension. Residues were extracted twice more with methanol. Residues were suspended in methanol and then recovered by filtration through a Buchner funnel. Radioactivity levels in methanol retained during residue extractions were determined by LSC. Fecal residues were air-dried and then ground to a fine powder in an Ultra Centrifugal Mill ZM100 (Resch GmBH, Haan, Germany). Four weighed portions of each residue sample were placed in the sample oxidizer. Liberated 14CO2 was captured with Carbo-Sorb E (Packard), Permafluor scintillation cocktail was then added, and radioactivity was quantified using a Packard 2900TR or 3100TR liquid scintillation counter (PerkinElmer). Rat and dog feces homogenates and methanol fractions from mouse and human fecal extractions were stored at −20°C until analysis.
Preparation of Biologic Samples for Metabolite Profiling
When appropriate, individual or overall pools of urine, bile, or methanolic fecal extracts were prepared by mixing constant fractions of individual samples or individual pools, respectively. Overall plasma pools were prepared by mixing equal volumes of individual samples. For plasma and urine samples, protein was precipitated with 6 volumes of acetonitrile. Methanol from mouse and human fecal extractions was evaporated to dryness under nitrogen at room temperature before protein precipitation with 6 volumes of acetonitrile containing 0.01% formic acid. Protein in 2 g portions of rat and dog feces homogenates was precipitated with 4–6 volumes of acetonitrile containing 0.01% formic acid. Acetonitrile extracts of matrices were vortex-mixed and centrifuged at 3000 rpm at 5°C for 10 minutes. At least 85% of radioactivity was recovered in the supernatants of fecal samples. Supernatants of all matrices were evaporated to dryness under a stream of nitrogen, and residues were reconstituted in 0.25–0.5 ml of water-acetonitrile (9:1). Drug-derived materials were solubilized by sonication and vortex-mixing before centrifuge filtration of samples through a 0.45-µm nylon filter. Filtrates were transferred to 96-well plates for analysis of metabolites by liquid chromatography and tandem mass spectrometry.
Liquid Chromatography.
Except for rat bile, profiling of metabolites in radioactive samples was conducted using an HP 1100 high-performance liquid chromatography (HPLC) system (Agilent Technologies, Wilmington, DE) consisting of a solvent delivery pump, membrane degasser, autosampler, and a v.ARC radioactivity detector (AIM Research Company, Hockessin, DE). Chromatographic separation of the unchanged drug and its metabolites was achieved using a HyPurity Aquastar reverse-phase HPLC column (150 × 2.1 mm ID, 3 µm; Thermo Fisher Scientific Inc., Bellefonte, PA) kept at 50°C. A flow rate of 0.4 ml/min was used throughout the analysis. Sample components were eluted with a nonlinear solvent gradient consisting of 2.5 mM ammonium acetate (solvent A) and acetonitrile (solvent B). The mobile-phase composition started with 10% B and was increased to 95% B over the course of 35 minutes. The column was then equilibrated for 10 minutes with 10% A. The eluate from the HPLC column was split postcolumn into two flows, each directed at a rate of 0.2 ml/min into the radioactivity detector and the mass spectrometer (MS). The radioactivity detector was operated in the homogeneous liquid scintillation dynamic flow counting mode with the addition of 0.2 ml/min of StopFlow AD scintillation cocktail (AIM Research Company, Hockessin, DE) to the eluate and mix before radioactivity detection.
Rat bile samples were analyzed using Accela (Thermo Fisher Scientific, San Jose, CA) or Acquity/Binary Solvent Manager (Waters Corp., Milford, MA) UHPLC systems equipped with an Uptisphere Strategy RPX C-18-2 column (150 × 3 mm ID, 2.2 μm) (Interchim, Montlucon, France) and coupled to a Berthold LB-509 radioactivity detector (Berthold Technologies, Bad Wildbad, Germany). Samples were eluted at a flow rate of 0.8 ml/min with a linear solvent gradient consisting of 2.5 mM ammonium acetate (solvent A) and acetonitrile (solvent B). The eluate from the UHPLC system was split postcolumn into two flows, 0.65 ml/min into the radioactivity detector, and 0.15 ml/min into the mass spectrometer. Ultima Flo M scintillation cocktail (Perkin Elmer, Boston, MA) was added with a Berthold scintillator pump via a custom-made variable scintillation flow setup (Cuyckens, et al., 2008). The mobile-phase composition started with 10% solvent B and was increased to 90% solvent B over the course of 33 minutes. The column was then equilibrated for 6 minutes using initial mobile-phase conditions.
Mass/Nuclear Magnetic Resonance Spectrometry.
LTQ linear ion trap and LTQ-Orbitrap mass spectrometers (Thermo Scientific, Inc.) were used for metabolite identification. Both systems were equipped with an electrospray ionization source operated in the positive ion mode. Accurate mass measurements using LTQ/Orbitrap were obtained by modification of a previously reported procedure for external mass calibration using a mixture of caffeine, MRFA peptide, and Ultramark 1621 (Ultramark Adhesive Products Ltd, Lancaster, UK) (Lim et al., 2007) or internal mass calibration by infusion of 10 pg/μl of tamoxifen (Lim et al., 2011). The source parameters were tuned for maximum sensitivity by infusion of 5 or 10 ng/μl canagliflozin in 50% acetonitrile/50% water directly into the mobile phase. The same solution was used to define the optimal collision energy used during MSn fragmentation. The unchanged drug and its metabolites were detected using data-dependent multiple-stage mass analysis with an isolation width of 2 Da, normalized collision energy of 20%, 25%, and 30% for MS2, MS3, and MS4, respectively, an activation q of 0.25, and an activation time of 30 ms. Data acquisition and processing were carried out using Xcalibur 2.0 (Thermo Scientific, Inc., San Jose, CA). For a selection of samples, Metabolynx software (Waters, Manchester, UK) was used for metabolite identification via control-analyte comparison after conversion of the XCalibur data.
Nuclear magnetic resonance (NMR) spectroscopy was used for structural elucidation of selected metabolites (see Supplemental Method).
In Vitro Pharmacologic Activities for Canagliflozin and its Metabolites, M5 and M7.
The canagliflozin O-glucuronide metabolites M5 and M7 were assessed for potential inhibitory effects on uptake of the SGLT2 substrate α-methyl-d-glucopyranoside in Chinese hamster ovary K1 cells stably expressing human SGLT2. M5 and M7 were each evaluated in separate experiments, and canagliflozin was included as the reference. Compounds were prepared in assay medium consisting of 50 mM HEPES, 20 mM Tris base, 5 mM KCl, 1 mM MgCl2, 1 mM CaCl2, and 137 mM NaCl, pH 7.4. The tested concentration ranges were 0.45–3,000 nM for canagliflozin, 1–5000 nM for M5, and 12–10,000 nM for M7. Lysine-coated 96-well plates were seeded with 30,000 or 65,000 cells per well and incubated in growth medium for up to 48 hours. Cells were rinsed with assay medium and then incubated with test compound solutions. After 15 minutes, 0.1 μCi of 500 μM [14C]α-methyl-d-glucopyranoside was added to each well, and plates were incubated for 2 hours at 37°C. Cells were washed at least three times with ice-cold phosphate buffer solution and then solubilized by adding 0.05 ml/well of MicroScint-20 (PerkinElmer) before assay of radioactivity uptake by LSC.
Data Analysis
The radioactivity excreted in urine and feces was expressed as percentage of the administered radioactivity. The mass balance of canagliflozin and its metabolites was based on total recovery of radioactivity in urine and feces plus collected residual material. Profiles of the plasma concentrations of radioactivity and canagliflozin or its metabolites were analyzed by standard noncompartmental analysis (WinNonlin v4.0.1; Pharsight, Mountainview, CA). At a minimum the following parameters were estimated: Cmax and corresponding peak time (Tmax) and the area under the plasma concentration-time curve (AUC).
Results
Excretion of Radioactive Dose
Recovery of radioactivity in urine, feces, or bile was determined after administration of a single oral dose of [14C]canagliflozin to intact mice, rats, dogs, or humans or to BDC mice and BDC rats (Table 1). Most of the radioactive dose administered to intact animals and humans was excreted in feces, with mean radioactivity recoveries of approximately 92% (0–96 hours) in mice, 89–90% (0–120 hours) in rats, 94% (0–144 hours) in dogs, and 60% (0–168 hours) in humans. The radioactivity in fecal samples from mice and humans was calculated as the sum of the radioactivity in the methanol extracts and the fecal residues prepared from these samples. Mean percentages of radioactivity in urine during the same intervals in intact animals were approximately 6% in mice, 4% to 5% in rats, 2% in dogs, and 33% in humans. The mean recovery of the total radioactivity in bile during a 24-hour collection interval accounted for approximately 49% of the dose in BDC mice and 52% in BDC rats. In BDC rats, the total radioactivity in feces represented approximately 22% of the dose, whereas a smaller amount (∼4%) was found in urine. Total recovery of radioactivity ranged from approximately 97% to 99% in intact animals and 93% in humans.
Percentage of radioactive dose recovery in mice, rats, dogs, and humans
Pharmacokinetics of Total Radioactivity
Mean pharmacokinetic parameters of plasma radioactivity in mice, rats, dogs, and humans are summarized in Table 2. Plasma radioactivity Tmax values ranged between 1 and 8 hours and were lowest in dogs and humans. Plasma radioactivity exposures based on Cmax and AUC values were highest in mice and lowest in rats.
Mean pharmacokinetic parameters of total radioactivity in mice, rats, dogs, and humans
Metabolite Profiles in Plasma
The recovery of radioactivity in pooled plasma samples from animals and humans after solvent extraction ranged from 82% to 92%. Canagliflozin and metabolites were identified in 0- to 24-hour pooled plasma samples from animals and humans (Table 3). For animals, overall plasma pools were used as a result of the limited sample volumes from individual time points. To facilitate species comparison, human plasma values were derived from radiochromatograms and generated by Hamilton pooling of the pooled individual time-point plasma samples (Hamilton et al., 1981). The proportion of plasma TR attributed to canagliflozin was 94% to 99% in animals and 62% in humans. M5 and M7, direct O-glucuronide metabolites of canagliflozin, and M9, hydroxylated canagliflozin, represented ∼19%, 14%, and 3% of human plasma TR, respectively. M7 and M9 in mouse plasma accounted for ≤3% of TR. No circulatory metabolites were detected in rats and dogs. M5 was not detected in animal plasma at the administered [14C]canagliflozin doses used in these studies. Radiochromatograms with metabolite peaks in mouse and human plasma are shown in Fig. 2.
Relative distribution of metabolites in pooled plasma from mice, rats, dogs, and humans after oral administration of [14C]canagliflozin

Liquid chromatography-radiochromatograms of canagliflozin and metabolites in plasma of male mice (A) and humans (B). Administered doses are shown in Table 3.
In the human study, blood samples were taken from 1.5 to 24 hours after [14C]canagliflozin administration, and plasma pools were created for each time point. As shown in Fig. 3, total radioactivity and canagliflozin were slowly eliminated from plasma during the entire sampling period. Concentrations of M5, M7, and M9 were maximal at 4 hours, and the M5 level declined markedly after 8 hours. None of these metabolites was detectable at 24 hours.

Concentrations of TR, canagliflozin, and its metabolites in pooled human plasma samples after a single oral administration of 188 mg of [14C]canagliflozin to healthy human subjects. Percentages of unchanged drug and metabolites in plasma samples from the mass-balance study were converted to concentrations (ng-base eq/ml) using a specific activity of 7.72 KBq/mg (463.2 dpm/μg). TR in plasma was quantified by LSC.
The human plasma concentration-time data were used to calculate systemic exposure for TR, canagliflozin, and its metabolites (Table 4). Relative to TR, unchanged drug is the major circulating component. Systemic exposures for M5 and M7 exceeded 10% of TR and are thus considered major human circulating metabolites. M9 can be classified as a minor human metabolite because its systemic exposure was only 2% of TR.
Systemic exposure to total radioactivity, canagliflozin and its metabolites in plasma of human subjects following oral administration of [14C]canagliflozin
Metabolite Profiles in Urine
As summarized in Table 5, urinary excretion was a minor elimination pathway for canagliflozin and metabolites in mice, rats, dogs, and humans. Representative radiochromatograms are shown in Fig. 4. Unchanged drug represented anywhere from 0.2% to 0.3% of the administered dose in animals. The only components detected in human urine were M5 and M7, representing 14% and 18% of the administered radioactive dose. The amount of M5 and M7 excreted in mouse urine was low, but these metabolites were not detected in rat and dog urine. Urinary metabolites representing <5% of the dose included O-glucuronides of mono-oxygenated unchanged drug (M1, M2) in mice, a dioxygenated metabolite (M4) in mice and dogs, a carboxy metabolite (M6) in rats, and hydroxylated metabolites (M8, M9) in mice, rats, and dogs.
Relative distribution of metabolites in urine from mice, rats, dogs, and humans after oral administration of [14C]canagliflozin
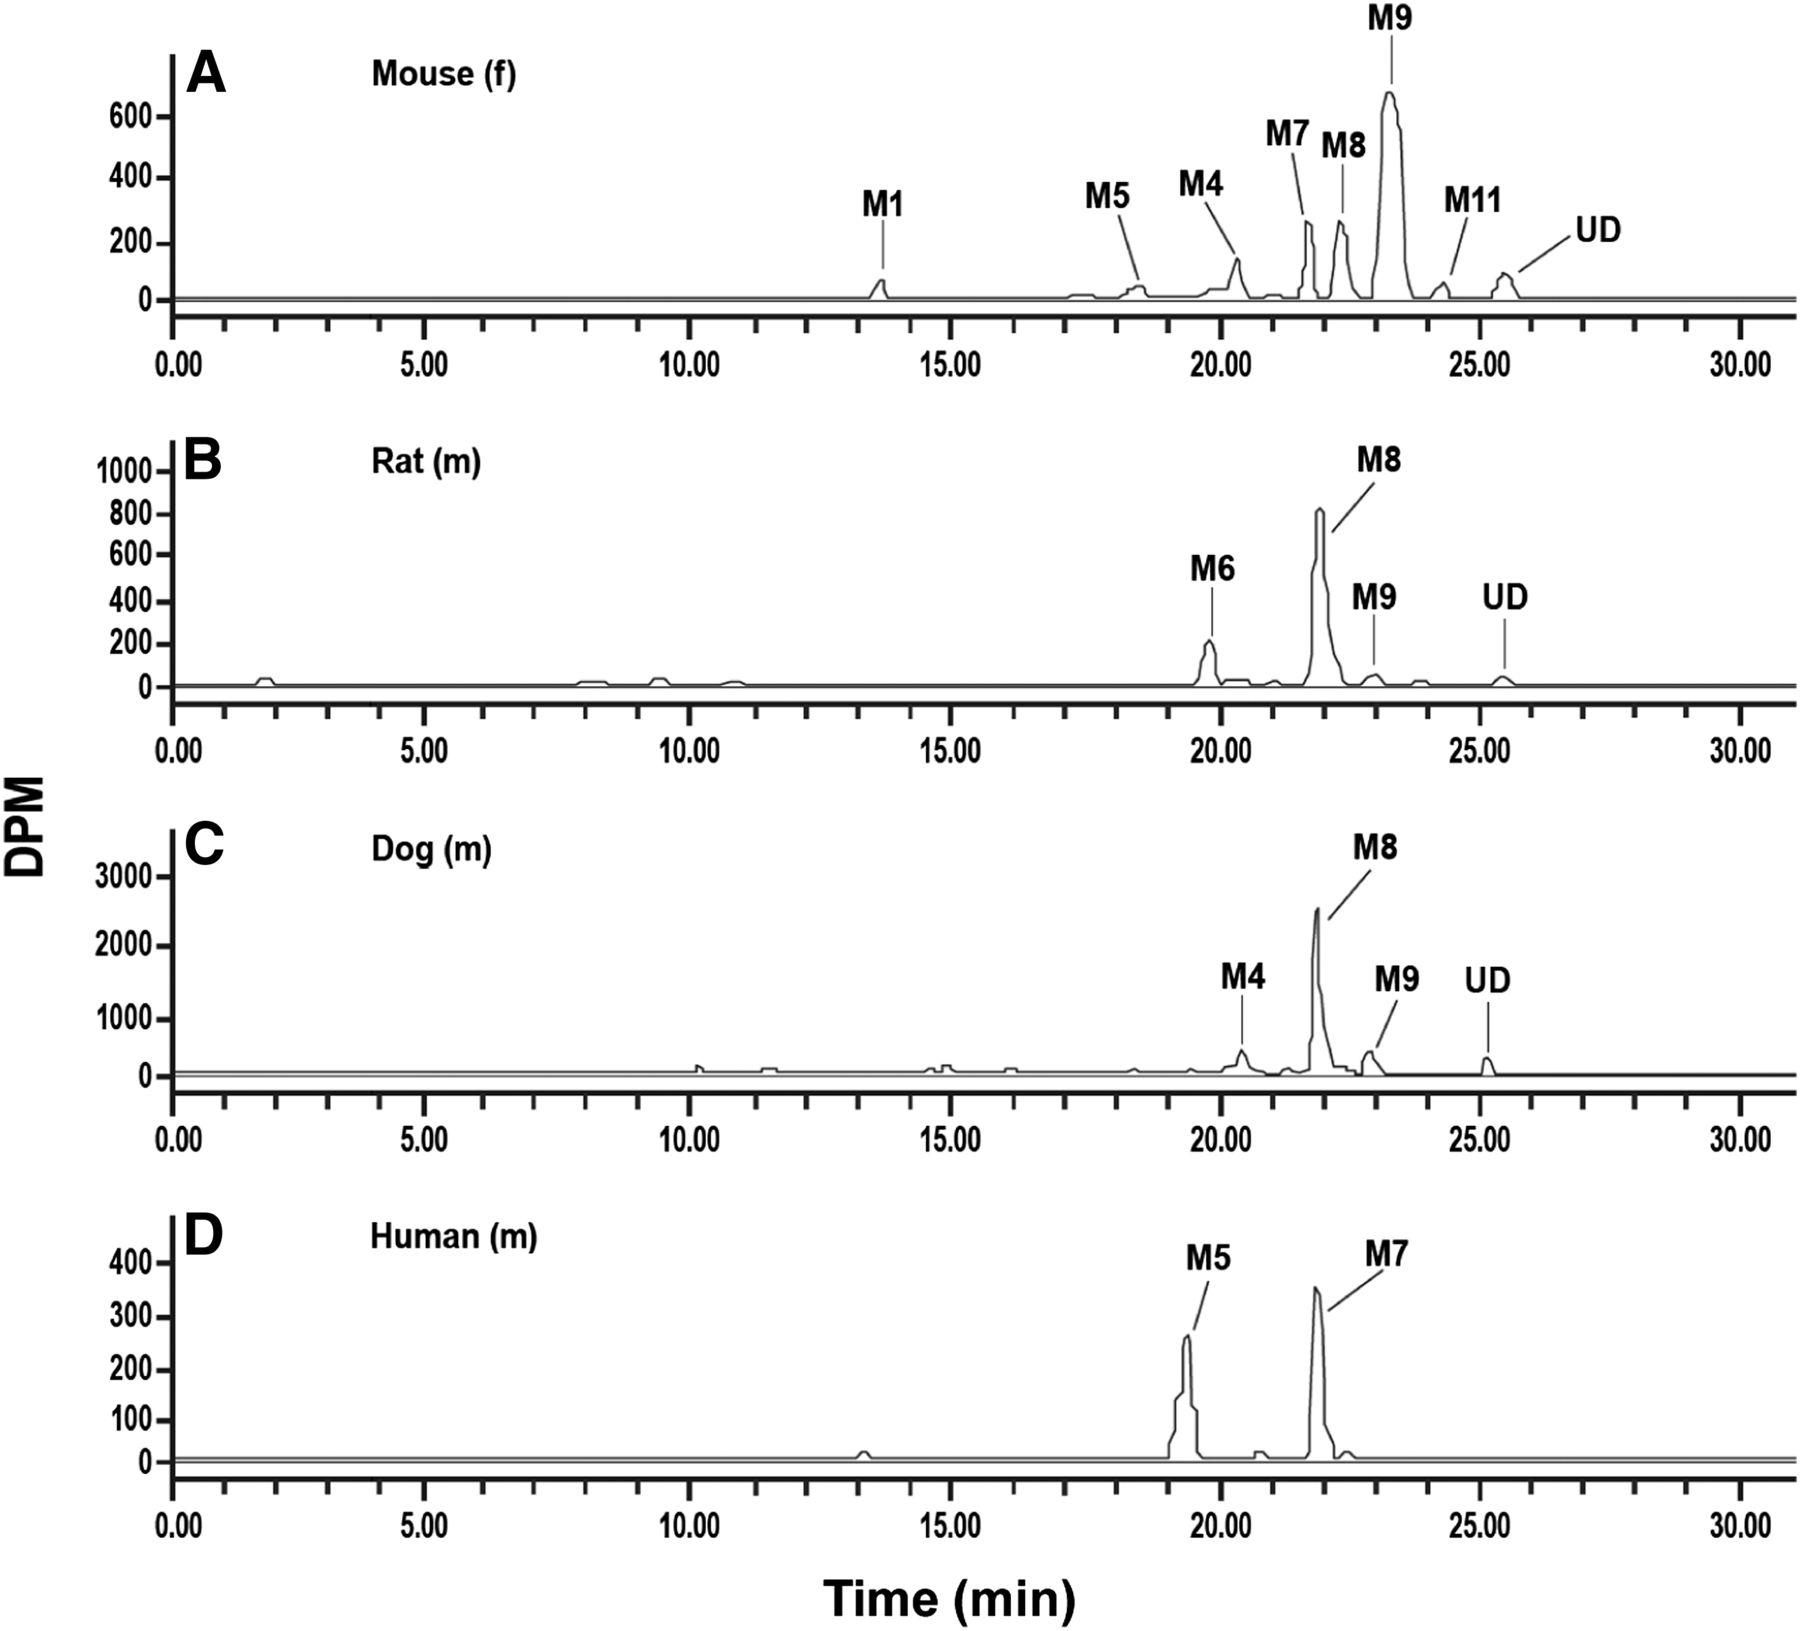
Liquid chromatography-radiochromatograms of canagliflozin and metabolites in urine of female mice (A) and in male rats (B), dogs (C), and humans (D). Administered doses are shown in Table 3.
Metabolite Profiles in Feces
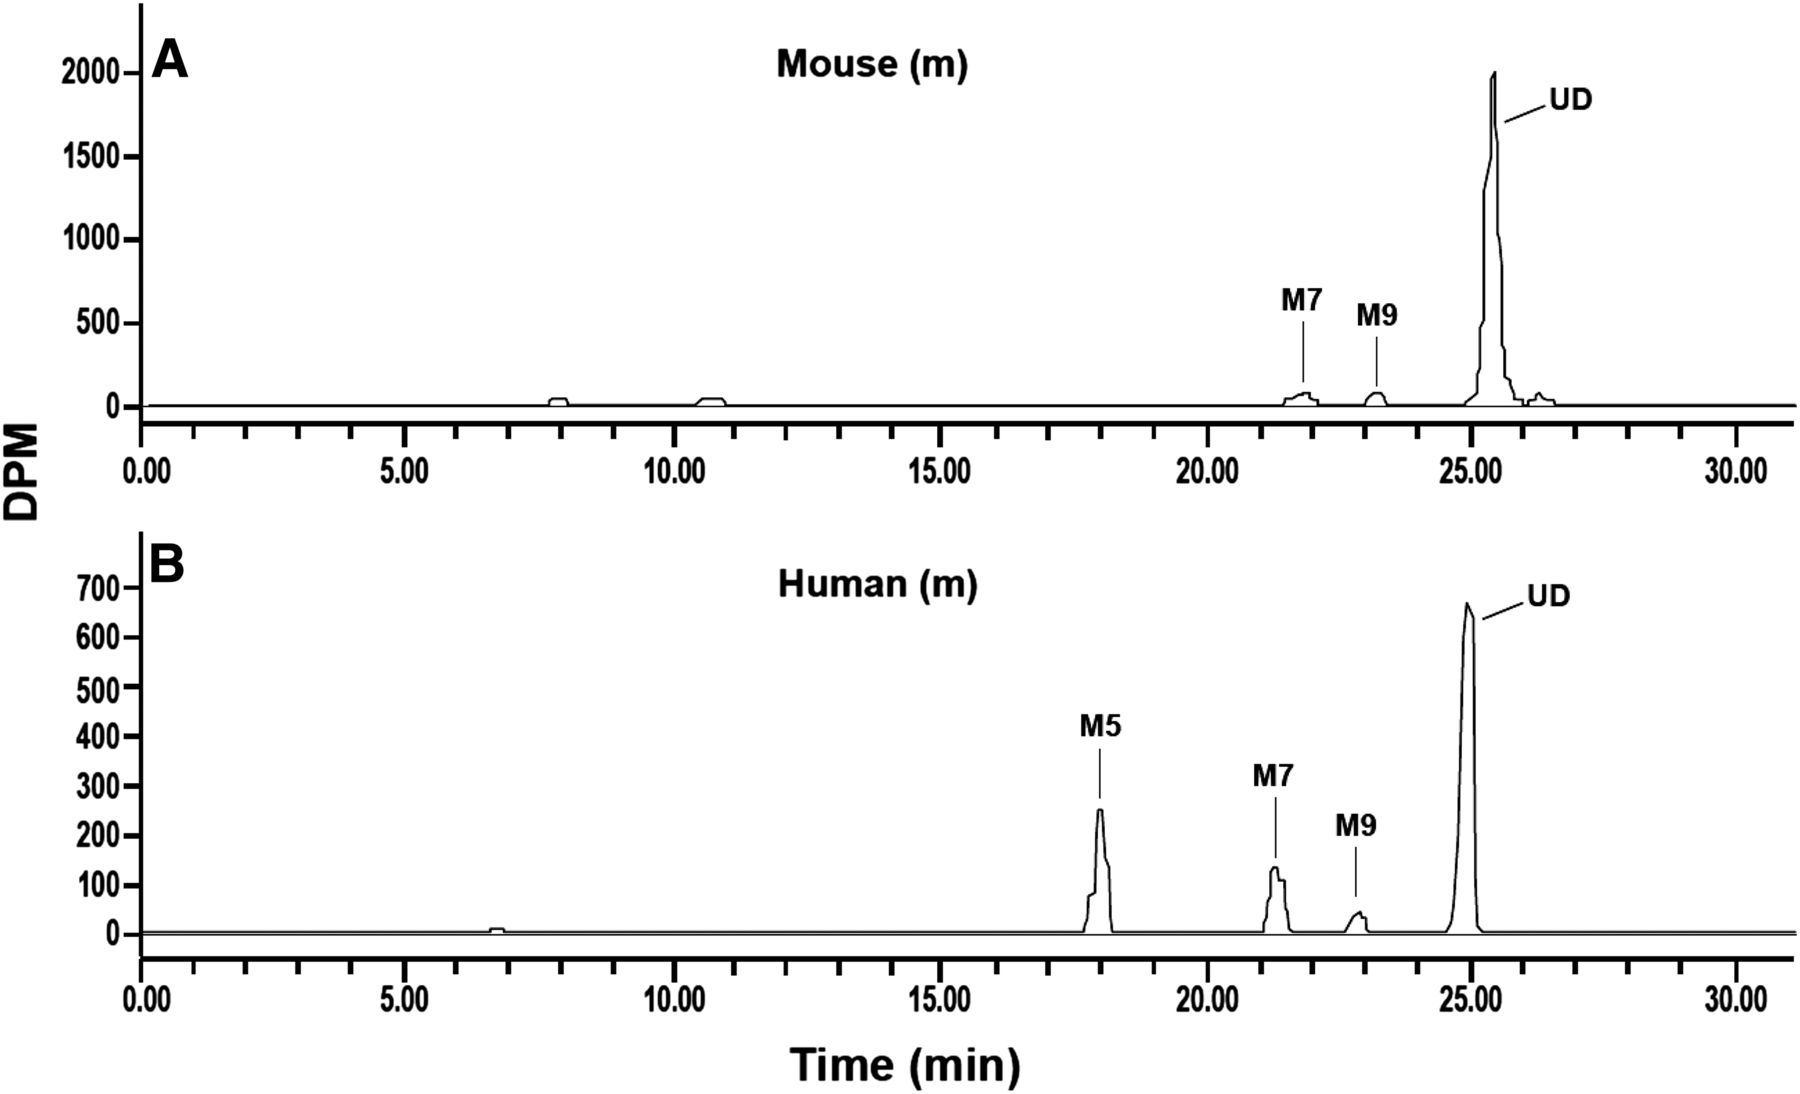
Overall pools of fecal methanol-water extracts created from samples collected during the first 2 or 3 days represented at least 95% of the radioactivity recovered during the entire collection period. Representative radiochromatograms of fecal samples from mice, rats, dogs, and humans after oral administration of [14C]canagliflozin are shown in Fig. 5. As shown in Table 6, fecal excretion was the primary elimination route of canagliflozin and its metabolites in animals. Canagliflozin accounted for 3.5% to 11% of the administered radioactivity dose in feces from female mice, rats, and dogs and 33% of the dose in male mice. Metabolite M8 was most abundant in rat and dog feces, accounting for 42% to 59% of the dose, and M9 was most abundant in mouse feces, representing 28% to 29% of the dose. M7 was a fecal metabolite in male and female mice and in dogs, where it represented, respectively, 6% ,14%, and 7% of the dose. Other fecal metabolites were M1 in rat, M4 in mouse and dog, M5 in mouse, M6 in mice and rats, and M10 in rat. In human feces, unchanged drug was the major component, representing 39% of the dose, and M7 and M9 occurred as minor metabolites at 2% and 8% of the dose.

Liquid chromatography-radiochromatograms of canagliflozin and its metabolites in feces of female mice (A) and in male rats (B), dogs (C), and humans (D). Administered doses are shown in Table 3.
Relative distribution of metabolites in feces and bile from mice, rats, dogs, and humans after oral administration of [14C]canagliflozin
Metabolite Profiles in Bile
Distribution of metabolites of pooled bile samples from mice and rats are shown in Table 6. In BDC mice administered 100 mg/kg of [14C]canagliflozin, M7 was the major biliary metabolite identified in the 0- to 24-hour bile pool, representing 37% of the administered dose. Unchanged drug and M8 accounted for 4% and 7% of the administered dose. M1 and M2 were only detected by MS.
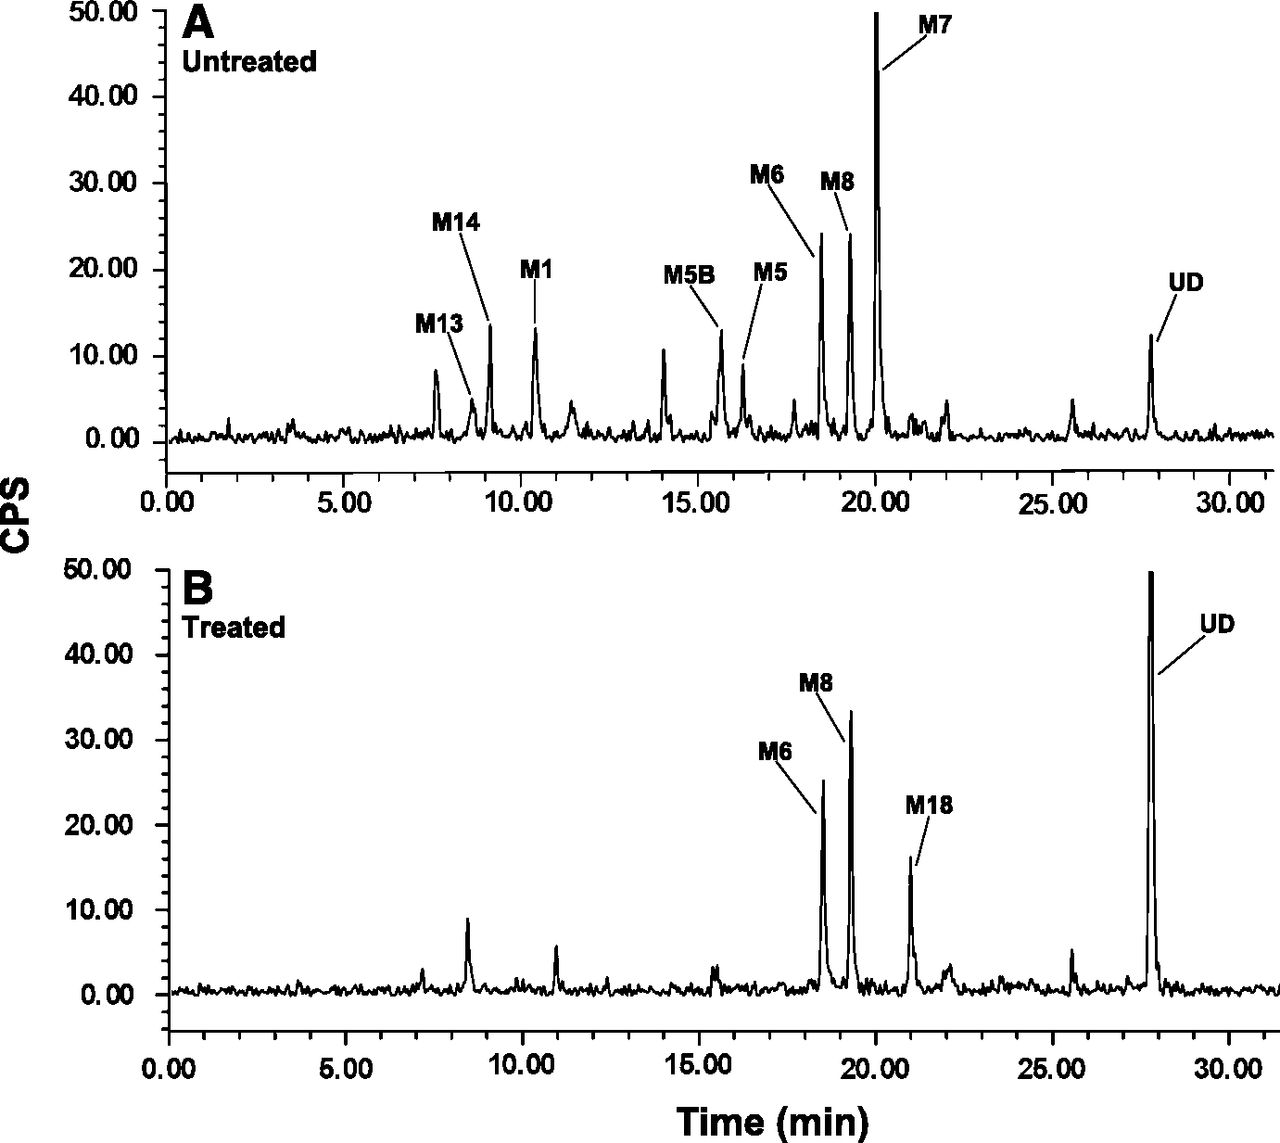
In 24-hour bile collections from rats that received a single dose of 3 mg/kg [14C]canagliflozin, the predominant metabolites in bile, each accounting for ∼4%–12% of the administered dose, were M5, M6, M7, and M8. Less prominent metabolites (< 3% of administered dose) included the O-glucuronide M5B, oxidative metabolites M12, M18, and M19 and oxidative metabolites that underwent glucuronidation (M1, M13, M14, M15, M16). Unchanged drug accounted for approximately 2% of the dose. Rat bile collected over an 8-hour period was left untreated or mixed with β-glucuronidase/arylsulfatase in vitro to determine the metabolites susceptible to enzymatic hydrolysis. Radiochromatogram peaks corresponding to O-glucuronide metabolites M1, M5, M5B, M7, M13, and M14 in untreated bile samples (Fig. 6A) disappeared in the enzyme-treated bile samples, whereas peak areas increased for the aglycones corresponding to canagliflozin, M8, and M18 (Fig. 6B). These results suggest that M1, M5, M5B, M7, M13, and M14 are O-glucuronide metabolites.

Liquid chromatography-radiochromatograms of canagliflozin and metabolites in untreated rat bile (A) or after in vitro treatment of rat bile with β-glucuronidase/arylsulfatase (B). The administered dose is shown in Table 6.
Identification of Metabolites by LC-MS/MS
Canagliflozin and its metabolites were initially detected by LC radioprofiling with subsequent structure elucidation using unit resolution multiple-stage MS analyses. Product ions from multiple-stage mass analysis were used to elucidate the site of biotransformation based on mass shift of the ammonium adduct and its product ions from those derived from canagliflozin. Therefore, high-resolution accurate mass measurement of canagliflozin by LTQ/Orbitrap was conducted to confirm assignment of its product ions from unit mass resolution. These results were used to bridge and facilitate the assignment of product ions from each metabolite.
The ammonium adducts, diagnostic product ions, biotransformation pathways, and detection in species investigated of canagliflozin and its metabolites are tabulated in Table 7. The identity of a metabolite was confirmed by either cochromatography with reference standard or by one- or two-dimensional NMR analysis. Details of the structural elucidation of canagliflozin and its metabolites by multiple-stage MS analyses are described in the following sections of this article. The proposed structures of detected metabolites were used to postulate the in vivo metabolic pathways for canagliflozin in mice, rats, dogs, and humans (Fig. 7). Mass spectra of unchanged drug and major animal and human metabolites are shown in Figs. 8, 9, and10.
Mass spectral analysis of canagliflozin metabolites in mice, rats, dogs, and humans

Proposed in vivo metabolic pathways for canagliflozin in mice, rats, dogs, and humans.

Accurate mass full scan (A) and product ion mass spectra (B) of canagliflozin.
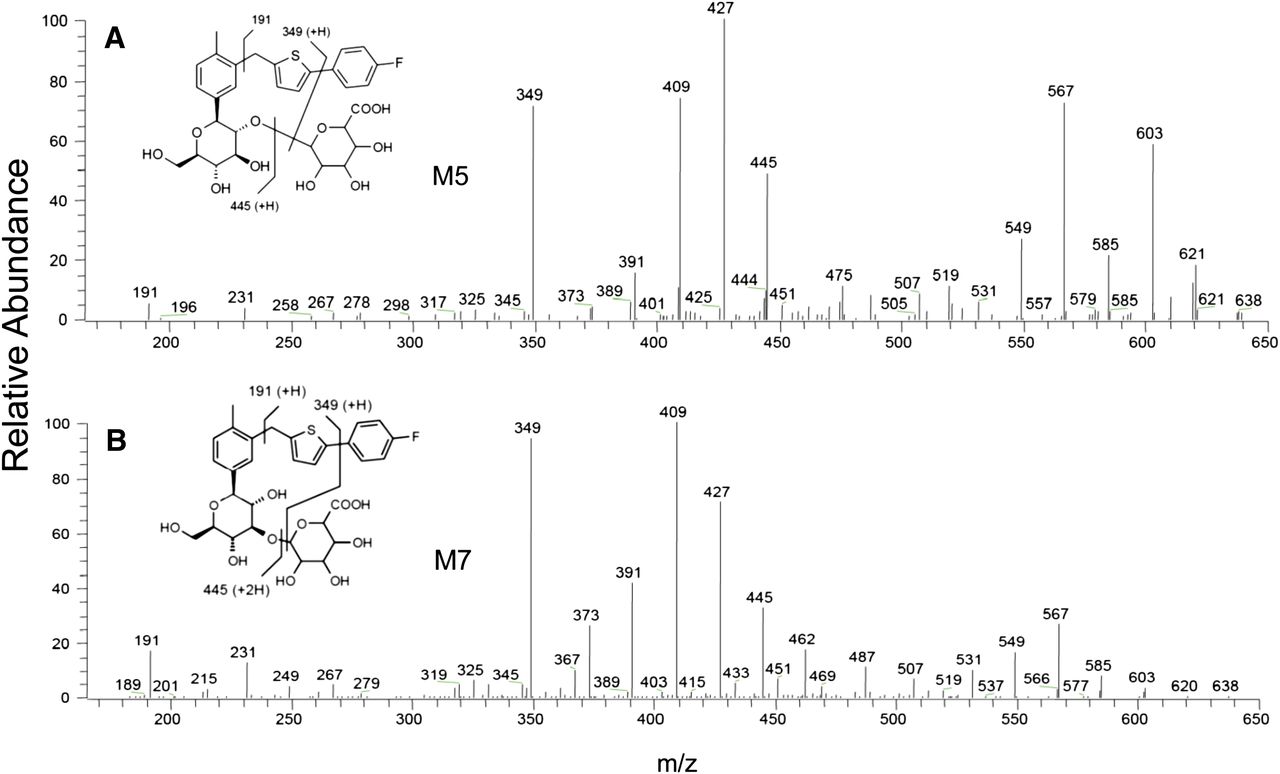
Product ion mass spectra of M5 (A) and M7 (B).
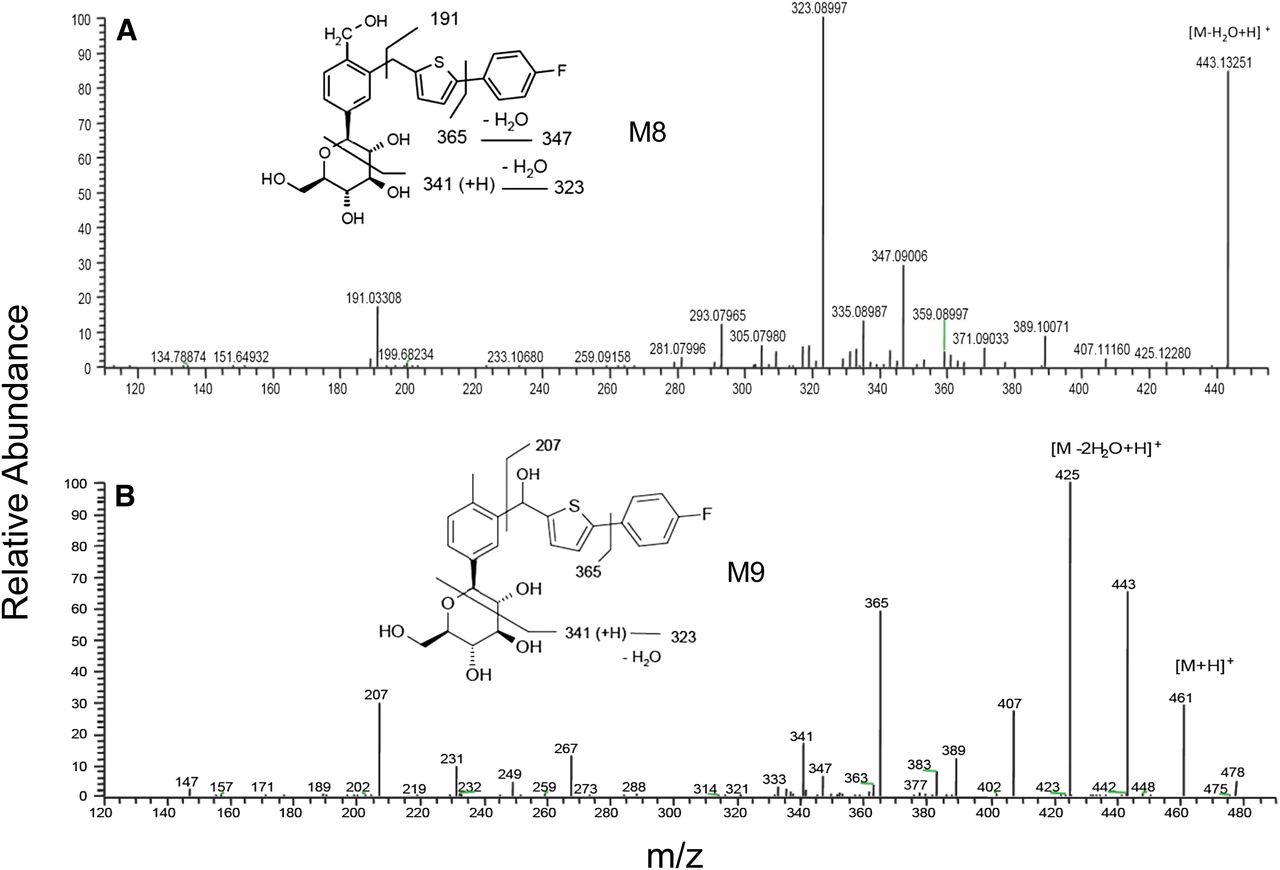
Product ion mass spectra of M8 (A) and M9 (B).
Canagliflozin.
The accurate full scan and product ion mass spectra of canagliflozin are shown in Fig. 8. Full-scan mass analysis gave an ammonium adduct [M + NH4]+ instead of protonated molecule of canagliflozin at m/z 462 (462.17450, C24H29O5NFS, 10.5 RDB, 0.00 ppm), which is commonly observed with electrospray ionization of neutral compound. Collision-induced dissociation of [M + NH4]+ at m/z 462 gave product ion at m/z 445 (445.14838, C24H26O5NFS, 11.5 RDB, 0.97 ppm) from loss of NH3, which further undergoes sequential loss of H2O to form ions at m/z 427 (427.13745, C24H24O4NFS, 12.5 RDB, 0.15 ppm), 409 (409.12717, C24H22O3NFS, 13.5 RDB, 0.86 ppm), 391 (391.11655, C24H20O2NFS, 14.5 RDB, 0.29 ppm), and 373 (373.10547, C24H18ONFS, 15.5 RDB, −0.59 ppm). Product ions at m/z 367 (367.11600, C22H20O2FS, 12.5 RDB, −0.70 ppm), 349 (349.10559, C22H18OFS, 13.5 RDB, −0.29 ppm), and 325 (325.10562, C20H18OFS, 11.5 RDB, −0.22 ppm) were postulated to derive from cleavage of the 6-(hydroxymethyl)tetrahydro-2H-pyran-3,4,5-triol moiety based on chemical formulae from accurate mass measurements (see insert structure). Two product ions at m/z 267 (267.12268, C14H19O5, 5.5 RDB, −0.08 ppm) and 191 (191.03255, C11H8FS, 7.5 RDB, 0.13 ppm) from cleavage of bond linking benzylic carbon and thiophene moiety and bond linking benzylic carbon and 4-methylphenyl moiety, respectively, are useful in the localization of the site of biotransformation. The product ion at m/z 267 undergoes sequential losses of H2O to form ions at m/z 249 (249.11197, C14H17O4, 6.5 RDB, −0.66 ppm) and 231 (231.10150, C14H15O3, 7.5 RDB, −0.31 ppm). Alternatively, the product ion at m/z 267 undergoes cleavage of the 6-(hydroxymethyl)tetrahydro-2H-pyran-3,4,5-triol moiety to form ions at m/z 171 (171.08018, C12H11O, 7.5 RDB, −1.53 ppm) and 147 (147.08009, C10H11O, 5.5 RDB, −2.39 ppm).
Metabolite M1.
The [M+NH4]+ of M1 at m/z 654 was 192 Da higher than that of canagliflozin, which corresponded to addition of an oxygen atom and a glucuronide moiety to canagliflozin. This was supported by loss of 176 Da to form the [M + NH4]+ of the aglycone of M1 at m/z 478. The diagnostic product ions at m/z 347, 323, and 191 localized the addition of the oxygen atom likely to the 1-ethyl-4-methylbenzene moiety of canagliflozin. The product ions at m/z 347 and 323 were speculated to correspond to addition of an oxygen atom and followed by loss of a water molecule from product ion of canagliflozin at m/z 349 and 325, respectively. Hence, M1 was assigned the structure of a glucuronide conjugate of a hydroxylated metabolite of canagliflozin.
Metabolite M2.
M2 had an identical ammonium adduct and product ions as the metabolite M1, which suggested that M2 was an isomer of metabolite M1. Thus, M2 was identified as another glucuronide conjugate of a hydroxylated metabolite of canagliflozin.
Metabolite M4.
The ammonium adduct of M4 was 32 Da higher than that of canagliflozin, suggesting that M4 resulted from addition of two oxygen atoms. The addition of 32 Da to the product ion of canagliflozin at m/z 325, followed by the sequential loss of a water molecule, gave product ions of M4 at m/z 339 and 321, respectively. This, together with the product ion at m/z 191, infers that that the two additional oxygen atoms are localized to the 1-ethyl-4-methylbenzene moiety of canagliflozin.
Metabolite M5.
The ammonium adduct of metabolite M5 displayed a higher mass shift of 176 Da from the corresponding ion of canagliflozin. This mass shift was consistent with a direct ether glucuronide conjugate of canagliflozin and was supported by detection of the ammonium adduct of the aglycone at m/z 462, which was identical to the ammonium adduct of canagliflozin. Also, the product ion mass spectra contained many of the diagnostic product ions of canagliflozin at m/z 445, 427, 409, 391, 373, 349, 325, 267, and 191 (Fig. 9A). NMR analysis of M5 isolated from human urine demonstrated that attachment of the glucuronide moiety was at the 2′ of 2-hydroxymethyl-tetrahydropyrantriol moiety (Supplemental Fig. 2; Supplemental Table 1). The metabolite M5 was confirmed by its coelution with reference synthetic standard and good agreement of their product ion mass spectra (data not shown).
Metabolite M6.
M6 had an ammonium adduct at m/z 476 that was 14 Da higher than that of canagliflozin, which was consistent with addition of an oxygen atom and loss of 2 hydrogens. The product ion at m/z 267 from canagliflozin was shifted by 14 Da to form the product ion of M6 at m/z 281, which lost a water molecule to form m/z 263. These ions, together with observation of identical unchanged product ions of canagliflozin at m/z 325, 191, and 147, suggested that the site of biotransformation occurred on the 6-hydroxymethyl group of the 6-(hydroxymethyl)tetrahydro-2H-pyran-3,4,5-triol moiety. Therefore, M6 was assigned the structure of a carboxy metabolite and was confirmed by its coelution with reference synthetic standard and good agreement of their product ion mass spectra (data not shown).
Metabolite M7.
The full scan and product ion mass spectra of metabolite M7 were similar to the mass spectra of M5 (Fig. 9). Therefore, like M5, the metabolite M7 was assigned the structure of an isomeric ether glucuronide of canagliflozin. NMR analysis of M7 isolated from human urine demonstrated that attachment of the glucuronide moiety was at the 3′ of 2-hydroxymethyl-tetrahydropyrantriol moiety (Supplemental Fig. 3; Supplemental Table 1). The metabolite M7 was confirmed by its coelution with reference synthetic standard and good agreement of their product ion mass spectra (data not shown).
Metabolite M8.
M8 displayed an ammonium adduct at m/z 478 that was 16 Da higher than that of canagliflozin and was consistent with the addition of an oxygen atom. The product ion at m/z 323 was postulated to derive from addition of an oxygen atom to the product ion from canagliflozin at m/z 325, followed by loss of a water molecule (Fig. 10A). This ion, together with the product ion at m/z 191, localized the likely addition of an oxygen atom to the 1-ethyl-4-methylbenzene moiety of canagliflozin. As shown by NMR analysis of M8 isolated from rat methanolic feces extract, hydroxylation occurred at the methyl group of the 1-ethyl-4-methyl-benzene moiety of unchanged drug. Hence, M8 was assigned the structure of a hydroxylated metabolite of canagliflozin. The metabolite M8 was confirmed by its coelution with reference synthetic standard and good agreement of their product ion mass spectra (data not shown).
Metabolite M9.
The metabolite M9 was another hydroxylated metabolite of canagliflozin based on the identical ammonium adduct as M8, M18, and M19 at m/z 478. The observed identical product ion from canagliflozin at m/z 267 and the 16-Da higher mass shift of the ion at m/z 191 from canagliflozin to form the product ion at m/z 207 suggested the likely addition of an oxygen atom to (4-fluorophenyl)-thiophene moiety (Fig. 10B). NMR analysis of M9 isolated from mouse feces confirmed that hydroxylation occurred on the benzylic carbon linking methyl-phenyl and thiophene moieties of the unchanged drug (Supplemental Fig. 4; Supplemental Table 1). M9 was confirmed by its coelution with reference synthetic standard and good agreement of their product ion mass spectra (data not shown). The hydroxylation of the prochiral benzylic carbon atom created a chiral center resulted in M9 consisted of diastereomers; however, separation of the diastereomers or the chirality of M9 was not established.
Metabolite M10.
M10 had similar full scan and product ion mass spectra as M8 and is thus likely to be an isomer of M8. Thus, M10 was assigned the structure of a hydroxylated metabolite of canagliflozin and with the oxygen atom likely to be added to the 1-ethyl-4-methylbenzene moiety of canagliflozin.
Metabolite M12.
The ammonium adduct of M12 displayed a higher mass shift of 30 Da from canagliflozin, which was consistent with the addition of two oxygen atoms and loss of two hydrogens from canagliflozin. The product ions at m/z 349 and 325 from canagliflozin were observed to shift by 30 Da higher to form the product ions of M12 at m/z 379 and 355, respectively. The product ion at m/z 323 originated from addition of 30 Da to 2-(2,5-dimethylbenzyl)-5-(4-fluorophenyl)thiophene moiety of canagliflozin. Thus, M12 was assigned the structure from initial dihydroxylation and followed by further oxidation of 1 hydroxyl group to a carbonyl functionality.
Metabolite M13/M14.
M13 and M14 had an ammonium adduct at m/z 654 that was 192 Da higher than that of canagliflozin, and the mass shift of 192 Da corresponded to addition of an oxygen atom and a glucuronide moiety. This was supported by detection of the ammonium adduct of the aglycone at m/z 478, which was 16 Da higher than the corresponding ion from canagliflozin. Detection of the unchanged product ions from canagliflozin at m/z 267, 249, and 231 and the higher16-Da mass shift of the m/z 207 (191 + 16) ion from canagliflozin point to oxidation of the 4-fluorophenyl)-thiophene moiety. However, the exact site of glucuronidation could not be inferred from the product ion mass spectra. M13 and M14 were identified as O-glucuronides of a hydroxylated metabolite of canagliflozin.
Metabolite M15.
M15 showed full-scan and product ion mass spectra similar to those of the isomeric metabolite M14. The product ions from canagliflozin at m/z 267, 249, and 231 were unchanged in M15 and, together with 16-Da higher mass shift of the ion at m/z 191 from canagliflozin to give the product ion at m/z 207, suggested the addition of the oxygen atom to (4-fluorophenyl)-thiophene moiety. Therefore, M15 is another ether glucuronide of a hydroxylated metabolite of canagliflozin, but the site of glucuronidation could not be ascertained.
Metabolite M16.
M16 had an identical ammonium adduct at m/z 654 as M14 and M15, which suggested that M16 is an isomer. The product ion at m/z 207 was speculated to derive from 16-Da higher mass shift of the product ion from canagliflozin at m/z 191; therefore, the addition of an oxygen atom was localized to (4-fluorophenyl)- thiophene moiety. Thus, M16 was assigned as another isomeric glucuronide conjugate of a hydroxylated metabolite with an uncertain site of glucuronidation.
Metabolite M17.
The ammonium adduct of M17 was detected at m/z 638, which was identical to that of M5 and M7. The observed ammonium adduct of the aglycone at m/z 462, together with the diagnostic product ions at m/z 567 (391 + 176), 549 (379 + 176), 531 (549 − H2O), 462 (ammonium adduct parent drug), 427, 409, 391, 373, 349, 325, 267, 231, and 191 from collision-induced dissociation, suggested that M17 is an isomeric ether glucuronide conjugate of canagliflozin. The site of glucuronidation cannot be established from MS data.
Metabolite M18.
The ammonium adduct of metabolite M18 was observed at m/z 478, and the 16-Da higher mass shift from canagliflozin was consistent with addition of an oxygen atom. The unchanged product ion from canagliflozin at m/z 267, together with 16-Da higher mass shift of the ion at m/z 191 from canagliflozin to form product ion at m/z 207, suggested the addition of an oxygen atom to the (4-fluorophenyl)-thiophene moiety. M18 was therefore assigned the structure of a hydroxylated metabolite and with the site of hydroxylation localized to (4-fluorophenyl)-thiophene moiety.
Metabolite M19.
M19 showed an ammonium adduct at m/z 478 that was 16 Da higher than that of canagliflozin and was consistent with addition of an oxygen atom. The product ion at m/z 323 can be explained by a water loss from the oxidized canagliflozin product ion at m/z 325. This ion, together with the unchanged product ion at m/z 191, indicating that the 2-(4-fluorophenyl)methylthiophene moiety is unchanged, points to oxidation of the 1-ethyl-4-methylbenzene moiety of canagliflozin. Hence, M19 was assigned the structure of a hydroxylated metabolite of canagliflozin and probably an isomer of M8.
In Vitro Pharmacologic Activity
Metabolites M5 and M7 were tested separately for potential inhibitory activity on substrate uptake by human SGLT2 expressed in Chinese hamster ovary K1 cells. Canagliflozin was included as a positive control in each assay. The IC50 values for canagliflozin and M5 were 1.3 nM and 1014 nM, respectively, and for canagliflozin and M7, these values were 7.3 nM and 5900 nM, respectively. M5 and M7 are each 800-fold less potent than canagliflozin and are considered pharmacologically inactive.
Discussion
In this study, the excretion and biotransformation of canagliflozin after a single oral administration of [14C]canagliflozin were investigated in mice, rats, dogs, and humans. Canagliflozin was well tolerated at the doses used in the metabolism and excretion studies in mice, rats, dogs, and at the dose given to normal healthy subjects during the mass-balance study.
Mass balance for orally administered [14C]canagliflozin was achieved based on a range of 93% to 99% recovery of total radioactivity from excreta of intact animals and humans (Beumer et al., 2006). In human subjects, the proportion of TR eliminated into urine (33%) surpassed that of animal species (2%–7%). Most (i.e., 89%–94%) of the administered radioactive dose in animals was excreted in feces, and a substantial amount of TR (60%) in humans was recovered in feces.
Liquid chromatography with radioactivity detection and MS/MS analysis of fecal, urine, and bile samples indicated that canagliflozin was converted to a number of metabolites. The proposed in vivo biotransformation pathways for canagliflozin are shown in Fig. 7. Oxidative metabolism and glucuronidation are the proposed in vivo metabolic pathways of canagliflozin in animal species and humans.
Unchanged drug was the major circulating component in all species investigated. The O-glucuronides M5 and M7 were the major circulatory metabolites in humans, and M9, an oxidative product, was a minor metabolite. In comparison, there was low abundance of M5, M7, and M9 in mouse plasma, and no circulatory metabolites were detected in rats and dogs. The absence of or low abundance of circulatory metabolites in animal species is consistent with their elimination primarily by the biliary/fecal route.
Canagliflozin is extensively metabolized in animals. Metabolites and unchanged drug represented 53%–88% and ∼4%–33%, respectively, of the total radioactive dose recovered in mouse, rat, and dog feces. Oxidative metabolism as the primary mode of biotransformation in animal species is supported by the high abundance of hydroxylated metabolites M8 and M9 in excreta, where together they accounted for 41%–70% of the administered radioactive dose. The other metabolites were those formed by oxidation (M4, M6, and M10) and a combination of oxidation followed by glucuronidation (M1 and M2). The presence of M5 and M7 in mouse feces and M7 in dog feces indicates that direct O-glucuronidation of canagliflozin occurs in animals. The minor metabolites M1 and M2 are postulated to be O-glucuronide isomers of M8.
In humans, canagliflozin is less extensively metabolized than in animal species. M5, M7, and M9 were the only human metabolites identified, and these were detected in at least one animal species used in canagliflozin safety assessments. The presence of M5 and M7 as major metabolites in plasma and urine demonstrates that O-glucuronidation is the primary biotransformation pathway in humans. Unlike animal species, oxidative metabolism is considered a minor metabolic pathway in humans because of the low abundance of M9 in feces. Results from a reaction phenotyping study with recombinant human cytochrome P450 or UGT enzymes suggested that CYP3A4 metabolizes canagliflozin to M9, and UGT1A9 and UGT2B4 metabolizes cangliflozin to M7 and M5, respectively (unpublished results).
Studies in BDC mice and rats showed that a large portion of radioactivity from administered [14C]canagliflozin is excreted into bile, amounting to approximately 50% of the dose in each species. M7 was the main metabolite found in mouse and rat bile. Other metabolites detected in rat bile included direct O-glucuronide conjugates (M5, M5B), minor oxidative metabolites (M12, M18, and M19), and oxidative metabolites that further underwent glucuronidation (M1, M13, M14, M15, M16). Results from the analysis of bile samples treated with β-glucuronidase substantiated that M1, M5, M5B, M7, M13, and M14 were glucuronide conjugates. Based on the hydrolysis experiment and MS analysis of bile samples, it was confirmed that M13, M14, and M1 are glucuronide conjugates of M8, M18, and M8 respectively. However, the position of glucuronidation on M8 or M18 could not be confirmed.
The high abundance of canagliflozin in feces from male mice (33%) and humans (39%) is consistent with the aglycone arising from enzymatic hydrolysis of glucuronide metabolites in the gastrointestinal tract. The primary source of fecal canagliflozin appears to be M7 since it represented 37% of the dose excreted in bile of male mice but amounted to only 6% of the dose in feces of intact male mice. Similarly, the percentage of M7 in human feces was low (2%). Hydrolysis of glucuronides in the gastrointestinal tract was supported by an experiment with mouse and human fecal aqueous homogenates. When M5 and M7 were incubated in vitro with the fecal preparations, they were rapidly hydrolyzed to canagliflozin, presumably by gut microflora glucuronidases (unpublished results).
The pooled plasma metabolite profiles for different species allow for direct comparison of the extent of systemic exposures to drug-related components at well-tolerated dose levels. After [14C]canagliflozin was orally administered, the percentage of sample radioactivity representing unchanged drug was 94% to 98% in 0- to 24-hour pooled plasma samples of animal species. In human plasma samples, the percentage of sample radioactivity attributed to canagliflozin was 45%–66% at 1.5–12 hours and 99% at 24 hours. Components accounting for the remainder of sample radioactivity during the 1.5- to 12-hour period were metabolites M7 (16% –29%), M5 (2%–30%), and a M9 (2%–4%). Among animal species, M7 and M9 were detected only in plasma from mice (about 2%–3%). However, after repeated dosing with 100 mg/kg canagliflozin in chronic mouse, rat, and dog toxicology studies, M5 and M7 were found at quantifiable levels in plasma samples analyzed by LC-MS/MS. Moreover, biliary excretion studies in mouse and rat confirm substantial exposure of liver to M5 and M7; the liver is the primary organ for the metabolism of canagliflozin.
M5 and M7 have been excluded from safety testing because they are 800-fold less potent as SGLT2 inhibitors compared with canagliflozin and are considered pharmacologically inactive. The high percentage excretion of M5 and M7 in human urine is consistent with rapid elimination from the body due to their high water solubility (≥50 mg/ml), whereas canagliflozin is practically insoluble in water (∼0.150 mg/ml).
Nonclinical safety testing of human metabolites is required when circulating levels are significantly greater than the maximum exposure seen in the nonclinical toxicity studies. This rule applies when exposure of the metabolite in plasma is greater than 10% of total drug-related exposure. Some metabolites, such as O-glucuronides, are excluded from safety testing because they are generally pharmacologically inactive and chemically nonreactive in nature (Gao et al., 2013). As discussed already herein, M5 and M7 met these criteria and were therefore excluded from safety testing.
In conclusion, canagliflozin elimination in animals and humans is through biotransformation pathways of oxidation and O-glucuronidation. In animal species, oxidative metabolites of canagliflozin account for most of the drug-related material, and these are eliminated mainly into feces via biliary excretion. In humans, the major circulatory metabolites M5 and M7 are formed by direct O-glucuronidation of canagliflozin and are excreted mainly in urine. However, elimination of M5 and M7 in feces may be underestimated as a result of enzyme-mediated hydrolysis of glucuronides back to parent drug, presumably by microflora in the gastrointestinal tract. All human metabolites were detected in at least one nonclinical species used in the safety assessments of canagliflozin. Although the O-glucuronides M5 and M7 are major human circulating metabolites, their pharmacologic inactivity is consistent with the scientific consensus that such conjugates pose minimal or no safety risk.
Acknowledgments
The authors thank the following from Janssen Pharmaceutical Research & Development; Dr. Gerry Gendimenico for providing editorial assistance with the manuscript; Dr. Geert Mannens for evaluation of radiation exposure; Dr. Yong Gong, Dr. Marteen Vliegen, and Dr. Walter Filliers for synthesis and purification of reference metabolites; and Dr. Yin Liang for testing the pharmacologic activity of canagliflozin and its two glucuronide conjugates.
Authorship Contributions
Participated in research design: Mamidi, Cuyckens, Scheers, Silva, Sha, Kelley, Devineni, Johnson, Lim.
Conducted experiments: Chen, Kalamaridis, Lin, Sha.
Contributed new reagents or analytic tools: Lin, Lim.
Performed data analysis: Mamidi, Cuyckens, Chen, Scheers, Kalamaridis, Lim.
Wrote or contributed to the writing of the manuscript: Mamidi, Cuyckens, Scheers, Evans, Kelley, Devineni, Johnson, Lim.
Footnotes
- Received December 11, 2013.
- Accepted February 25, 2014.
↵
 This article has supplemental material available at dmd.aspetjournals.org.

Abbreviations
- AUC
- area under the plasma concentration-time curve
- BDC
- bile duct-cannulated
- Cmax
- maximum plasma concentration
- HPLC
- high-performance liquid chromatography
- LSC
- liquid scintillation counting
- MS
- mass spectrometry
- MS/MS
- tandem mass spectrometry
- NMR
- nuclear magnetic resonance
- RDB
- rings plus double bonds
- SGLT2
- sodium glucose cotransporter 2
- Sv
- Sievert
- T2DM
- type 2 diabetes mellitus
- Tmax
- time to reach the maximum plasma concentration
- TR
- total radioactivity
- UHPLC
- ultrahigh-performance liquid chromatography
- Copyright © 2014 by The American Society for Pharmacology and Experimental Therapeutics


