


Abstract
Data from the clinical absolute bioavailability (F) study with cobimetinib suggested that F was lower than predicted based on its low hepatic extraction and good absorption. The CYP3A4 transgenic (Tg) mouse model with differential expression of CYP3A4 in the liver (Cyp3a−/−Tg-3A4Hep) or intestine (Cyp3a−/−Tg-3A4Int) and both liver and intestine (Cyp3a−/−Tg-3A4Hep/Int) were used to study the contribution of intestinal metabolism to the F of cobimetinib. In addition, the effect of CYP3A4 inhibition and induction on cobimetinib exposures was tested in the Cyp3a−/−Tg-3A4Hep/Int and PXR-CAR-CYP3A4/CYP3A7 mouse models, respectively. After i.v. administration of 1 mg/kg cobimetinib to wild-type [(WT) FVB], Cyp3a−/−Tg-3A4Hep, Cyp3a−/−Tg-3A4Int, or Cyp3a−/−Tg-3A4Hep/Int mice, clearance (CL) (26-35 ml/min/kg) was similar in the CYP3A4 transgenic and WT mice. After oral administration of 5 mg/kg cobimetinib, the area under the curve (AUC) values of cobimetinib in WT, Cyp3a−/−Tg-3A4Hep, Cyp3a−/−Tg-3A4Int, or Cyp3a−/−Tg-3A4Hep/Int mice were 1.35, 3.39, 1.04, and 0.701 μM⋅h, respectively. The approximately 80% lower AUC of cobimetinib in transgenic mice when intestinal CYP3A4 was present suggested that the intestinal first pass contributed to the oral CL of cobimetinib. Oxidative metabolites observed in human circulation were also observed in the transgenic mice. In drug-drug interaction (DDI) studies using Cyp3a−/−Tg-3A4Hep/Int mice, 8- and 4-fold increases in oral and i.v. cobimetinib exposure, respectively, were observed with itraconazole co-administration. In PXR-CAR-CYP3A4/CYP3A7 mice, rifampin induction decreased cobimetinib oral exposure by approximately 80%. Collectively, these data support the conclusion that CYP3A4 intestinal metabolism contributes to the oral disposition of cobimetinib and suggest that under certain circumstances the transgenic model may be useful in predicting clinical DDIs.
Introduction
Cobimetinib ((S)-[3,4-difluoro-2-(2-fluoro-4-iodophenylamino)phenyl] [3-hydroxy-3-(piperidin-2-yl)azetidin-1-yl]methanone hemifumarate; Figure 1A) is a MEK inhibitor currently being tested in multiple combinations, including a completed phase 3 clinical trial in combination with vemurafenib, in patients with metastatic melanoma (Larkin et al., 2014). The pharmacokinetics (PKs) of cobimetinib has been well characterized in clinical pharmacology studies in healthy subjects (Musib et al., 2013). Cobimetinib undergoes low clearance (CL) (11.7 l/h), is well absorbed [fraction absorbed (Fa) approximately 88%; estimated from the sum of radioactivity recovered in urine (17.8%) and radioactivity in feces that was characterized as metabolites (69.9%)], and has an absolute bioavailability (F) of 45% (Musib et al., 2013). Clinical data from the absolute F study suggests that intestinal first pass metabolism may play a role in decreasing the F of cobimetinib. Indeed, analysis of the data from the absolute F study with knowledge of the Fa value, suggested that the estimated fraction escaping intestinal first pass metabolism/extraction (Fg) of cobimetinib correlates to F, whereas there was no correlation between fraction escaping hepatic extraction (Fh) (American Society of Clinical Pharmacology and Therapeutics Annual Conference, Atlanta, GA, 2014). Consistent with this finding, data from recombinant enzymes and chemical inhibition studies in microsomes showed that cobimetinib was metabolized by CYP3A4/5 and UGT2B7 (data on file), enzymes known to be expressed in the intestine (Shen et al., 1997; Ritter, 2007; Rowland et al., 2013).
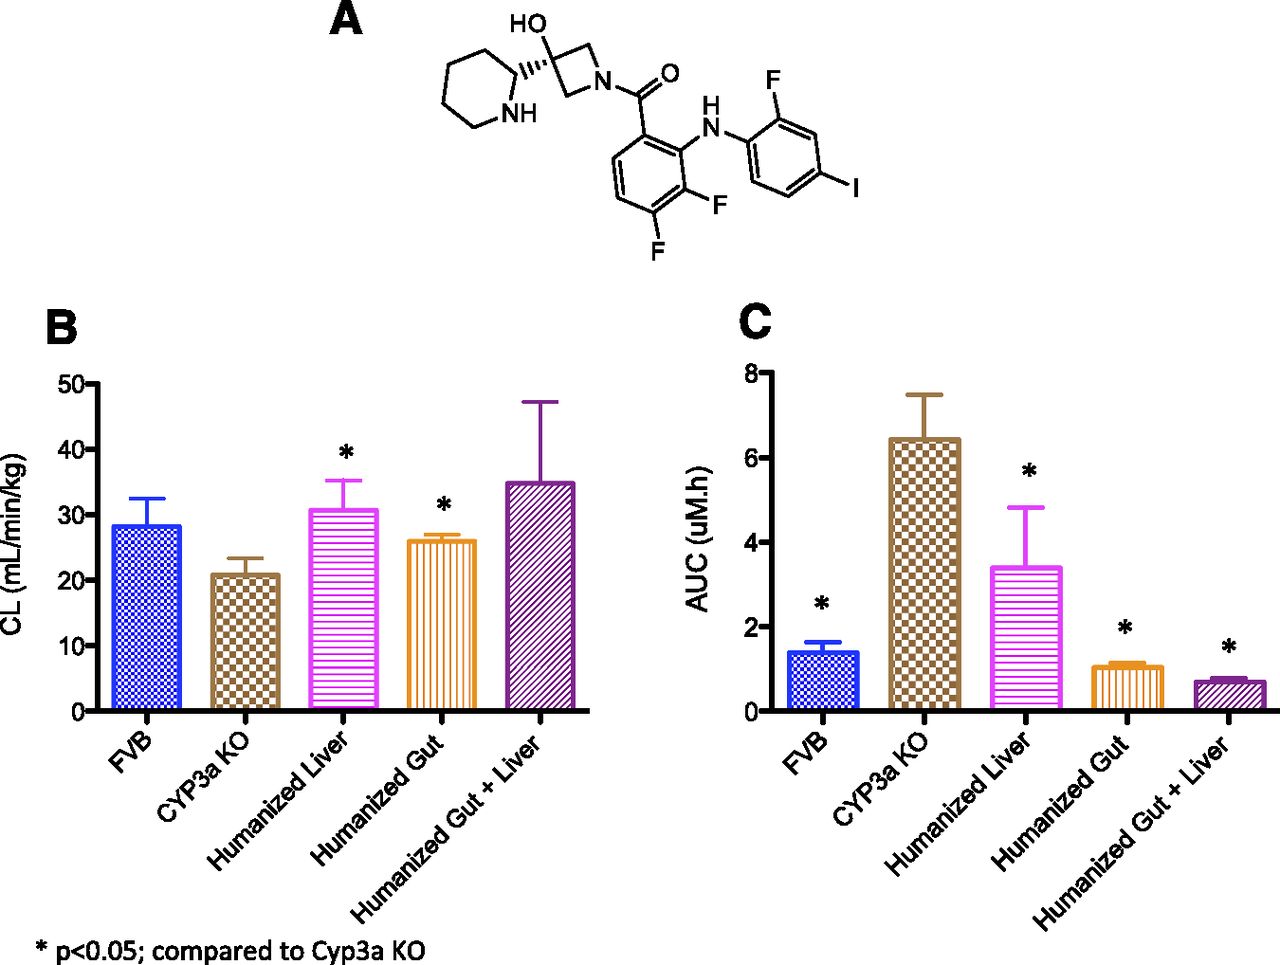
(A) Chemical structure of cobimetinib; (B) comparison of cobimetinib CL (mean ± S.D.; n = 3–6) after i.v. administration; and (C) oral exposures (AUC; mean ± S.D., n = 3–6) of cobimetinib in FVB (WT), Cyp3a KO, Cyp3a−/−Tg-3A4Hep, Cyp3a−/−Tg-3A4Int, or Cyp3a−/−Tg-3A4Hep/Int mice.
The differences in metabolizing enzyme specificity and regulation limit the use of animal models in directly predicting metabolism/disposition in humans (Martignoni et al., 2006). The increasing availability of knockout (KO)/knockin mice, where the specific mouse gene is replaced with the corresponding human gene of interest has provided the opportunity to interrogate in an in vivo setting, for example, the ability to predict a priori the role of transporters/CYPs on a drug/compound disposition (Scheer et al., 2008, 2010, 2012). Specifically, the generation of the CYP3A4 KO and humanized CYP3A4 mice with differential expression of CYP3A4 in the intestine or liver, or in both the intestine and liver, provide an attractive tool to investigate the contribution of each organ to a compound/drug disposition. For example, van Herwaarden et al. (2007) have shown the contribution of intestinal first pass metabolism and/or P-gp efflux on the disposition of docetaxel using these mice. In addition, van Waterschoot et al. (2009a), using these same mice, were able to show the contribution of intestinal CYP3A4 on oral triazolam exposure and an increase in triazolam exposure when co-administered with the CYP3A inhibitor, ketoconazole. Other models that have been used to determine the contribution of hepatic versus intestinal metabolism to the oral disposition of a drug/compound, for instance, include isolated perfused organ systems (preclinical), administration of compound/drug at different regions of the gut with or without local inhibition by CYP3A inhibitors, administration of drug during the anhepatic phase of human during liver transplantation, etc.
The purpose of conducting the studies reported here were (1) to test our hypotheses that cobimetinib undergoes intestinal first pass metabolism, utilizing the transgenic (Tg) with differential expression CYP3A4 mice in the intestine (Cyp3a−/−Tg-3A4Int), liver (Cyp3a−/−Tg-3A4Hep), or intestine and liver (Cyp3a−/−Tg-3A4Hep/Int); (2) to determine the utility of the transgenic mice with intestinal and liver expression of CYP3A4 in order to predict the drug-drug interaction (DDI) effect of CYP3A inhibition by itraconazole; and (3) to determine if the PXR-CAR-CYP3A4/CYP3A7 mice could be used to predict the clinical effect of rifampin induction on the exposure of cobimetinib.
Materials and Methods
Animals.
FVB [wild-type (WT)], Cyp3a KO, CYP3A4 transgenic mice with mouse Cyp3a deleted and replaced with human CYP3A4 in the liver (Cyp3a−/−Tg-3A4Hep), intestine (Cyp3a−/−Tg-3A4Int), or liver and intestine (Cyp3a−/−Tg-3A4Hep/Int) were obtained from Taconic (New York). PXR-CAR-CYP3A4/3A7 mice were obtained from Taconic (Artemis, Germany). All animals were female, 8–10 weeks old at the time of the study and weighed between 20 and 25 g. In all studies, serial blood samples (20 μl) were collected by tail nick at 0.25, 0.5, 1, 3, 6, 8, and 24 hours post dose. All animal studies were carried out in accordance with the Guide for the Care and Use of Laboratory Animals as adopted and promulgated by the U.S. National Institutes of Health, and were approved by the Institution’s Animal Care and use Committee.
Determining the Contribution of Intestinal and Hepatic CYP3A4 in Mice.
Animals (n = 3 female mice for the transgenic group; n = 6 female for the FVB group) were dosed with cobimetinib 1 mg/kg i.v. (in phosphate buffered saline) or 5 mg/kg orally (suspended in 0.5% methylcellulose/0.2% Tween). In addition to PK analysis, terminal plasma samples were collected from n = 2 animals after i.v. and oral dosing for metabolite determination at 1 and 3 hours post cobimetinib dosing.
Effect of CYP3A4 Inhibition or Induction on Cobimetinib Exposure in Mice.
The effect of CYP3A4 inhibition was determined in Cyp3a−/−Tg-3A4Hep/Int, FVB, and Cyp3a KO mice (n = 3 female mice each) administered itraconazole (Sporanox) 100 mg/kg by mouth daily for 4 days prior to cobimetinib administration. On the fourth day, cobimetinib (5 mg/kg by mouth or 1 mg/kg i.v.) was administered 30 minutes after the last dose of itraconazole. Induction of CYP3A4 was tested in humanized PXR-CAR-CYP3A4/3A7, where rifampin (10 mg/kg by mouth, n = 3) or vehicle (n = 3) were dosed daily for 5 days. On the fifth day, cobimetinib (5 mg/kg by mouth) was dosed 1 hour after the last dose of rifampin. The PK samples were collected as described previously and the concentrations of cobimetinib and itraconazole or rifampin were determined.
Liquid Chromatography–Tandem Mass Spectrometry (LC-MS/MS) Analysis.
Concentrations of cobimetinib were determined by a nonvalidated LC-MS/MS assay. The plasma samples were prepared for analysis by placing a 25 µl aliquot into a 96-well plate followed by the addition of 5 µl of internal standard (6C13 analog of cobimetinib, 2 µg/ml in 50/50, v/v, dimethylsulfoxide/water) and 200 µl acetonitrile. The samples were vortexed and centrifuged at 1600g for 15 minutes at room temperature; 50 µl of the supernatant was diluted with 150 µl of water and 5 µl of the solution was injected onto an analytical column. A SIL-30ACMP autosampler system (Shimadzu, Columbia, MD) was linked to LC-30AD pumps (Shimadzu), coupled with an API 5500 Qtrap mass spectrometer (AB Sciex, Foster City, CA) for sample analysis. The aqueous mobile phase was water with 0.1% formic acid (A) and the organic mobile phase was acetonitrile with 0.1% formic acid (B). The gradient was as follows: starting at 25% B and increased to 95% B for 0.6 minutes, maintained at 95% B for 0.1 minute, then decreased to 25% B within 0.1 minute. The total flow rate was 1.4 ml/min and samples were injected onto a Kinetex XB C-18 (30 × 2.1 mm, 2.6 µm) analytical column (Phenomenex, Torrance, CA) with a total run time of 0.8 minutes. Data were acquired using multiple reactions monitoring in positive ion electrospray mode with an operating source temperature of 600°C. The transitions used for cobimetinib and the internal standard (6C13 cobimetinib) were m/z 532.0 → 249.2 and 538.0 → 255.2, respectively. The lower and upper limits of quantitation of the assay for cobimetinib were 0.002 and 37.7 µM.
PK Analysis.
The PK parameters were calculated by noncompartmental methods as described in Gibaldi and Perrier (1982) using Phoenix WinNonlin, version 6.3.0 (Pharsight Corporation, Mountain View, CA). All PK parameters are presented as mean ± S.D.
In vitro Metabolism Studies.
Pooled human liver microsomes were obtained from BD Gentest (San Jose, CA; catalog #452117). Liver microsomes from FVB, Cyp3a−/−, or Cyp3a−/−Tg-3A4Hep/Int mice were freshly prepared from individual livers using a modification of the method described by Hill (2004). Briefly, tissues were homogenized in 4 volumes of homogenization buffer using an Omni Bead Ruptor 24 (Omni International, Kennesaw, GA). The S9 fraction was prepared by centrifugation at 9000g for 20 minutes at 4°C, and microsomes were isolated via ultracentrifugation. Following optimization for conditions, final incubation conditions included 1 µM cobimetinib, 0.05 mg/ml liver microsomal protein, and an incubation time course (5 time points) of 20 minutes. Incubations were conducted in triplicate/time point in 100 mM KH2PO4 buffer (pH 7.4) containing 1 mM MgCl2, cobimetinib (1 µM), and initiated with NADPH (1 mM) in a total incubation volume of 0.1 ml. The reactions were terminated by the addition of 2 volumes of acetonitrile containing 25 ng/ml of 13C6-cobimetinib as the internal standard. The concentration of cobimetinib remaining was measured via LC-MS/MS analysis. The in vitro intrinsic CL (CLint) in the units of µl/min/mg microsomal protein was calculated utilizing the in vitro half-life approach described by Obach et al. (1997). Scaling to whole body CL were conducted using the well-stirred model described by Wilkinson and Shand (1975) and previously reported physiologic parameters for mouse and human (Davies and Morris, 1993).
Metabolite Confirmation.
Three previously identified circulating human oxidative metabolites of cobimetinib (Takahashi et al., manuscript in preparation) were monitored by LC-MS/MS (M12, M18, and M19) (see Supplemental Fig. 1). Plasma collected at 1 and 3 hours post cobimetinib dosing from transgenic mice were extracted with acetonitrile, and the supernatants were concentrated under vacuum and injected to the LC column. Cobimetinib and its metabolites were eluted from a Kinetex PFP 50 × 2.1 mm, 2.6 µm column (Phenomenex) with mobile phases of 0.1% formic acid in water and acetonitrile. Metabolites were measured using multiple reactions monitoring with a 5500 QTrap equipped with a TurboIonSpray interface (AB Sciex). In positive mode, the following analytes were monitored: M12, M18, and M19 (m/z 546 -249).
Statistical Analysis.
Data in all experiments were represented as mean ± S.D. Comparisons between two groups were made using an unpaired t test. One-way analysis of variance was used to compare multiple groups, followed by Bonferroni’s/Dunnett’s multiple comparisons test. GraphPad Prism was used for all statistical analysis (version 5.00 for Mac OS X, GraphPad Software, San Diego, CA), and P < 0.05 was considered to be statistically significant.
Results and Discussion
After i.v. administration of 1 mg/kg cobimetinib to WT (FVB), Cyp3a−/−Tg-3A4Hep, Cyp3a−/−Tg-3A4Int, or Cyp3a−/−Tg-3A4Hep/Int mice, CL ranged from 26 to 35 ml/min/kg, representing 35–50% of liver blood flow (blood-to-plasma ratio in mice, approximately 1.2) (Table 1 and Figure 1B). The data suggested that i.v. CL were not significantly different in WT, CYP3A4 transgenic, and Cyp3a−/− animals (Figure 1B). In Cyp3a−/− animals the CL of cobimetinib was 20.8 ml/min/kg (Table 1), suggesting the involvement of non-Cyp3a metabolizing enzymes in the CL of cobimetinib (based on 14C metabolite identification studies in rat, dog, and human, cobimetinib is also likely to be extensively metabolized in mouse) (Takahashi et al., manuscript in preparation). In contrast to the i.v. study where similar CL was observed across mice, after oral administration of 5 mg/kg cobimetinib the area under the curve (AUC) of cobimetinib in WT, Cyp3a−/−Tg-3A4Hep, Cyp3a−/−Tg-3A4Int, or Cyp3a−/−Tg-3A4Hep/Int was significantly different: 1.35, 3.39, 1.04, and 0.701 μM⋅h, respectively (Table 1 and Figure 1C). The up to 80% lower exposures of cobimetinib observed in animals with intestinal expression of CYP3A4 compared with mice with only hepatic expression suggested that intestinal CYP3A4 played a major role in the oral disposition of cobimetinib. This finding was similar to the observation with docetaxel (van Herwaarden et al., 2007) and triazolam (van Waterschoot et al., 2009a) where intestinal CYP3A4 had a major impact on oral exposure of these drugs (7.5- and 2-fold lower AUC in mice with intestine only versus liver only expression of CYP3A4 for docetaxel and triazolam, respectively).
PK parameters of cobimetinib observed in FVB (WT; n = 6), CYP3a KO (n = 3) and CYP3A4 transgenic mice (n = 3) after i.v. (1 mg/kg) and oral (5 mg/kg) administration of cobimetinib
In Cyp3a−/−Tg-3A4Hep/Int mice, the fraction escaping intestinal extraction (Fg) was estimated to be 0.23, where F = Fa⋅Fg⋅Fh Fh is the fraction escaping hepatic extraction and F = 0.14, Fh = 0.61, and Fa was assumed to be 1 (Table 1). In the clinical absolute F study, F was reported to be 46.2%, Fh = 0.87 (based on a CL of 11.7 l/h and liver blood flow of 20.7 ml/min/kg). In mouse, assuming a value of Fa of 1 (the Fa value in human was estimated to be 0.88) (manuscript in preparation), Fg is estimated to be 0.63 (Musib et al., 2013). Thus, the F, Fg, and Fh values observed in the CYP3A4 transgenic mice were quantitatively different from that in human. This was not unexpected because there are physiologic differences, e.g., blood flow, between species. However, if taking into account the involvement of the non-Cyp3a metabolism observed in CYP3a KO animals (subtracting the hepatic extraction in CYP3a KO mice, which was approximately 0.2), the F value in the transgenic animals would be higher and it would be in the range observed in human.
From in vitro incubations of cobimetinib in human liver microsomes, the WT, Cyp3a−/−, and Cyp3a−/−Tg-3A4Hep/Int mouse liver microsome CLint values were 173 ± 55, 248 ± 57, 129 ± 33, and 305 ± 60 μl/min/mg protein, respectively. The scaled CLint values from WT and Cyp3a−/−Tg-3A4Hep/Int mouse liver microsome (incorporating plasma protein and microsomal binding; fu plasma 0.036 and fu microsome 0.48; determine by the Austin calculation) (Austin et al., 2002) followed the rank order of the in vivo CL observed in the respective mice (Table 1). These in vitro data infer that the 9-fold difference of PO exposure in WT, Cyp3a−/−, and Cyp3a−/−Tg-3A4Hep/Int transgenic mice are likely to be from intestinal metabolism (Table 1) and not from hepatic CL.
Recently, the use of CYP3A4 transgenic mice to predict the CL of CYP3A4 substrates in human has been reported (Mitsui et al., 2014). Using 6 CYP3A4 substrates, the in vitro intrinsic CL from human and CYP3A4 transgenic mouse liver microsomes were reported to be within 2-fold of each other. However, the in vivo CL observed in transgenic mice could not be extrapolated directly to predict human CL. A prediction within 2-fold was only obtained from the regression of hepatic CLint (back-calculated from the in vivo CL using the dispersion model) between human and transgenic mouse (Mitsui et al., 2014). Thus, a priori, a regression would have to be established for model compounds before human CL predictions could be made using data from transgenic mice. Although not discussed by the authors, it is worth noting that hepatic extraction derived from transgenic mouse and human were within 2-fold. It appears at this point that the direct utility of using transgenic mice in predicting human CL remains unclear.
To verify the relevance of the CYP3A4 transgenic mouse model we sought to determine if the circulating oxidative metabolites of cobimetinib (albeit minor; each <5% of total radioactivity in plasma) (Takahashi et al., manuscript in preparation) in human were also observed in the transgenic mice. Indeed, in the CYP3A4 transgenic mice, oxidative metabolites observed in human circulation (M12, M18, and M19) were observed (for structures, see Supplemental Fig. 1A). This provided supportive information that the metabolic pathways in the transgenic mice reflected those in human (which was CYP3A4 mediated) (R. Takahashi, manuscript in preparation). M12 and M19 were also observed in plasma of FVB and Cyp3a−/− mice (see Supplemental Fig. 1B), the presence of human metabolites in the FVB and Cyp3a−/− mice was not unexpected per se because mouse Cyp isoforms (Cyp3a or other Cyps) have the capability to metabolize and produce the same metabolites as human. However, it should be noted that in the transgenic mice with differential liver/intestinal expression of CYP3A4 there appeared to be quantitative and selective differences in metabolite profiles. The M12 levels were higher in transgenic mice expressing intestinal CYP3A4, and M18 was only observed in transgenic mice expressing liver CYP3A4. In addition, M18 was only observed where human CYP3A4 is expressed. Collectively, these data suggest that the transgenic mice provide a unique metabolite profile (compared with WT and Cyp3a−/−), representative (at least qualitatively) of human metabolites (see Supplemental Fig. 1).
To further assess the utility of the transgenic mice, DDI studies were conducted in Cyp3a−/−Tg-3A4Hep/Int and in humanized PXR-CAR-CYP3A4/3A7 mice. In Cyp3a−/−Tg-3A4Hep/Int mice, inhibition of CYP3A4 by itraconazole resulted in an 8.3-fold increase in cobimetinib AUC and an approximately 3-fold increase in Cmax after oral administration of cobimetinib (Table 2 and Figure 2A). In addition, i.v. administration of cobimetinib with itraconazole (oral) resulted in an approximately 4-fold increase in cobimetinib AUC and half-life; this is in keeping with a similar magnitude decrease in CL (Table 2 and Figure 2B). The greater DDI effect (approximately 8-fold versus approximately 4-fold) observed after oral dosing of cobimetinib was consistent with the contribution of intestinal CYP3A4 to the CL of cobimetinib. This finding was similar to the clinical observation reported where a greater DDI effect was observed after oral versus i.v. administration of midazolam with the CYP3A inhibitor clarithromycin, a 7- and 2.7-fold increases in the exposure (AUC) of midazolam were observed after oral and i.v. administration, respectively (Gorski et al., 1998).
Effect of inhibitors (itraconazole) and inducers (rifampin) of CYP3A on the PK and exposure (mean ± S.D.; n = 3–6/group) of cobimetinb in Cyp3a−/−Tg-3A4Hep/Int and PXR-CAR-CYP3A4/3A7 mice
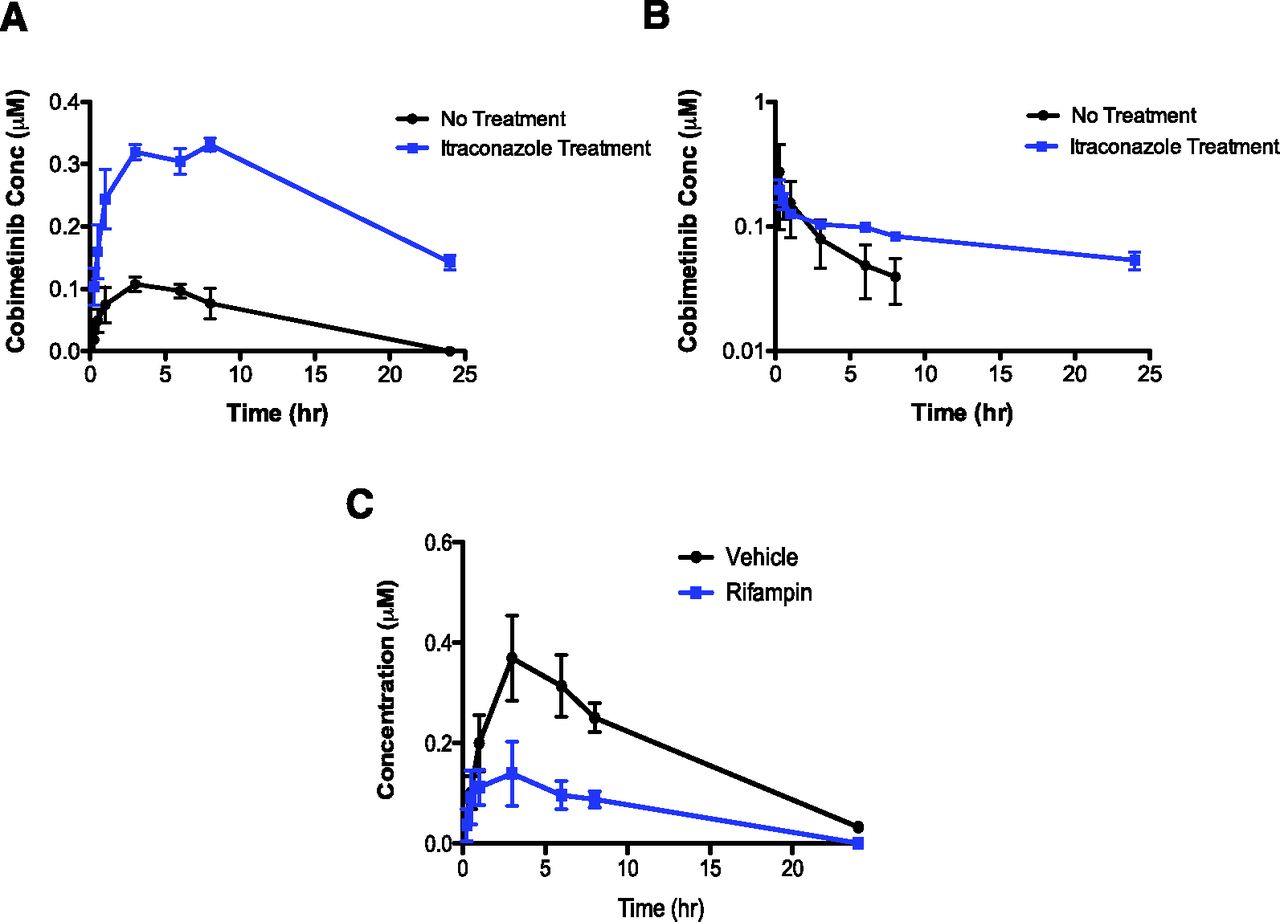
Cobimetinib concentration-time profiles in Cyp3a−/−Tg-3A4Hep/Int mice after (A) oral administration of cobimetinib (5 mg/kg, n = 3) with or without co-administration with itraconazole; (B) after i.v. administration of cobimetinib (1 mg/kg, n = 3) with or without co-administration with itraconazole (log scale) and (C) after vehicle and rifampin treatment in PXR-CAR-CYP3A4/3A7 mice.
Itraconazole did not significantly alter the exposure of cobimetinib in Cyp3a KO animals, suggesting that in mice only the Cyp3a isoenzyme was inhibited by itraconazole (Table 3). In addition, itraconazole co-administration to FVB (WT) mice resulted in a 5.8-fold increase in oral exposure of cobimetinib (within the range of fold increase observed in transgenic mice) (Table 3). This is consistent with the suggestion that Cyp3a enzymes in mice may be the primary enzyme that metabolizes cobimetinib (Table 3). Collectively, these data suggest that the magnitude increase in CL of cobimetinib from co-administration with itraconazole to Cyp3a−/−Tg-3A4Hep/Int mice was higher than expected based on the apparent low CYP3A4 contribution to CL of cobimetinib (approximately 30% difference in CL between Cyp3a−/− versus transgenic animals) (Table 1) and the specificity of itraconazole to inhibition of only Cyp3a; the reason for this higher than expected decrease in cobimetinib CL (when co-administered with itraconazole) is unclear. It should be noted that systemic exposure of itraconazole in these studies was similar to clinical exposures from a dose of 200 mg Sopranox solution (see the Sopranox Product Insert and Supplemental Fig. 2); however, the intestinal/hepatic exposures of itraconazole are unknown and may be higher than clinical tissue exposures based on the higher mg/kg dose.
Exposure (AUC and Cmax; mean ± S.D.) of cobimetinib in FVB (WT) and Cyp3a−/− mice with and without treatment with itraconazole (n = 3–6 mice/group)
In addition to studying the effect of CYP3A4 inhibition, the effect of induction was investigated using the PXR-CAR-CYP3A4/3A7 mice. It has been reported that the PXR-CAR-CYP3A4/3A7 model displays human-like CYP3A4 induction to various PXR inducers (Hasegawa et al., 2011). In addition to an increase in CYP3A4 mRNA levels after rifampin induction in PXR-CAR-CYP3A4/3A7 mice, in vivo exposures of triazolam were reported to be decreased by up to 90% after rifampin treatment (Hasegawa et al., 2011). Consistent with the role of CYP3A4 in the metabolism of cobimetinib, CYP3A4 induction resulted in an approximately 80% decrease in the exposure of cobimetinib (Table 2 and Figure 2C). As a reference, clinical induction of CYP3A from 600 mg of rifampin has been reported to decrease the exposure of the prototypical CYP3A substrate, midazolam by approximately 90%–98% (Backman et al., 1996; Gorski et al., 2003; University of Washington Drug Interaction Database). Thus, the observed effect of rifampin induction on cobimetinib in PXR-CAR-CYP3A4/3A7 mice was on the lower end of the scale compared with a sensitive CYP3A4 substrate such as midazolam. It is worth noting that the exposure of rifampin in this study was consistent with clinical concentrations observed from a dose of 600 mg (Kwara et al., 2014) (see Supplemental Fig. 2).
The utility of a specific transgenic model is dependent on the disposition and metabolism of the compound/drug of interest. For instance, since cobimetinib was predominantly metabolized by CYP3A4, and was metabolized by both intestinal and liver CYP3A, the CYP3A4 transgenic mice with differential expression in each tissue were used as an ideal model. It appeared that unlike midazolam, where mice Cyp2c metabolized midazolam and confounded the interpretation of data from Cyp3a KO mice (van Waterschoot et al., 2008), cobimetinib disposition and metabolism appeared to be mainly driven by Cyp3a/CYP3A in mice and human. However, some contribution from CYP (as evidenced by the Cyp3a KO data) and non-CYP enzymes such as UGT (fm likely to be low) on the metabolism of cobimetinib cannot be excluded. One consideration when using this model is that for some CYP3A substrates, the contribution of CYP3A5 to the metabolism of a compound can be substantial (Lamba et al., 2002). While cobimetinib appears to be mainly metabolized by CYP3A4 (data on file), for midazolam, vincristine, and atanazavir, CYP3A5 has been reported to contribute to approximately 50%–80% of the overall fm CYP3A (Walsky et al., 2012; Tseng et al., 2014). Therefore, data generated in the CYP3A4 transgenic mice, while representative of the *3/*3 genotype (with low/no CYP3A5 expression) may not reflect the population expressing CYP3A5 (*1/*3 or *1/*1). The allelic frequencies of CYP3A5*1/*3 in Caucasians and African Americans were reported to be approximately 17% and 40%, respectively, and for CYP3A5*1/*1, they were reported to be approximately 1% and 45% in Caucasian and African American subjects, respectively. Significant ethnic variability in allelic frequency has been reported (Xie et al., 2004). In addition, many compounds/drugs are metabolized by multiple enzymes and may be substrates of transporters; thus, compensation from deletion of one enzyme may result in a compensatory increase in another metabolizing enzyme or transporter. For instance, an increase in Cyp2c55 expression is reported with deletion of Cyp3a (van Waterschoot et al., 2009b). We had characterized some of the Cyp, Ugt, and transporter changes by reverse-transcription polymerase chain reaction and observed some changes in Cyp, transporter, and Ugt expression (compared with WT animals) in both hepatic and intestinal/duodenal tissue (see Supplemental Figs. 3 and 4). In most cases these changes were modest and unlikely to affect the overall interpretation of data for cobimetinib.
Overall, the findings from this study, albeit with one compound, suggest that the transgenic mouse model under specific conditions may be a useful tool to predict the relative contribution of hepatic and intestinal metabolism. Recently, the clinical interaction data of cobimetinb with itraconazole have been reported, a 6.7- and 3.2-fold increase in cobimetinib AUC and Cmax, respectively, were observed (American Society of Clinical Pharmacology and Therapeutics Annual Conference, New Orleans, 2015). In addition, based on the observed DDI data with itraconazole, a PBPK model was developed and used to simulate the effect of rifampin induction (600 mg daily). An 83% decrease in cobimetinib exposure was predicted with rifampin induction. Comparison of the observed/predicted clinical DDI data to the effect of itraconazole and rifampin in the transgenic mouse models suggests that the transgenic model provided a good prediction of the clinical DDI effect. In the future, as more data using transgenic mice become available, particularly for drugs in which clinical DDI and or clinical disposition is well understood, it is anticipated that in tandem with in vitro data, PBPK modeling, and simulations, a clearer picture of the utility and limitations of the transgenic model will become evident.
Authorship Contributions
Participated in research design: Choo, Woolsey, DeMent, Ly, Takahashi.
Conducted experiments: Messick, Woolsey, DeMent, Takahashi, Qin.
Contributed new reagents or analytic tools: Takahashi, DeMent.
Performed data analysis: Choo, Woolsey, DeMent, Ly, Takahashi.
Wrote or contributed to the writing of the manuscript: Choo, Woolsey, DeMent, Ly, Takahashi.
Footnotes
- Received February 8, 2015.
- Accepted March 26, 2015.
↵
 This article has supplemental material available at dmd.aspetjournals.org.

Abbreviations
- AUC
- area under the curve
- CL
- clearance
- CLint
- intrinsic clearance
- Cyp3a−/−Tg-3A4Hep
- transgenic mice with CYP3A4 in the liver only
- Cyp3a−/−Tg-3A4Hep/Int
- transgenic mice with CYP3A4 in both liver and intestine
- Cyp3a−/−Tg-3A4Int
- transgenic mice with CYP3A4 in the intestine only
- DDI
- drug-drug interaction
- F
- bioavailability
- Fa
- fraction absorbed
- Fg
- fraction escaping intestinal extraction
- Fh
- fraction escaping hepatic extraction
- KO
- knockout
- LC-MS/MS
- liquid chromatography–tandem mass spectrometry
- PK
- pharmacokinetic
- Tg
- transgenic
- WT
- wild type
- Copyright © 2015 by The American Society for Pharmacology and Experimental Therapeutics


