


Abstract
It is important to examine the cytochrome P450 2C19 (CYP2C19) genetic contribution to drug disposition and responses of CYP2C19 substrates during drug development. Design of such clinical trials requires projection of genotype-dependent in vivo clearance and associated variabilities of the investigational drug, which is not generally available during early stages of drug development, but is essential for CYP2C19 substrates with multiple clearance pathways. This study evaluated the utility of pharmacogenetics-based mechanistic modeling in predicting such parameters. Hepatic CYP2C19 activity and variability within genotypes were derived from in vitro S-mephenytoin metabolic activity in genotyped human liver microsomes (N = 128). These data were then used in mechanistic models to predict genotype-dependent disposition of CYP2C19 substrates (i.e., S-mephenytoin, citalopram, pantoprazole, and voriconazole) by incorporating in vivo clearance or pharmacokinetics of wild-type subjects and parameters of other clearance pathways. Relative to the wild-type, the CYP2C19 abundance (coefficient of variation percentage) in CYP2C19*17/*17, *1/*17, *1/*1, *17/null, *1/null, and null/null microsomes was estimated as 1.85 (117%), 1.79 (155%), 1.00 (138%), 0.83 (80%), 0.38 (130%), and 0 (0%), respectively. The subsequent modeling and simulations predicted, within 2-fold of the observed, the means and variabilities of urinary S/R-mephenytoin ratio (36 of 37 genetic groups), the oral clearance of citalopram (9 of 9 genetic groups) and pantoprazole (6 of 6 genetic groups), and voriconazole oral clearance (4 of 4 genetic groups). Thus, relative CYP2C19 genotype-dependent hepatic activity and variability were quantified in vitro and used in a mechanistic model to predict pharmacokinetic variability, thus allowing the design of pharmacogenetics and drug-drug interaction trials for CYP2C19 substrates.
Introduction
Cytochrome P450 2C19 (CYP2C19) metabolizes many clinically important drugs. CYP2C19 is genetically polymorphic, with approximately 25 variants that confer differential activities ranging from loss-of-function (i.e., null alleles *2–*9) to increased enzyme activities (*17). Genetic polymorphisms of CYP2C19 have been associated with variable responses of drugs with clinical relevance, by affecting drug metabolic clearance and pharmacokinetics (PK) that subsequently contribute to variabilities in pharmacodynamics (PD) that include both efficacy and safety (Scott et al., 2011). Hence, there is a need to examine the role of CYP2C19 genetics in drug disposition and responses of CYP2C19 substrates undergoing clinical development (http://www.ema.europa.eu/docs/en_GB/document_library/Scientific_guideline/2012/02/WC500121954.pdf; http://www.fda.gov/downloads/drugs/guidancecomplianceregulatoryinformation/guidances/ucm337169.pdf).
The significance of study design has been highlighted to avoid equivocal findings with respect to effect of cytochrome P450 (P450) polymorphisms and drug-drug interactions on PK (Williams et al., 2006; Dickinson et al., 2007a, b; Johnson et al., 2009; Duan et al., 2011). Power consideration is especially important for designing trials to understand CYP2C19 genetic contribution to PK/PD outcomes of a new molecule entity that is cleared through CYP2C19 in addition to other clearance pathways. Design of such clinical trials requires a priori knowledge of differences in drug exposures between different genotypes/phenotypes as well as variation of exposure within each CYP2C19 genotype, which is not generally available during early stages of drug development.
Consequently, it is important to develop knowledge and methods that enable prediction of clinical clearance and associated variabilities within each genotype for CYP2C19 substrates, including those with additional clearance pathways. Unfortunately, when using in vitro metabolism data alone, the in vivo clearances of wild-types for some CYP2C19-metabolized substrates were underpredicted (Howgate et al., 2006), which could subsequently affect outcomes of power calculation when designing trials to evaluate CYP2C19 pharmacogenetics (PGx) impact. Meanwhile, although quantitative approaches estimated effects of CYP2C19 genotypes based on clinical drug exposure data of different genetic subgroups (Goutelle et al., 2013), they have not been refined to readily accommodate the impact of multiple clearance pathways. In vitro–in vivo extrapolation (IVIVE) approach in conjunction with mechanistic modeling has been shown to successfully predict clinical genetic impact on systemic exposures of drugs subjected to hepatic clearance of CYP2D6, CYP2C8, and CYP2C9 (Dickinson et al., 2007a, b; Yeo et al., 2013).
As a result, the present study evaluated the utility of a PGx-based mechanistic model in predicting human clearance and variability for CYP2C19-metabolized drugs in relation to genotypes in populations. The mechanistic model incorporates both in vivo clearance data of wild-type subjects and in vitro metabolism data of a CYP2C19 prototype substrate (i.e., S-mephenytoin) generated from human liver microsomal samples (HLMs) with various CYP2C19 genotypes. Four CYP2C19 substrate drugs, S-mephenytoin, citalopram, pantoprazole, and voriconazole, are used to demonstrate the PGx model utility.
Materials and Methods
Determination of In Vitro CYP2C19 S-Mephenytoin Metabolic Activity
Human Liver Samples.
A total of 128 sets of HLMs and DNA samples was obtained. Among them, 18 sets were acquired from BD Gentest (Woburn, MA) and Xenotech (Lenexa, KS) to enrich for CYP2C19 minor variants. The rest were derived from human liver tissues curated from various sources, including the Medical College of Wisconsin (Milwaukee, WI), Medical College of Virginia (Richmond, VA), Indiana University School of Medicine (Indianapolis, IN), and University of Pittsburgh (Pittsburgh, PA). HLMs were prepared by differential ultracentrifugation, as described previously (van der Hoeven and Coon, 1974), and characterized for protein content by the Lowry method. The DNA samples were extracted from human liver tissues using the Maxwell 16 instrument (Promega, Madison, WI), per manufacturer’s instructions. All liver samples were acquired under protocols approved by the appropriate committees for the conduct of human research.
CYP2C19 Genotyping.
The CYP2C19 genotyping was conducted using the Drug Metabolizing Enzyme and Transporter Gene assay system (v.1 and v.2; Affymetrix, Santa Clara, CA) (Dumaual et al., 2007) in good laboratory practice–compliant laboratories (Eli Lilly and Company, Indianapolis, IN). Additionally, CYP2C19*17 (rs12248560, −806C>T) was supplementally tested by either TaqMan (assay ID: C_469857_10; Applied Biosystems, Foster City, CA) at Eli Lilly and Company or Sanger sequencing at Polymorphic DNA Technologies (Alameda, CA). Star alleles were assigned based on the CYP450 Allele Nomenclature Committee (http://www.cypalleles.ki.se/). Hardy–Weinberg equilibrium was not checked due to samples preselection. Calculations of CYP2C19 allelic frequencies were only conducted in Caucasians due to small sample sizes of other ethnic groups.
In Vitro CYP2C19 S-Mephenytoin Assays.
CYP2C19 activity as measured by the formation of 4′-hydroxymephenytoin was assayed in both a single substrate concentration (N = 128 HLMs) and kinetics conditions (N = 30 HLMs). The final reaction mixtures (100 μl) consisted of 100 mM sodium phosphate buffer (pH 7.4), S-mephenytoin (single concentration: 50 µM; kinetics: 2.86–366.4 μM), and 0.5 mg/ml microsomes. Substrates were preincubated in buffer for approximately 3 minutes at 37°C. Reactions were then initiated with the addition of NADPH (1 mM) and incubated for another 45 minutes at 37°C, reflecting linear rate conditions. All incubations were stopped by adding 100 μl acetonitrile containing the appropriate internal standard (IS) and centrifuged to remove denatured protein. The supernatant was subjected to liquid chromatography–tandem mass spectrometry (LC/MS) analysis using methods described below. The linearity of 4′-hydroxymephenytoin formation as a function of both the incubation time and protein concentration was determined by representative pooled microsomes (lot 0810040, pool of mixed gender, N = 20; Xenotech) and assumed applicable to all HLMs. The estimation of enzyme kinetic parameters was conducted by nonlinear regression (WinNonlin; Pharsight, Mountain View, CA) using the best-fit model.
LC/MS Analyses.
LC/MS analyses were conducted using a Sciex API 4000 atmospheric pressure ionization triple-quadrupole mass spectrometry equipped with TurboIonSpray interface (Applied BioSystems/MDS Sciex, Framingham, MA) at a negative mode with a Varian Monochrom C18 (5-μm particle size, 50 × 2.00 mm) column. The solvent system consisted of solvent A (5 mM NH4OAc in 5% MeOH) and solvent B (5 mM NH4OAc in 95% MeOH). Solvent B was delivered initially at 25%, held for 0.25 minute, increased to 98% via a 1-minute gradient, and held at 98% for 0.1 minute, then decreased back to 25% within 0.05 minute and brought to stop in another 0.1 minute. The flow rate was 500 μl/min with a total run time of 1.5 minutes, and the injection volume was 20 μl. The transition ions were 233→190 and 236→193 for 4′-hydroxymephenytoin and IS ([d3] 4′-hydroxymephenytoin), respectively. The method was validated for plasma in the concentration range of 9.7 nM to 19.9 µM for 4′-hydroxymephenytoin. The peak area ratio of 4′-hydroxymephenytoin over that of IS was quantified, and correlation coefficients were calculated by a weighted linear regression (1/X2) analysis. Mass spectrometry bioanalytical data below quantitative level were not used in further analyses.
Statistical Analyses.
A random effects model with individual HLM as a random effect was used to discern the contribution of intersubject versus intrasubject variability (assay measurement) to the total variance. One-way analyses of variance were used to determine the association of CYP2C19 activities measured at the single concentration (50 µM) with CYP2C19 genotypes, or demographic factors (i.e., age, gender, and ethnicity), using an α of 0.05. If analyses were significant, Tukey-Kramer method was used to determine the adjusted P values for multiple comparisons. All association analyses were based on log-transformed activity data.
PK Modeling and Simulations of Urinary S/R-Mephenytoin Ratio
As summarized in Fig. 1, a hybrid of top-down and bottom-up IVIVE approaches was used with the SimCYP Population-Based Simulator (version 12.2; SimCYP, Sheffield, UK) to simulate urinary S/R-mephenytoin ratio following a single oral dose of 100 mg racemic mephenytoin. S-mephenytoin modeling was based on the default compound file Sim-S-mephenytoin, except for two modifications (Table 1). The Advanced Dissolution Absorption and Metabolism model (Jamei et al., 2009) was used, and absorption parameters were predicted using the polar surface area (PSA) and number of hydrogen bond donors (HBD) (Table 1). CYP2C19-medidated 4′-hydroxylation and CYP2C9-mediated N-demethylation were employed as the metabolic clearance pathways, with the hepatic fractional clearance (fm) being 0.99 and 0.006, respectively, based on a 162-fold difference in the oral clearance between CYP2C19 extensive and poor metabolizers (PM) (Wedlund et al., 1985). Of note, CYP2C9 was chosen over the SimCYP default setting of CYP2B6 in mediating N-demethylation because CYP2C9 is more clinically relevant at physiologic concentrations (Ko et al., 1998). Identical parameters were assumed in R-mephenytoin modeling, except that CYP2C9-mediated N-demethylation was assumed to be the only metabolic clearance route because formation of R-4′-hydroxymephenytoin by CYP2C19 was negligible (Jansson et al., 2006).

A hybrid of top-down and bottom-up IVIVE approach used in the SimCYP modeling of S-mephenytoin, citalopram, and pantoprazole (modified after Cubitt et al., 2011). The top-down approach is as follows: (1) the drug clearance for CYP2C19*1/*1 (or nongenotyped) individuals is subjected to retrograde method that produces (2) a global hepatic CLint,u value. This value is then apportioned by fractional clearance of each of the major enzyme isoforms i and metabolic reactions j to produce (3) a set of intrinsic clearance estimates. The bottom-up approach is as follows: (4) the genotype-specific means and variabilities of the CYP2C19 enzyme abundance, which have been estimated and derived from in vitro activity assays, are used to inform the SimCYP simulation of the liver CYP2C19 enzyme abundance in individuals. The simulator then (5) utilizes these and other relevant individual liver P450 enzyme abundance as part of an IVIVE estimate of that virtual subject’s PK parameters.
Parameter values used for mephenytoin, citalopram, and pantoprazole simulations
Top-Down Calculation of Unbound Intrinsic Clearance.
The SimCYP retrograde calculator (Cubitt et al., 2011) was used to back-calculate from oral clearance (CLpo) of S-mephenytoin to a total hepatic intrinsic clearance (CLint,u), which was then apportioned by the fm of each major enzyme (i) and metabolic reactions (j) to estimate individual CLint,u,j,i (eq. 1) of each enzymatic elimination pathway. The SimCYP default S-mephenytoin CLpo value was assumed to be based on CYP2C19 wild-type subjects (Howgate et al., 2006).
 (1)
(1)Estimation of Enzyme Activity and Variability.
The mean and coefficient of variation (CV) values of enzyme abundance in each CYP2C19 genotype were estimated using the rate of 4′-hydroxymephenytoin formation at a 50-µM concentration of S-mephenytoin in HLMs, assuming the linear rate conditions were met and enzyme activity was proportional to abundance (see the rationale in Discussion). A normalized mean velocity was produced for each genotype by subtracting the mean formation rate of the CYP2C19 null/null group from that of other genotype groups. A scaling factor was then calculated as the ratio of the normalized mean velocity in each non–wild-type sample set relative to that of the wild-type (CYP2C19*1/*1), which was subsequently used to estimate the mean CYP2C19 abundance in microsomal samples of the genotype based on that of the wild-type (eq. 2).
 (2)
(2)i specifies a CYP2C19 genotype.
The CV value of enzyme abundance in microsomal samples of each CYP2C19 genotype, except for CYP2C19 null/null, was assumed to be the CV of the normalized mean activity in that genotype. This was using a S.D. derived from the square root of combined variances (Var) of the measured activity in that genotype and the activity of the null/null genotype (eq. 3) (Loève, 1977).
 (3)
(3)Collation of In Vivo Literature Data and PK Simulations.
Fourteen populations investigated in 12 clinical studies of mephenytoin (Wedlund et al., 1984; Sanz et al., 1989; Bertilsson et al., 1992; Chang et al., 1995; de Morais et al., 1995; Persson et al., 1996; Goldstein et al., 1997; Xiao et al., 1997; Sviri et al., 1999; Aklillu et al., 2002; He et al., 2002; Sim et al., 2006) were collated from the data published between 1992 and 2006 using the PubMed online database. Selection criteria included the following: 1) healthy normal adult subjects, 2) a single oral administration of 100 mg racemic mephenytoin, and 3) availability of urinary S/R-mephenytoin ratio at 0–8 hours that were either reported or reasonably recovered by digitization of figures. Additionally, the S-mephenytoin plasma concentration profiles in both CYP2C19 extensive and PM were reported in two studies (Wedlund et al., 1985; Jacqz et al., 1986). The data in these profiles were digitized and then compared with those predicted in CYP2C19*1/*1 and CYP2C19 PM based on the demographic information of the CYP2C19*1/*1 subjects (Sim et al., 2006). The latter was selected for prediction because it had the largest number of CYP2C19*1/*1 individuals.
Study Design in Prediction of Urinary S/R-Mephenytoin Ratio.
Virtual populations of healthy subjects were generated by a fixed randomization seed to match those in the aforementioned 14 published populations. To estimate S/R-mephenytoin ratio in the recovered urine (0–8 hours), the 24-hour PK and urine profiles of each enantiomer were first simulated separately, and then the corresponding values from each enantiomer were integrated together to generate ratios. The simulation was carried out at a single oral dose of 50 mg S- or R-mephenytoin, according to the simulation study design as detailed below.
First, six identical virtual populations that only differed in CYP2C19 enzyme abundance were created to mimic each of the 14 published populations. These six virtual populations matched the corresponding literature population with regard to the number of subjects, age ranges, and gender proportions. The mean and CV values of CYP2C19 enzyme abundance in each virtual population were modified, as described in Materials and Methods, “estimation of enzyme activity and variability,” to mimic one of the six CYP2C19 genotypes, that is, CYP2C19*17/*17, *1/*17, *1/*1, *17/null, *1/null, and null/null.
Second, for each of the 14 literature populations, the urinary R- and S-mephenytoin values during the first 8-hour urine collection were simulated, respectively, five times in each of the six virtual populations to produce a urinary ratio of S/R-mephenytoin. Subsequently, the mean and CV value of the urinary ratio of S/R-mephenytoin were calculated for each virtual subject across five sets of simulated trials using JMP 9.0.3 (SAS Institute, Cary, NC).
Last, the urinary ratio of S/R-mephenytoin (0–8 hours following drug intake) of a published study was predicted using that of select virtual subjects from the corresponding six virtual populations. One virtual subject was selected to match each subject in the published study with respect to the CYP2C19 genotype. Depending on the availability of CYP2C19 genetic data in the published studies, the method used to assign genotypes and simulation results to virtual individuals varied. For literature studies that genotyped null alleles and *17, all the identified CYP2C19 genotypes were used to select virtual subjects. The arithmetic mean and CV of the predicted S/R-mephenytoin ratio of each CYP2C19 genotype were calculated and then compared with the observed. For literature studies without genetic data, the weighted averages of CYP2C19 genetic frequencies previously reported by ethnicity groups (Supplemental Table 1) were used to project the CYP2C19 genotype distribution assuming Hardy–Weinberg equilibrium, which was subsequently used to select virtual subjects. The overall arithmetic mean and CV of the predicted urinary S/R-mephenytoin ratio of all select virtual subjects were calculated to compare with the observed. For literature studies that only genotyped null alleles, previous CYP2C19*1/*1 and *1/null carriers were recalculated for the percentage of *17 carriers according to the allelic frequency reported previously (Supplemental Table 1). The newly projected CYP2C19 genotype distribution was used to select virtual subjects. The arithmetic mean and CV of the predicted urinary S/R mephenytoin ratio from the four groups, CYP2C19*1/*1 OR *1/*17 OR *17/*17, *1/null OR *17/null, null/null, and non-PM, were, respectively, calculated and compared with those observed in CYP2C19*1/*1, CYP2C19*1/null, CYP2C19 null/null, and non-PM.
PK Modeling and Simulations of Citalopram Metabolism
The oral clearance of a single oral administration of 20 or 40 mg citalopram in relation to CYP2C19 genotypes was simulated using the mechanistic model, as described above for mephenytoin. The physicochemical characteristics and drug disposition properties of citalopram (Table 1) were entered into a SimCYP compound file. Advanced Dissolution Absorption and Metabolism model was used to better capture the interplay of citalopram and gut metabolism, and absorption parameters were estimated using PSA and HBD (Table 1). A minimal PBPK model was chosen due to lack of multiple-compartment kinetics. A total hepatic CLint,u was estimated as 23.9 µl/min per milligram microsomal protein using the SimCYP retrograde approach based on the systemic clearance (systemic clearance = 19.8 l/h) and renal clearance (renal clearance = 4 l/h) (Celexa, 2009). CYP2C19, CYP2D6, and CYP3A4 were employed to be the major clearance mechanisms, with hepatic fm values being estimated as 0.5, 0.3 (Fudio et al., 2010), and 0.2, respectively, which were subsequently used to calculate P450 hepatic CLint,u values (Table 1). The duration of each trial was set to 168 hours.
Three clinical studies of citalopram (Yu et al., 2003; Yin et al., 2006; Fudio et al., 2010) were collated from the data published between 1992 and 2006 using the PubMed online database. Selection criteria included the following: 1) healthy normal adult subjects; 2) oral administration of citalopram; and 3) reported citalopram CLpo by CYP2C19 genotypes. Additionally, the citalopram plasma concentration profile was reported in nongenotyped healthy Caucasians following a single oral dose of 40 mg citalopram (Joffe et al., 1998). The data in these profiles were digitized, adjusted by dose, and then compared with those predicted in CYP2C19*1/*1 and CYP2C19 PM based on the demographic information in Fudio et al. (2010). The latter was selected for prediction because it had the largest number of CYP2C19*1/*1 individuals.
PK Modeling and Simulations of Pantoprazole
The oral clearance of a 40-mg single oral dose of pantoprazole in relation to CYP2C19 genotypes was simulated using the mechanistic model, as described above. The physicochemical characteristics and drug disposition properties of pantoprazole (Table 1) were entered into a SimCYP compound file. A first-order absorption model was used with the absorption parameters being estimated using PSA and HBD (Table 1). A minimal PBPK model was chosen due to lack of multiple-compartment kinetics. A total hepatic CLint,u was estimated as 165.6 µl/min per milligram microsomal protein using the SimCYP retrograde method based on the systemic clearance (systemic clearance = 10.32 l/h) and no renal clearance (Protonix, 2000). CYP2C19 and CYP3A4 were employed to be the major clearance pathways, with hepatic fm values of 0.80 and 0.2 (Protonix, 2000), respectively, which were subsequently used to calculate P450 hepatic CLint,u values (Table 1). One clinical trial that reported pantoprazole plasma concentration profiles in CYP2C19-genotyped healthy Caucasians (Gawronska-Szklarz et al., 2012) was selected, digitized, and then compared with prediction, as the study had the largest number of subjects within all the six CYP2C19 genotypes of interest. Trial simulation was set to 24 hours.
PK Modeling and Simulations of Voriconazole
The predictive performance of genotype-based CYP2C19 hepatic microsomal abundance was further evaluated by projecting the voriconazole PK profile of CYP2C19 variants based on that of CYP2C19*1/*1. Two compartment models with first-order absorption were evaluated to describe the systemic plasma concentration-time data of voriconazole in CYP2C19*1/*1 (Weiss et al., 2009). This study was chosen based on the selection criteria: 1) reported voriconazole CLpo and PK profiles of the largest number of CYP2C19 genotypes following a single oral dose in healthy normal adult subjects; 2) CYP2C19*17 was part of the genotyping panel. Model selection criteria included visual examination of the distribution of residuals, coefficients of variation on estimated parameters, and Akaike’s Information Criterion (Akaike, 1973). A nonlinear least-squares regression analysis was used to fit the voriconazole plasma concentration-time profile in CYP2C19*1/*1 using a nonweighting scheme and a Gauss-Newton (Levenberg and Hartley) minimization process (Phoenix 64; Pharsight, Mountain View, CA). The time-concentration profiles in other CYP2C19 variants were subsequently simulated by keeping all parameters constant except for altering the elimination rate constant (k10), as described in eq. 4. The rationale for this assumption is that voriconazole is a drug of low extraction ratio with the drug clearance being proportional to intrinsic clearance. Hepatic CYP2C19 enzyme has been shown to be mainly responsible for formation of the major circulating metabolite resulting from N-oxidation, with the fm being estimated as 0.65 based on a relative activity factor approach assuming that CYP2C19 and CYP3A4 play major roles at physiologically relevant drug plasma concentrations (Hyland et al., 2003).
 (4)
(4)i specifies a CYP2C19 variant; the scaling factor i indicates the corresponding scaling factor of CYP2C19 enzyme abundance of each CYP2C19 variant.
Results
Characterization and Genotyping of human Liver Samples.
The demographics and CYP2C19 genotypes of the 128 human liver samples are shown in Table 2. Among the donors with available demographic information, an approximate 2:1 male:female ratio was observed, and approximately 96% of the livers were from the 15-year-old and above, and 80% were from Caucasians, with the remainder being of Asian, African, or Hispanic origin. CYP2C19*2 and *17 were the major variant alleles identified across multiple ethnic groups. One CYP2C19*4 heterozygous carrier was found in a Hispanic donor, consistent with its rare variant status (Ferguson et al., 1998). Allele frequencies of CYP2C19*2 (37%) and *17 (42%) in Caucasians were found to be higher than those reported in the literature (Solus et al., 2004), attributed to enrichment for livers with the two variants at samples collection stage.
Demographics and CYP2C19 genotypes of human liver tissue samples
In Vitro CYP2C19 Activity in HLMs.
CYP2C19 activity was measured by the 4′-hydroxymephenytoin formation rate at a single concentration of S-mephenytoin (50 µM), and moderate variability was observed within each of the six CYP2C19 genotypes (Fig. 2; Table 3). Five samples (two CYP2C19*1/*2 and three CYP2C19*2/*2) were excluded from the 128 genotyped HLMs that yielded values below quantitative level. No statistically significant association was found between CYP2C19 activity and demographic variables, including age, gender, and ethnicity (data not shown). As a result, to maximize study power, all CYP2C19 activity data were used to examine the genetic impact of CYP2C19, regardless of the demographics. The arithmetic mean of CYP2C19 activity differed among genotypes, with a trend of CYP2C19*17/*17 > *1/*17 > *1/*1 > *17/null > *1/null » null/null. The mean activity of CYP2C19 null/null group, or PM, was significantly lower than that of other genotypes. The scaling factors and CVs for the CYP2C19 enzyme abundance were subsequently derived, as described in Materials and Methods, and then displayed in Table 3. Relative to the wild type, the estimated CYP2C19 mean abundance (CV%) in microsomal samples of CYP2C19*17/*17, *1/*17, *1/*1, *17/null, *1/null, and null/null was estimated to be 1.85 (117%), 1.79 (155%), 1 (138%), 0.83 (80%), 0.38 (130%), and 0 (0%), respectively.
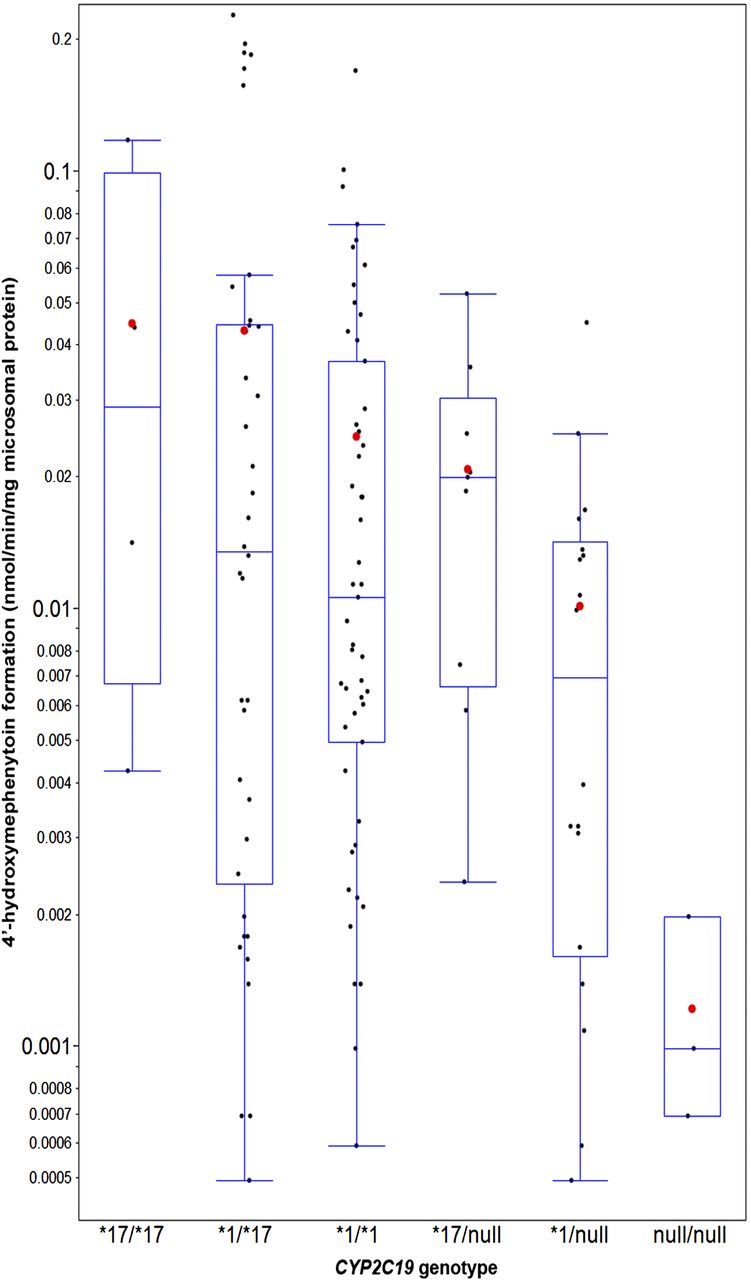
The in vitro formation rate of 4′-hydroxymephenytoin at a single concentration of S-mephenytoin (50 µM) in relation to CYP2C19 genotypes in HLMs (N = 123). S-mephenytoin was incubated with 0.5 mg/ml HLMs and 1 mM NADPH in 100 μl incubation mixture for 45 minutes at 37°C. The number of liver samples per genotype was 4 (CYP2C19*17/*17), 38 (CYP2C19*1/*17), 51 (CYP2C19*1/*1), 9 (CYP2C19*17/null), 18 (CYP2C19*1/null), and 3 (CYP2C19 null/null). The “null” refers to CYP2C19*2 or *4 allele. Five samples (two CYP2C19 *1/*2 and three CYP2C19*2/*2) were excluded that yielded values below quantitative level. The formation rates are presented on a log-scale axis as blue boxes and whisker plots with the whiskers depicting 5th and 95th percentile. Each black dot represents the average formation rate of two replicated assays for each HLM. The arithmetic means of each genotype group are depicted by red dots.
Estimated CYP2C19 enzyme abundance and variability in relation to genotypes
Based on in vitro formation rate of 4′-hydroxymephenytoin at a single concentration of S-mephenytoin (50 µM) in 123 HLMs. Five samples (two CYP2C19*1/*2 and three CYP2C19*2/*2) yielded values below quantitative level and were excluded from the 128 genotyped HLMs. The “null” refers to CYP2C19*2 or *4 allele.
To further understand the role of CYP2C19 in the metabolite formation across the six different genotypes, CYP2C19 S-mephenytoin kinetics assay was conducted. The selected HLMs within each genotype covered the high, median, and low range of CYP2C19 activities as measured by the single concentration assay. The formation of 4′-hydroxymephenytoin yielded Michaelis-Menten kinetics for all HLMs (data not shown), consistent with a single enzyme responsible for the metabolite formation. A similar Km value (∼50 µM) was observed among all the genotypes, except for the CYP2C19 null/null (Table 4). Within each genotype, ranking order of the Vmax values was the same as that in the single concentration assay (data not shown), which corroborated the quality of the single concentration assay data.
Kinetic parameters of 4′-hydroxymephenytoin formation in genotyped HLMs
Four to five human liver samples per CYP2C19 genotype were used, and S-mephenytoin to 4′-hydroxymephenytoin conversion was measured. S-mephenytoin (2.86–366.4 μM) was incubated with 0.5 mg/ml HLMs and 1 mM NADPH in 100 μl incubation mixture for 45 minutes at 37°C. A single-site Michaelis-Menten model was used to describe kinetics data. The “null” refers to CYP2C19*2 or *4 allele.
Accuracy of Predicted Urinary S/R-Mephenytoin Ratio.
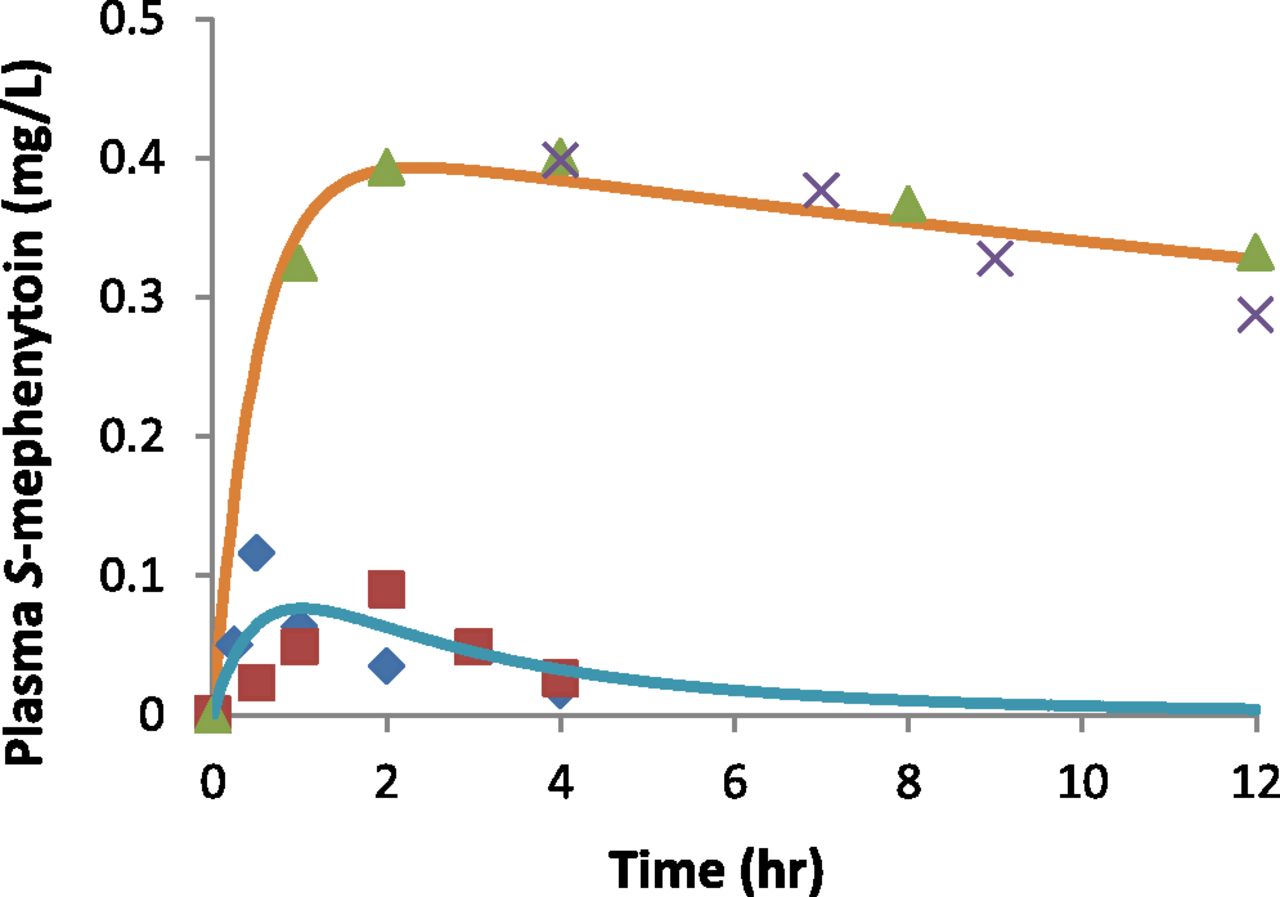
Following a single oral dose of 100 mg racemic mephenytoin, the predicted mean values of S-mephenytoin plasma concentration-time profiles reasonably recovered those observed in CYP2C19*1/*1 and PM (Fig. 3). The results for the predicted mean and variabilities of the urinary S/R-mephenytoin ratio for 37 subpopulations with different CYP2C19 genotypes drawn from 12 published studies are shown in Fig. 4 and Table 5. Among the 12 referenced studies, three and eight studies, respectively, had no genotype data or were published prior to the availability of CYP2C19*17 identification (Sim et al., 2006). The CYP2C19 genotype distributions in the 11 studies were therefore recalculated, as described in Materials and Methods, to reflect allelic frequencies of the major CYP2C19 genetic variants (i.e., *2, *4, and *17). Consequently, for the eight studies in which CYP2C19*17 was not genotyped, the previous CYP2C19*1/*1 and *1/null genotypes are described in this work as *1/*1 OR *1/*17 OR *17/*17 and *1/null OR *17/null, respectively. With regard to the three studies without CYP2C19 genotype, the study populations were assigned as “All.” A non-PM group was assigned to subjects that were not CYP2C19 null/null carriers.

Observed and predicted mean values of S-mephenytoin plasma concentration-time profiles in CYP2C19*1/*1 and poor metabolizers following a single oral dose of 100 mg racemic mephenytoin. Blue diamonds and green triangles represent observed profiles of CYP2C19 extensive and poor metabolizers, respectively, from Wedlund et al. (1985). Red squares and gray crosses represent observed profiles of CYP2C19 extensive and poor metabolizers, respectively, from Jacqz et al. (1986). Blue and orange solid lines represent predicted profiles of CYP2C19*1/*1 and poor metabolizers, respectively, using the demographic information from CYP2C19 *1/*1 subjects (Sim et al., 2006).

Accuracy of simulated urinary S/R-mephenytoin ratio versus observed data following a single oral dose of 100 mg racemic mephenytoin. All data points are in arithmetic mean. Simulated data are an average of five trials. A total of 30 genetic subpopulations (non-PM) drawn from 14 populations of 12 published studies was used and indicated by an Arabic number: 1Bertilsson et al., 1992 (Chinese), 2He et al., 2002 (Dai Chinese), 3Xiao et al., 1997 (Han Chinese), 4Xiao et al., 1997 (Bai Chinese), 5Goldstein et al., 1997 (Saudi), 6Goldstein et al., 1997 (Filipino), 7Sviri et al., 1999 (Israeli), 8de Morais et al., 1995 (Dong Chinese), 9Sim et al., 2006 (Ethiopian), 10Persson et al., 1996 (Ethiopian), 11Aklillu et al., 2002 (Ethiopian), 12Chang et al., 1995 (Swedish Caucasian), 13Wedlund et al., 1984 (United States Caucasian), 14Sanz et al., 1989 (Swedish Caucasian). When no CYP2C19 genotype data were available (populations 1, 13, and 14), the population was assigned as “All.” Except for the study population 9 (Sim et al., 2006), populations that were previously reported as CYP2C19*1/*1 are described here as *1/*1 OR *1/*17 OR *17/*17, and previous CYP2C19*1/null genotypes are *1/null OR *17/null. Circles are color-coded by genotypes, and each circle represents one genetic subpopulation, with circle size being proportional to the study genetic subpopulation size (see Table 5). Error bars indicate predicted and observed S.D. of the mean. Numerical values of the predicted and observed values for each subpopulation are also presented in Table 5.
Observed and simulated urinary ratio of S/R-mephenytoin following a single oral dose of 100 mg racemic mephenytoin
The observed urinary S/R-mephenytoin ratios varied among the different published studies (Table 5). Among the three studies without genetic information (populations 1, 13, and 14) (Wedlund et al., 1984; Sanz et al., 1989; Bertilsson et al., 1992), the mean of observed ratios ranged twofold (0.18–0.37), and CV values of the ratios were comparable (96–109%). Among the eight studies or 10 populations (populations 2–8 and 10–12) in which only CYP2C19 null alleles were genotyped (Chang et al., 1995; de Morais et al., 1995; Persson et al., 1996; Goldstein et al., 1997; Xiao et al., 1997; Sviri et al., 1999; Aklillu et al., 2002; He et al., 2002), the mean of observed ratios ranged 1.9-, 1.5-, 1.2-, and 1.3-fold for CYP2C19*1/*1 OR *1/*17 OR *17/*17 (0.13–0.23), *1/null OR *17/null (0.21–0.33), null/null (0.97–1.11), and non-PM (0.21–0.29), respectively. Although CV values of the observed ratios were lowered in comparison with those of the three studies without genetic information, they were still high and varied among studies within each genotype, ranging between 57–79, 36–68, 2–7, and 52–70%, respectively.
For all the 37 genetic subpopulations, the predicted mean of urinary S/R-mephenytoin ratio was within 1.5-fold of the observed values except for two; the mean of ratio was predicted within 1.6-fold in a CYP2C19*1/null OR *17/null group, and within 3.2-fold in the CYP2C19*17/*17 group (Fig. 4; Table 5). However, only three CYP2C19*17/*17 individuals with urinary S/R-mephenytoin ratio (Sim et al., 2006) were identified in the literature, which may not be a representative group to compare with the prediction. The predicted CVs for the ratios were within 1.5-fold for 27 non-PM subpopulations and 1.8-fold for only three non-PM subpopulations. CYP2C19 null/null genotype groups were uniformly predicted to have a urinary S/R-mephenytoin ratio of 1 with CV being zero by definition.
Accuracy of Predicted Citalopram Clearance.
The mechanistic model was further validated by simulations using citalopram in which CYP2C19 is a major but not the sole contributor to drug metabolism (i.e., fm = 0.5). Following a single oral dose of 20 mg citalopram, the predicted mean values of citalopram plasma concentration-time profiles reasonably recovered those observed in CYP2C19*1/*1 (Fig. 5). The observed and predicted oral clearances of citalopram based on three published studies (Yu et al., 2003; Yin et al., 2006; Fudio et al., 2010) are shown in relation to CYP2C19 genotypes in Table 6. Because all studies only genotyped CYP2C19 null alleles, the CYP2C19 genotype distributions were recalculated, as described in Materials and Methods, to reflect the allelic frequency of CYP2C19*17. The previous CYP2C19*1/*1 and *1/null genotypes are described in this work as *1/*1 OR *1/*17 OR *17/*17 and *1/null OR *17/null, respectively.

Observed and predicted mean values of plasma concentration-time profiles in CYP2C19*1/*1 and variants following a single oral dose of (A) 20 mg citalopram or (B) 40 mg pantoprazole. (A) Citalopram: the diamonds represent the dose-adjusted profiles of the nongenotyped healthy Caucasians observed from Joffe et al. (1998). Solid and dashed lines represent predicted profiles of CYP2C19*1/*1 and CYP2C19 PM, respectively, based on the demographic information from Fudio et al. (2010). (B) Pantoprazole: blue diamonds and solid line represent observed and predicted profiles of CYP2C19*1/*1 group. Red squares and solid line represent observed and predicted profiles of CYP2C19*1/*2 group. Green triangles and solid line represent observed and predicted profiles of CYP2C19*2/*2 group. Purple crosses and solid line represent observed and predicted profiles of CYP2C19*1/*17 group. Orange circles and solid line represent observed and predicted profiles of CYP2C19*2/*17 group. Black triangles and solid line represent observed and predicted profiles of CYP2C19*17/*17 group. The digitized observations are from Gawronska-Szklarz et al. (2012).
Observed and simulated oral clearance values following a single oral dose of 20 or 40 mg citalopram and 40 mg pantoprazole
As shown in Table 6, among the three published studies, the mean of observed oral clearance was similar within each of the three genotypes, ranging 1.3-, 1.5-, and 1.4-fold for CYP2C19*1/*1 OR *1/*17 OR *17/*17 (20.8–27.2 l/h), *1/null OR *17/null (17–25.6 l/h), and null/null (12.7–19.8 l/h), respectively. CV values of observed oral clearance were consistently small within each genotype among studies, ranging between 23–34%, 19–32%, and 10–21%, respectively. Of the nine genetic subpopulations, all of the mean oral clearances were predicted within 1.5-fold of the observed. The CV values were predicted within 1.7-fold of the observed in seven groups, and failed to be predicted within twofold of the reported in two subpopulations (i.e., the CYP2C19*1/*1 OR *1/*17 OR *17/*17 in Fudio et al., 2010 and the CYP2C19 null/null in Yu et al., 2003).
PK Modeling and Simulations of Pantoprazole.
Next, the mechanistic model was verified by simulations using pantoprazole, a commonly used proton pump inhibitor to which CYP2C19-mediated metabolism makes a major contribution (i.e., fm = 0.8). Following a single oral dose of 40 mg pantoprazole, the predicted mean values of plasma concentration-time profiles reasonably recovered those observed in CYP2C19*1/*1 (Fig. 5B). The observed PK profiles of CYP2C19 variants were well predicted when keeping all parameters constant, except for varying the CYP2C19 abundance values ascribed to CYP2C19 genetics (Fig. 5B). As shown in Table 6, the mean oral clearance values were predicted within 1.5-fold of the observed in all of the six genotypes, and the CV values were predicted within either two- or threefold of the observed, except for the CYP2C19*2/*2 group.
PK Modeling and Simulations of Voriconazole.
Based on the goodness-of-fit criteria specified in Materials and Methods, a two- compartment model with first-order absorption was found to adequately fit the biphasic plasma concentration-time profile of CYP2C19*1/*1 observed in the Weiss et al. (2009) study (Fig. 6; Table 7). Based on eq. 4, k10 of CYP2C19*1/*2, *2/*2, and *1/*17 were calculated as 0.17, 0.098, or 0.43 hour−1, respectively (Table 7). The observed PK profiles of CYP2C19 variants were well predicted when keeping all parameters constant, except for varying the k10 value to reflect changes in drug clearance (Fig. 6). The differences between the observations and predictions were within 25% of the observed values for Cmax, and 30% of the observed values for plasma CLpo (Table 7).
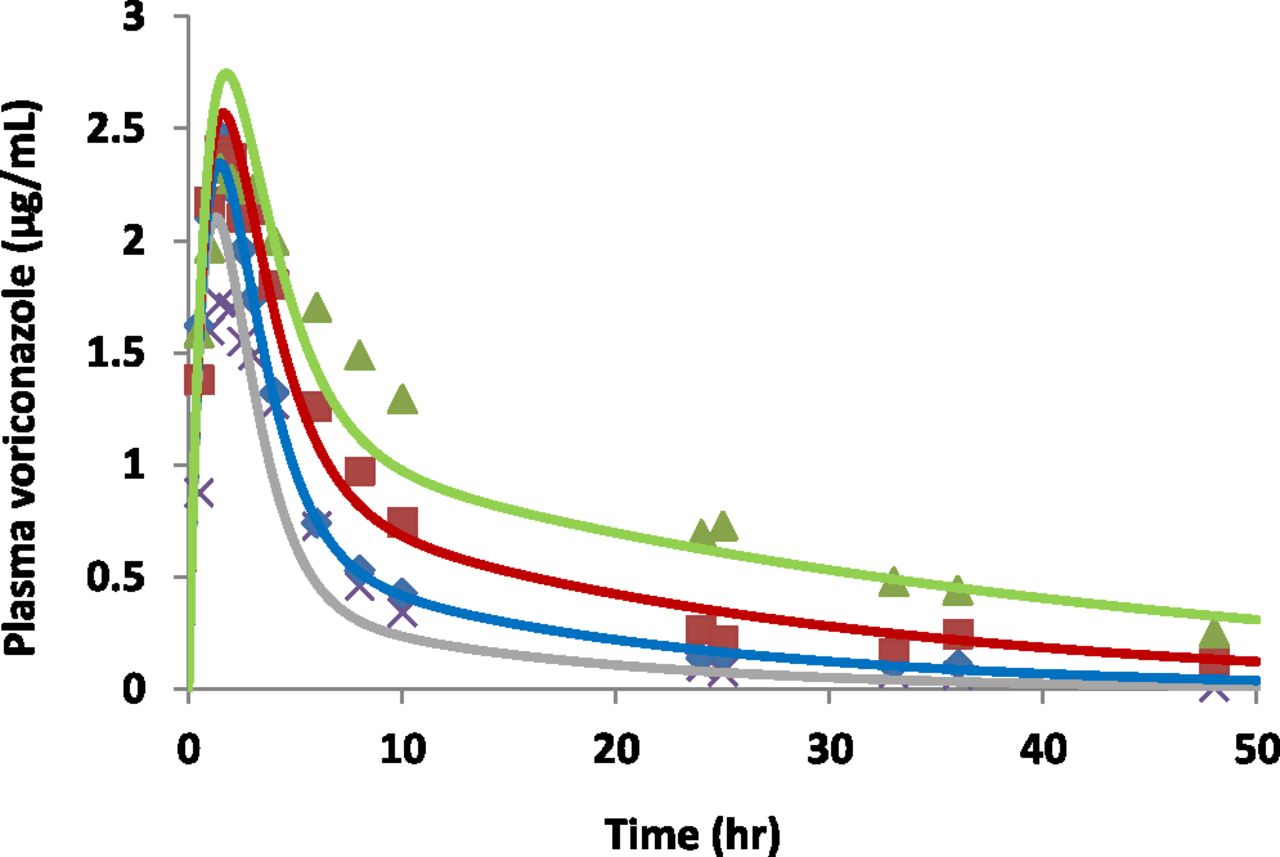
Observed and predicted mean values of voriconazole plasma concentration-time profiles among different CYP2C19 genotypes following a single oral dose of 400 mg voriconazole. Blue diamonds and solid line represent observed and predicted profiles of CYP2C19*1/*1 group. Red squares and solid line represent observed and predicted profiles of CYP2C19*1/*2 group. Green triangles and solid line represent observed and predicted profiles of CYP2C19*2/*2 group. Gray crosses and solid line represent observed and predicted profiles of CYP2C19*1/*17 group. The digitized observations are from Weiss et al. (2009). The modeling and simulations used a two-compartment model with first-order absorption, as described in Materials and Methods. The fitted PK parameters for the CYP2C19*1/*1 group and simulated profiles among different CYP2C19 genotypes were summarized in Table 7.
Observed and predicted pharmacokinetics parameters across CYP2C19 genotypes following a single oral dose of 400 mg voriconazole
A two-compartment model with first-order absorption was found to adequately fit the biphasic plasma concentration-time profiles of CYP2C19*1/*1 observed in the Weiss et al., 2009 study by using Phoenix 64. In the model, the estimated rate of absorption parameter values (k01), rate of elimination from central compartment parameter values (k10), rate of transfer from central to peripheral compartment parameter values (k12), and rate of transfer from peripheral to central compartment (k21) were 0.90, 0.28, 0.29, and 0.14 h−1, respectively.
Discussion
In the present study, we have described the utility of CYP2C19 PGx-based mechanistic modeling in prediction of genotype-dependent human in vivo clearance and associated variabilities for CYP2C19 drugs undergoing multiple clearance pathways. The model builds upon in vivo clearance or PK of wild-type subjects and is then updated to predict PK of variant carriers by incorporating genotype-specific CYP2C19 enzyme abundance. The prediction framework was first tested by a CYP2C19 prototypical substrate (S-mephenytoin, fm,CYP2C19 = 0.99), verified by citalopram (fm,CYP2C19 = 0.5) and pantoprazole (fm,CYP2C19 = 0.8), and then applied to voriconazole (fm,CYP2C19 = 0.65). The subsequent modeling and simulations predicted the mean and variability of urinary S/R-mephenytoin ratio as well as oral clearance of citalopram within twofold of the observed, respectively, in 36 of 37 and nine of nine genetic subgroups (Fig. 4; Tables 5 and 6). Furthermore, the PK profiles of pantoprazole and voriconazole among CYP2C19 genotypes were well predicted by varying the corresponding metabolic clearance based on genotype-dependent changes in hepatic CYP2C19 microsomal abundance (Figs. 5 and 6; Tables 6 and 7). Of note, the urinary S/R-mephenytoin ratio has been demonstrated as a measure of the enantiometric ratio of the plasma concentrations over the same collection period (Jacqz et al., 1986), because renal clearance values of both enantiomers are similar (Wedlund et al., 1984; Tybring and Bertilsson, 1992). Good recovery of observed values by the prediction in a genotype-dependent manner in all four substrates demonstrated the utility of the prediction strategy.
The prediction framework is distinct from other approaches because of integrating the ratios of CYP2C19 enzyme abundance among variants derived from in vitro HLM metabolic data. Previous studies have not systematically characterized the formation of a major metabolite of S-mephenytoin in a large group of genotyped HLMs. In this study, we use the in vitro activity data to approximate relative CYP2C19 enzyme abundance and variability within CYP2C19 genotypes for the subsequent modeling and simulation. This approach is supported by the current assay design and functionalities of CYP2C19 variants within this liver bank. Impact of major CYP2C19 genetic polymorphisms (i.e., *2, *4, and *17) is manifested through altered CYP2C19 abundance (de Morais et al., 1994; Ferguson et al., 1998; Sim et al., 2006), which was mirrored by the differential formation of 4′-OH S-mephenytoin among genotypes in HLMs. The latter was primarily ascribed to differences in velocity that is proportional to CYP2C19 abundance, as the metabolite formation was measured at one S-mephenytoin concentration (i.e., 50 µM) that approximates the average Km of all non-PM HLMs (Table 4). The CYP2C19-mediated metabolic activity within each HLM was further refined by subtracting that of the non-CYP2C19, as a markedly different Km was shown in CYP2C19*2/*2 HLMs, indicating the involvement of other P450(s) (Table 4). This refinement is important because the mechanistic model of omeprazole appeared to overpredict the exposure ratios of CYP2C19 extensive and poor metabolizers (Wu et al., 2014). The prediction could be improved if a low CYP2C19 activity were assigned to the PM, as done in this work. Our study has demonstrated the utility of HLMs in quantitative prediction of in vivo CYP2C19 genetic impact. To consider detailed CYP2C19 genotype information is an important contributing factor to the accurate genotype-specific prediction.
Regarding the successful prediction of clearance variability (Tables 5 and 6), it may be that the HLM metabolic data from each genotype well represent the respective population because a large group of livers enriched with major CYP2C19 variants was used. The experimental variability from activity assays only contributed to 0.4–5% of the total variability within each genotype (data not shown), indicating that the observed CV values of CYP2C19 activities predominantly reflect those among interindividuals rather than assays. To increase power, we have pooled metabolic data within each genotype regardless of demographics that did not significantly affect CYP2C19 activity. This approach is supported by findings that CYP2C19 activities in approximately 150 HLMs were not associated with age, gender, or ethnicity (Parkinson et al., 2004). The insignificance of ethnicity in CYP2C19 activity is also shown by the comparable metabolic ratio of CYP2C19 substrates within genotypes between Caucasians and Asians (Myrand et al., 2008). However, we cannot totally exclude the possibility that the in vitro variability of CYP2C19 abundance was merely applicable to SimCYP, because the validation was based on SimCYP in which variability of some parameters such as CYP3A has been optimized (Cubitt et al., 2011). When there is insufficient literature information to build a PGx-based voriconazole SimCYP model (data not shown), we did not project voriconazole PK variability across genotypes in other software using the in vitro data, as the prediction outcome may not be comparable with those from SimCYP.
The CYP2C19 PGx-based framework is structured using the in vivo clearance or PK of wild-type subjects. This was achieved either by retrograde method to back-calculate CYP2C19 CLint,u of wild-types from clinical data (S-mephenytoin, citalopram, and pantoprazole in SimCYP), or by fitting CYP2C19*1/*1 PK to a two-compartment model (voriconazole). This strategy has overcome the underprediction issues associated with CYP2C19 IVIVE alone (Howgate et al., 2006). We failed to predict the in vivo clearance of S-mephenytoin within its twofold based on 4′-OH S-mephenytoin formed in wild-type HLMs after correcting for unbound fraction in incubations or albumin effects (data not shown), as albumin addition is postulated to improve CYP2C9 IVIVE by sequestrating long-chain fatty acids (Rowland et al., 2008). The key assumption of this modeling strategy is that only CLint,u,CYP2C19 of variants change without adjusting the model structure and other parameters.
Consistent with our predictions, a top-down approach using clinical drug exposure in different genetic subgroups predicted effects of CYP2C19 genotypes as 2.03, 1.59, 1.00, 0.80, 0.30, and 0.005, respectively, in CYP2C19*17/*17, *1/*17, *1/*1, *17/null, *1/null, and null/null genotype (Goutelle et al., 2013). Moreover, for a genotype CYP2C19*17/null with controversial metabolic status (Rudberg et al., 2008; de Vos et al., 2011; Harmsze et al., 2012), both methods predicted the metabolic activity as 0.83 relative to the wild-type, suggesting its phenotype is more of an extensive metabolizer than an intermediate metabolizer. In another study, interindividual variability in hepatic CLint of CYP2C19 substrates within genotypes was estimated from reported drug exposure levels using Monte Carlo simulations (Chiba et al., 2014). However, many of the literature clinical studies only measured exposure of parent drugs, whose changes reflected the composite impact and variability of multiple clearance pathways, because these CYP2C19 drugs rarely depend on CYP2C19 metabolism alone. Thus, in contrast to our PGx-based mechanistic approach, the top-down approach could not accurately assess the exposure changes in relation to CYP2C19 genotypes. Neither could it differentiate experimental variability from intrinsic interindividual variability. In the present study, considerable variabilities in activity remained within each CYP2C19 genotype, which also differed across genotypes (Fig. 2), implicating the contribution of additional factors. This is consistent with previous findings that major determinants of interindividual variability in the CYP2C19 mRNA level may include microRNA (Lamba et al., 2014), global regulators, and environmental inducers for activation of the constitutive androstane receptor/pregnane X receptor pathway (Wang et al., 2011a).
Furthermore, the PGx-based mechanistic modeling may aid drug development. In early- phase clinical studies, mechanistic models can be built through integrating in vivo clearance or PK of wild-type (or ungenotyped) populations and P450 fractional clearance predicted by in vitro methodology. The framework can then be modified to predict PK of variant carriers by incorporating relevant PGx impact. The model is continually updated as more data becoming available, and may be used to predict outcomes of PGx and drug-drug interaction trials and impact dose adjustment, as recently illustrated (Eliglustat, 2014). Overall, the current PGx-based framework may evaluate the impact on the PK/PD of new molecule entities by altered activity of CYP2C19 and potentially other P450s due to PGx or drug-drug interactions, which may aid clinical trial design, predict trial outcomes, and ultimately influence dose adjustment in drug labels and clinical practice.
Our study has several limitations. First, interindividual variability in the observed urinary S/R-mephenytoin ratio may be affected by environmental factors (Zhang et al., 1991), which may compromise its benchmarking value. Second, we had to randomly assign genotypes for some S-mephenytoin and citalopram studies according to literature-reported allelic frequency assuming Hardy–Weinberg equilibrium. This may bias genotype-phenotype relationships and weaken our conclusions. Lastly, the present prediction framework is applicable to modeling genetic impact of 2C19*2-*8 and *17 that only alter protein expression (Solus et al., 2004). For CYP2C19 variants with altered substrate affinity in addition to protein expression (Wang et al., 2011b), in vitro metabolic data from HLMs carrying such variants should be collected as in the present study and then incorporated into the prediction framework as demonstrated in the CYP2B6 PGx-based modeling (Xu et al., 2013).
In conclusion, relative CYP2C19 genotype-dependent hepatic activity and variability were quantified in vitro and used in a PGx-based mechanistic framework to predict in vivo clearance and its variability in a genotype-dependent manner for CYP2C19-metabolized drugs in context of other clearance pathways. The mechanistic model may be readily applied to drug development to facilitate PK variability prediction, PGx and drug-drug interaction trial design, and prediction for CYP2C19 substrates.
Acknowledgments
The authors thank Steve Wrighton and Barbara Ring for long-term efforts to establish this human liver tissue bank. The authors also thank Jeff Weber for performing the in vitro CYP2C19 kinetic assays; Olukayode A. Oluyedun for conducting the bioanalytical assays; Philip Iversen for performing the statistical analyses; and Gemma Dickinson, Patricia Turner, and Jessica Rehmel for the helpful discussion during the modeling and simulation.
Authorship Contributions
Participated in research design: Steere, Hall, Guo.
Conducted experiments: Steere, Baker, Guo.
Performed data analysis: Steere, Baker, Guo.
Wrote or contributed to the writing of the manuscript: Steere, Hall, Guo.
Footnotes
- Received October 16, 2014.
- Accepted April 6, 2015.
All authors are employees of Eli Lilly and Company.
A portion of this work was previously presented as follows: Steere B et al. (2014) Quantitative Prediction of in vivo CYP2C19 Activity and Inter-individual Variability in Different CYP2C19 Genotypes. The American Society for Clinical Pharmacology and Therapeutics; 2014 March 18–22; Atlanta, GA; and was published in abstract form: Steere B et al. (2014) Quantitative Prediction of in vivo CYP2C19 Activity and Inter-individual Variability in Different CYP2C19 Genotypes. Clin Pharmacol Ther 95:S116.
↵
 This article has supplemental material available at dmd.aspetjournals.org.

Abbreviations
- HBD
- hydrogen bond donor
- HLM
- human liver microsomal sample
- IS
- internal standard
- IVIVE
- in vitro–in vivo extrapolation
- LC/MS
- liquid chromatography–tandem mass spectrometry
- P450
- cytochrome P450
- PD
- pharmacodynamics
- PGx
- pharmacogenetics
- PK
- pharmacokinetics
- PM
- poor metabolizer
- PSA
- polar surface area
- Var
- variance
- Copyright © 2015 by The American Society for Pharmacology and Experimental Therapeutics


