


Abstract
In this study, induction and inhibition of rhesus monkey CYP3A64 versus human CYP3A4 were characterized in vitro, and the corresponding pharmacokinetic consequences were evaluated in rhesus monkeys. In monkey hepatocytes, rifampin markedly induced CYP3A64 mRNA (EC50 = 0.5 μM; Emax = 6-fold) and midazolam (MDZ) 1′-hydroxylase activity (EC50 = 0.2 μM; Emax = 2-fold). Compound A (N-[2(R)-hydroxy-1(S)-indanyl-5-[2(S)-(1,1-dimethylethylaminocarbonyl)-4-[(furo[2,3-b]pyridin-5-yl)-methyl]piperazin-1-yl]-4(S)-hydroxy-2(R)-phenylmethylpentanamide), a known potent and mechanism-based inhibitor of CYP3A4, strongly inhibited the formation of 1′-hydroxy MDZ by recombinant CYP3A64 in a concentration- and time-dependent manner (KI = 0.25 μM; kinact = 0.4 min–1). Similar corresponding results also were obtained with human CYP3A4 in the presence of rifampin or compound A. In rhesus monkeys, MDZ exhibited a relatively high metabolic clearance (primarily via 1′-hydroxylation followed by glucuronidation) and a low hepatic availability (Fh = 16%). Consistent with the induction of hepatic metabolism of a high-clearance compound, pretreatment with rifampin (18 mg/kg p.o. for 5 days) did not significantly affect the i.v. kinetics of MDZ, but caused a pronounced reduction (∼10-fold) in the systemic exposure to MDZ and, consequently, its Fh following intrahepatic portal vein administration (i.pv.) of MDZ. A comparable extent of the pharmacokinetic interaction also was obtained after a 1.8 mg/kg rifampin dose. Also consistent with the in vitro CYP3A64 inhibition finding, compound A (6 mg/kg i.v.) markedly increased (10-fold) the i.pv. administered MDZ exposure. At the doses studied, plasma concentrations of rifampin or compound A reached or exceeded their respective in vitro EC50 or KI values. These findings suggest the potential applicability of the in vitro-in vivo relationship approach in rhesus monkeys for studying CYP3A-mediated interactions in humans.
Many severe adverse drug responses following multiple drug therapies have been reported to be associated with pharmacokinetic drug interactions (Lesar et al., 1997; Dresser et al., 2000). Inhibition of drug-metabolizing enzymes, primarily CYP3A, is the main reason for drug interactions reported in the literature (Thummel and Wilkinson, 1998; Dresser et al., 2000). Induction of CYP3A, although less common, is also known to cause profound clinical effects, either by reducing therapeutic efficacy of drugs or enhancing toxicity from toxic or reactive metabolites (Thummel and Wilkinson, 1998). CYP3A4 is the most abundant of all the human isoforms and catalyzes the metabolism of a large number of compounds including clinically important pharmaceuticals. Accordingly, during lead optimization and identification in early drug discovery processes, the potential for new chemical entities to cause CYP3A4 inhibition and induction is usually assessed, primarily in vitro using human tissue preparations (Weaver, 2001; Worboys and Carlile, 2001). Such in vitro studies are widely accepted to have potential in identifying the likelihood of drug interactions in vivo (Tucker et al., 1998; Bjornsson et al., 2003). However, to help in drug candidate selection, there is often a need to prospectively predict, based on the in vitro results, the likely extent of drug interactions and subsequent clinical importance. Although there have been several successful quantitative predictions reported for drug interactions mediated via enzyme inhibition, these are mainly retrospective and not applicable to all cases (Houston and Galetin, 2003; Ito et al., 2004). To date, systematic extrapolations of the in vitro data to in vivo situations have not been extensively attempted for drug interactions mediated via enzyme induction (Bjornsson et al., 2003).
One of the general approaches commonly used to help form or verify a basis for extrapolating in vitro human data to clinical outcomes during early drug development involves in vitro-in vivo assessments in an animal model under conditions reflective of a likely therapeutic scenario (Kanazu et al., 2004). Such an in vitro-in vivo preclinical model is also highly desirable in a later development stage to help provide a mechanistic insight for the interpretation of interactions observed clinically (Prueksaritanont et al., 2002). For metabolic interaction studies, this approach requires that the animal model possesses similarities to humans with respect to enzymatic activities, in the absence and presence of an enzyme inducer or inhibitor of interest, as well as the basic in vivo absorption, distribution, metabolism, and excretion characteristics of a selected probe substrate. In this regard, rhesus monkeys (Macaca mulatta) and cynomolgus monkeys (Macaca fascicularis), nonhuman primates widely used in the pharmaceutical industry for preclinical evaluations of drug absorption and disposition as well as safety and toxicity, have generally been considered to be more appropriate animal models than rodents for drug metabolism studies, based on the sequence and functional activity similarities of drug-metabolizing enzymes (Sharer et al., 1995; Igarashi et al., 1997; Kanazu et al., 2004). Recently, rhesus monkey CYP3A64 has been cloned and characterized in vitro, in comparison with human CYP3A4 and members of CYP3A from other preclinical species (Carr et al., 2006). The results showed that CYP3A64 was most similar, in protein sequences and functional activities, to human CYP3A4, suggesting that the rhesus monkey may serve as a valuable preclinical model to assess CYP3A-mediated drug interactions. However, the susceptibility of CYP3A64 to known enzyme inhibitors and inducers, both in vitro and in vivo, has not been studied.
Thus, to help assess the potential utility of the rhesus monkey as a preclinical model for studying CYP3A-mediated drug interactions, we set out to evaluate 1) the in vitro induction and inhibition susceptibility profiles of rhesus monkey CYP3A64, relative to human CYP3A4; 2) the corresponding in vivo pharmacokinetic consequences; and 3) the respective in vitro-in vivo induction and inhibition relationships in rhesus monkeys. Rifampin, a potent inducer of CYP3A4 (Niemi et al., 2003) and compound A (structure shown in Chiba et al., 1995), previously shown to be a potent and selective CYP3A4 inhibitor (Chiba et al., 1995; Lin et al., 1995), were chosen as a model inducer and inhibitor, respectively. Midazolam (MDZ), a well established and highly sensitive in vivo CYP3A4 probe in humans (Thummel et al., 1994; Bjornsson et al., 2003) was used as an in vitro and in vivo CYP3A marker substrate in this study.
Materials and Methods
Materials. MDZ, 1′-hydroxy (1′-OH) and 4-hydroxy (4-OH) MDZ, diazepam, and rifampin were obtained from Sigma (St. Louis, MO). Compound A (N-[2(R)-hydroxy-1(S)-indanyl-5-[2(S)-(1,1-dimethylethylaminocarbonyl)-4-[(furo[2,3-b]pyridin-5-yl)-methyl]piperazin-1-yl]-4(S)-hydroxy-2(R)-phenylmethylpentanamide; Chiba et al., 1995) was synthesized at Merck Research Laboratories (West Point, PA). All other reagents were of analytical or high-performance liquid chromatography grade. Human recombinant CYP3A4 and rhesus monkey CYP3A64 generated in-house at Merck Research Laboratories were expressed using Invitrogen's (Carlsbad, CA) Bac-to-Bac expression system (Carr et al., 2006). The expression system uses Sf21 insect cells infected with baculoviruses containing CYP3A4 or CYP3A64 and NADPH oxidoreductase (OR). The expression system contained OR and P450 at a final molar ratio of 3 (OR:P450). Fresh human hepatocytes from six different donors (Caucasian males and females, aged 14–69 years) were obtained from commercial sources (CellzDirect, Tucson, AZ; In Vitro Technologies, Baltimore, MD; and Tissue Transformation Technologies, Edison, NJ) in 24-well culture plates, whereas rhesus monkey hepatocytes were prepared in-house according to the method of Moldeús et al. (1978). The basal Hepatocyte Culture Medium used in our studies was custom made and obtained from JRH Biosciences (Lenexa, KS). It was modified from that described in Dich and Grunnet (1990) by adding 10 ml/l of nonessential amino acids (Invitrogen), 1× penicillinstreptomycin-glutamine (Invitrogen), 4 g/l sodium bicarbonate (Sigma), 10 ml/l insulin-transferrin-selenium premix (BD Biosciences, San Jose, CA), and 10 nM dexamethasone.
In Vitro Induction Studies. The study was conducted using rhesus monkey and human hepatocytes as described previously (Prueksaritanont et al., 2005). In brief, hepatocyte cultures were treated, in triplicate for each treatment, for 2 days with culture media containing rifampin or vehicle control (DMSO, 0.1% v/v). Over the treatment period, dosing media were changed daily, and at the end of the treatment (48 h), medium was aspirated from wells and plates were either stored at –70°C for later RNA isolation and quantitation by a two-step reverse transcription-polymerase chain reaction (PCR), or replaced with Hanks' balanced salt solution supplemented with 10 mM HEPES buffer and returned to the incubator for 10 min, after which the buffer was aspirated and replaced with 10 mM HEPES buffer containing enzyme marker substrates for measuring enzyme activities (see below).
Total RNA was isolated using the RNeasy kit (QIAGEN, Valencia, CA) according to the manufacturer's protocol, and quantitated using Quant-iT RiboGreen RNA reagent kit (Molecular Probes, Eugene, OR). The yield was normal and the quality of RNA was indicated by polymerase chain reaction (PCR) results obtained. A two-step reverse transcription-PCR was conducted by reverse-transcribing 50 ng of total RNA to cDNA using TaqMan Reverse Transcription Reagents with random hexamer primers, as described previously (Prueksaritanont et al., 2005). TaqMan primers and probes were designed using Primer Express Software v1.0 (PE Applied Biosystems, Foster City, CA) and GenBank accession numbers M18907 and AY334551 for CYP3A4 and CYP3A64, respectively. The primer sequences for the CYP3A4 TaqMan set were: forward, 5′-GTGTGTTTCCAAGAGAAGTTACAAATTT-3′; reverse, 5′-CCACTCGGTGCTTTTGTGTATC-3′; and probe, 5′-5-carboxyfluorescein-CGAGGCGACTTTCTTTCATCCTTTTTACAGA-6-carboxytetramethylrhodamine-3′. The corresponding sequences for CYP3A64 were: forward, 5′-CACAAACCGGAGGCCTTTT-3′; reverse, 5′-TCTTCCATTCTTCATCCTCAGCTA-3′; and probe, 5′-5-carboxyfluorescein-TCCAGTGGGATTTATGAAAAATGCCATCTCT-6-carboxytetramethylrhodamine-3′. The CYP3A4 TaqMan set was designed to be CYP3A4-specific and was validated for specificity against plasmid DNAs containing the CYP3A4, CYP3A5, and CYP3A7 genes. The CYP3A64 set was validated against plasmid DNA containing the CYP3A64 gene. Quantitation of the target cDNA in treated samples versus DMSO (vehicle) control samples was calculated by correcting for the 18 rRNA in each sample (ΔCt) using the equation: Fold Change = 2–ΔΔCt. 18S gene is a commonly used internal standard or housekeeping gene, and we and others (Koch et al., 2002) have found it to be less sensitive to variability due to cell toxicity and induction.
Testosterone 6β-hydroxylase and MDZ 1′-hydroxylase activities in cultured hepatocytes were measured, in triplicate, by incubating testosterone (250 μM) or MDZ (20 μM) with human or rhesus hepatocytes in 10 mM HEPES buffer, at 37°C, 95% humidity, and 5% CO2, for 15 to 30 min and 15 to 20 min, respectively. Kinetic studies with testosterone or MDZ were also conducted under similar conditions, but with various substrate concentrations. Samples from each well were transferred to a 96-well plate containing an equal volume of acetonitrile, and stored at 4°C until analysis by high pressure liquid chromatography for testosterone (Prueksaritanont et al., 2005) or liquid chromatography coupled with tandem mass spectrometry (LC-MS/MS) for MDZ (see below).
In Vitro Inhibition Studies. All incubations were performed in triplicate. MDZ hydroxylation was assayed in 0.2 ml of an incubation mixture, containing 10 pmol of recombinant CYP3A4 or CYP3A64, 20 mM MgCl2, 1 mM NADPH, and 0.1 M phosphate buffer, pH 7.4. Four-microliter aliquots of 50% aqueous acetonitrile (control) or various concentrations of compound A in 50% aqueous acetonitrile were coincubated with MDZ. MDZ was prepared in 50% aqueous acetonitrile solutions from which 4-μl aliquots were taken to generate final concentrations of 5 μM, a value close to its Km value (Carr et al., 2006). In a separate experiment, a time-dependent inhibitory effect of compound A on CYP3A activity was examined using 75 pmol of recombinant CYP3A64 or CYP3A4 preincubated with 5 μM compound A, 1 mM NADPH, and 0.1 M phosphate buffer, pH 7.4, at 37°C for various times. An aliquot of this incubate was diluted 10-fold with buffer containing 1 mM NADPH before the addition of 20 μM MDZ to start the reaction. To determine enzyme inactivation kinetics, procedures similar to those described above were followed, but with 50 pmol of CYP3A64 or CYP3A4, and various concentrations of compound A, at a preincubation time of 5 min. For all experiments, incubations were conducted at 37°C and were terminated after 5 min by the addition of acetonitrile (0.2 ml per 0.2-ml incubation). The acetonitrile extracts were analyzed by an LC-MS/MS method (see below).
In Vivo Studies. All studies were reviewed and approved by the Merck Research Laboratories Institutional Animal Care and Use Committee. The in vivo studies were carried out in four rhesus monkeys (all male, body weight 4–7 kg) in a crossover fashion, with at least a 2- to 3-week washout period. The same four animals were used in all studies described below. In the first two periods, the animals were pretreated with either vehicle (PEG 400) or rifampin (18 and 1.8 mg/kg p.o., in PEG 400; total volume given, 5 ml), once daily for 5 days. The animals were fasted overnight before MDZ administration on day 5. On the morning of day 5, MDZ was administered intraportally (i.pv.) to a cannulated hepatic portal vein at 0.5 mg/kg/h (using 1 ml/kg/h) for 4 h to monkeys, and blood samples were collected via a saphenous or femoral vein at predose, and 60, 120, 150, 180, 200, 220, 240 (end of i.pv. infusion), 270, 300, 360, and 420 min after MDZ administration. Plasma samples were separated immediately at 10°C and kept frozen at –20°C. Urine samples also were collected for up to 48 h after MDZ administration. In subsequent periods, studies were conducted by i.v. administration of MDZ (0.5 mg/kg/h for 4 h) via a cephalic vein on day 5 in animals pretreated with the vehicle PEG 400 and rifampin (18 mg/kg p.o. in PEG 400) for 5 days.
Subsequently, similar studies using a lower i.pv. dose of MDZ were conducted in control monkeys and those treated with compound A, instead of rifampin. In these studies, the same animals were given a single dose of compound A at 6 mg/kg i.v. or vehicle about 10 min before the i.pv. administration of MDZ at 0.15 mg/kg/h for 4 h. The lower dose of MDZ was used to minimize potential pharmacological activities resulting from an anticipated increase in the exposure of MDZ by compound A. For each period, blood samples were collected after MDZ administration at predose and 60, 120, 150, 180, 200, 220, 240 (end of i.pv. infusion), 270, 300, 360, and 480 min. Plasma samples were separated immediately at 10°C and kept frozen (–20°C) before analysis.
Analytical Procedures for MDZ and Its Metabolites, Rifampin, and Compound A. Concentrations of MDZ, 1′-OH MDZ, 4-OH MDZ, glucuronide conjugates of the two hydroxy MDZ, rifampin, and compound A in plasma and/or urine were analyzed using LC-MS/MS. Plasma samples were spiked with an internal standard, diazepam, and proteins were precipitated with acetonitrile (acetonitrile/sample = 2:1 v/v). After centrifugation, the supernatant was subjected directly to LC-MS/MS analysis. Urine samples were diluted with blank urine for the high-concentration samples and added with diazepam before analysis. The analytes were quantitated by LC-MS/MS in selective reaction monitoring mode using an AB/MDS SCIEX API 3000 tandem mass spectrometer (MDS Sciex, Concord, ON, Canada) interfaced with a SCIEX Turbo IonSpray source to a PerkinElmer Series 200 liquid chromatography system (PerkinElmer Life and Analytical Sciences, Boston, MA). Chromatography was accomplished on a Betasil C18 column (2.1 × 50 mm, 5 μm; Thermo Electron Corporation, Waltham, MA) using a mobile phase consisting of 90% acetonitrile in water (solvent B) and 10% acetonitrile in 0.02% acetic acid (pH 4.5, solvent A). The mobile phase was delivered at a flow rate of 0.5 ml/min, with a linear increase of solvent B from 15% to 90% over 1 min, and held at 90% for an additional minute. Equilibration was allowed for an additional 1.5 min, giving a total chromatographic run time of 3.5 min. Selective reaction monitoring experiments in the positive ionization mode were performed using a dwell time of 150 ms per transition to detect the following precursor (Q1) to product (Q3) ion pairs: 326 to 291, 342 to 203, 342 to 234, 518 to 203, 518 to 234, 823 to 399, 654 to 421, and 285 to 193 for MDZ, 1′-OH MDZ, 4-OH MDZ, 1′-OH MDZ glucuronide, 4-OH MDZ glucuronide, rifampin, compound A, and the internal standard diazepam, respectively. Calibration curves (5–5000 ng/ml) were prepared by plotting the appropriate peak area ratios against the concentrations of analyte in plasma using a weighted (1/x) quadratic regression. The concentration of the analyte in the unknown samples was determined by interpolation from the standard curve. For each analyte, standard curves showed satisfactory linearity and precision (<15% coefficient of variation). Due to lack of synthetic standards for glucuronide conjugates of 1′-OH MDZ and 4-OH MDZ, quantification of these glucuronides in urine samples was carried out as follows. An aliquot of a urine sample from a monkey treated with MDZ was hydrolyzed by β-glucuronidase (5000 unit/ml urine, 37°C for 24 h). Analysis by LC-MS confirmed the complete hydrolysis of the conjugates to 1′-OH and 4-OH MDZ, which were then quantified with their respective standard curves. The difference in the two hydroxy MDZ amounts determined after and before hydrolysis was considered as the amounts of the respective glucuronides in that urine sample. This quantified urine sample was kept at –20°C for the generation of standard curves for those conjugates in all urine samples.
Data Analysis. Apparent Km and Vmax values were estimated using a nonlinear regression program (Enfit from Biosoft, Ferguson, MO). The CLint values were estimated by dividing Vmax by Km. The concentration of rifampin producing a 50% increase in MDZ 1′-hydroxylase activity (EC50) was determined using nonlinear regression analysis (PCNONLIN; Scientific Consulting, Cary, NC), based on the following relationship: E = Emax × C/(C + EC50), where E and Emax are the effects and maximal effects (expressed as -fold over control), respectively, measured in the presence of rifampin (at concentration C). The kinetic parameters (Kinact and KI) of CYP3A4/CYP3A64 inactivation were determined using standard procedures as described previously (Chiba et al., 1995; Prueksaritanont et al., 1998).
The area under the plasma concentration-time profile (AUC0-last) was calculated from time 0 to the last detectable sampling time using the linear trapezoidal rule. The apparent terminal half-life (t1/2) was estimated by dividing 0.693 by the elimination rate constant determined using least-squares regression analysis of the log-linear portion of the MDZ plasma concentration-time data. Clearance (CL) values for MDZ were calculated as the i.v. dose divided by the AUC from time 0 to infinity (AUC0-inf). Hepatic availability (Fh) was estimated by dividing AUC of MDZ obtained after i.pv. administration to that obtained by i.v. administration. Volume of distribution at steadystate (Vdss) values were estimated by conventional moment analysis as i.v. dose multiplied by the first moment of the plasma concentration-time profile and divided by (AUC0-inf)2. The peak plasma concentration (Cmax) was determined by observation.
Statistical Analysis. Statistical analysis was performed using a two-tailed pair t test. A p value of <0.05 was considered statistically significant.
Results
In Vitro Induction of CYP3A64 and CYP3A4 by Rifampin. Cultured hepatocytes, currently the accepted and recommended method for studying P450 induction (LeCluyse, 2001; Bjornsson et al., 2003), were used in this study. Under the present experimental conditions, rifampin, at 10 μM, induced markedly (∼5- to 10-fold) the mRNA level of CYP3A64 and modestly (∼1.5- to 2-fold) MDZ 1′-hydroxylase activity, in all six monkey hepatocyte preparations (Fig. 1A). The relatively low -fold induction at the functional activity level is consistent with a previous observation in this species (Wen et al., 2002). Under similar conditions, rifampin, at 10 μM, also appreciably increased CYP3A4 mRNA expression (∼6- to 14-fold; Fig. 1B) and activity (∼3- to 10-fold), as measured by testosterone 6β-hydroxylation (Fig. 1B) in all six human hepatocyte preparations. In some subjects, the MDZ 1′-hydroxylase activity also was measured, and results similar to those of testosterone 6β-hydroxylase were obtained (not shown). These results were consistent with those reported earlier with rifampin in cultured human hepatocytes (LeCluyse, 2001; Luo et al., 2003).
Further studies on effects of various concentrations of rifampin revealed that rifampin was a potent inducer of CYP3A64. In hepatocyte preparations from two individual monkeys, the mean (range) EC50 values for CYP3A64 mRNA and MDZ 1′-hydroxylase activity were approximately 0.5 (0.4–0.6) and 0.2 (0.2–0.2) μM, respectively. The corresponding mean (range) Emax values were 6 (6 and 6) and 2.2 (1.8 to 2.7)-fold, respectively, over control values (Fig. 2A). Similar results also were obtained with the testosterone 6β-hydroxylase activity (Fig. 2A). Additional detailed studies on kinetics of MDZ metabolism in monkey hepatocytes suggested that 10 μM rifampin treatment had little effect on the apparent Km, but increased (∼2-fold) the Vmax for both 1′- and 4-OH MDZ (Fig. 2B). Values for the Km for 1′-OH MDZ and 4-OH MDZ formation ranged from 1.5 to 2 μM and 3.3 to 4.8 μM, respectively, in both the vehicle-treated and rifampin-treated monkey hepatocytes. The corresponding Vmax values were 0.011 and 0.026 nmol/min/well for 1′-OH MDZ and 0.003 and 0.011 nmol/min/well for 4-OH MDZ, for the vehicle control and rifampin treatment, respectively. Consequently, the resulting intrinsic clearance (Vmax/Km) was increased by about 2-fold, comparable to the aforementioned Emax value obtained with a single concentration (20 μM) of MDZ (Fig. 1A).

Effect of 10 μM rifampin on CYP3A64 or CYP3A4 mRNA expression and testosterone 6β-hydroxylase and/or MDZ 1′-hydroxylase activity in rhesus monkey (A) and human (B) hepatocytes from six different individuals. Results are the mean of triplicate determinations. Testosterone 6β-hydroxylase or MDZ 1′-hydroxylase activity was determined using 250 μM testosterone or 20 μM MDZ, respectively. N/A, data not available.
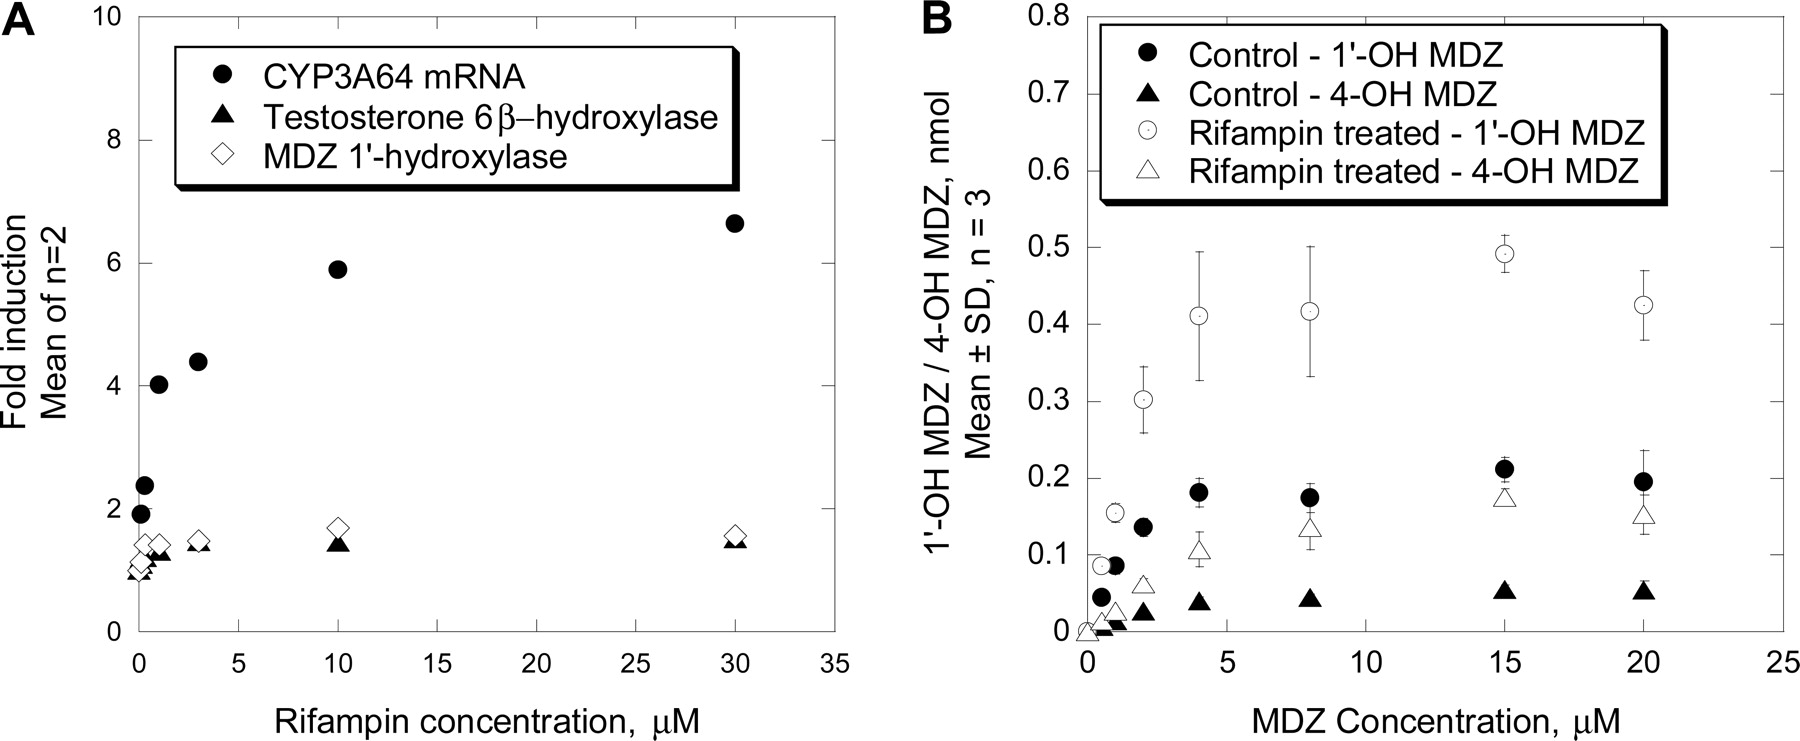
Effect of various rifampin concentrations on CYP3A64 mRNA expression, and testosterone 6β-hydroxylase and MDZ 1′-hydroxylase activity in rhesus monkey hepatocytes isolated from two individual subjects (A), and kinetics of 1′-OH and 4-OH MDZ formation in rhesus monkey hepatocytes treated with vehicle (DMSO, control) or rifampin (10 μM) for 48 h (B). Results shown in A are the mean of two individual subjects, each determined in triplicate, using 250 μM testosterone or 20 μM MDZ as a marker substrate. Results shown in B are mean ± S.D. of triplicate determinations from one individual subject. Formation of 1′-OH and 4-OH MDZ was determined after incubation with various concentrations of MDZ for 20 min.
In Vitro Inhibition of CYP3A64 and CYP3A4 by Compound A. In incubations with recombinant CYP3A64 and CYP3A4, compound A suppressed the formation of 1′-OH MDZ in a concentration-dependent fashion, with comparable potency; the IC50 values (∼1 μM) determined using 5 μM MDZ substrate concentration were essentially identical between the two systems (data not shown). The inhibitory effect of compound A on CYP3A64-mediated MDZ 1′-hydroxylase activity was also time-dependent, similar to that obtained with CYP3A4 (Fig. 3, A and B) and consistent with the earlier finding in human liver microsomes (Chiba et al., 1995). Enzyme kinetics studies suggested that compound A was a potent and efficient mechanism-based inhibitor of both CYP3A64 and CYP3A4, as measured by MDZ 1′-hydroxylase activity, relative to known mechanism-based inhibitors (Ernest et al., 2005); values for KI were 0.25 and 0.4 μM, and kinact values were 0.4 and 0.7 min–1, for CYP3A64 and CYP3A4, respectively. Interestingly, comparable results also were obtained in our preliminary study with monkey and human liver microsomes; values for KI were 0.15 and 0.26 μM, and kinact values were 0.4 and 0.7 min–1, respectively (data not shown), consistent with the notion that compound A is a selective CYP3A inhibitor (Chiba et al., 1995).

Concentration- and time-dependent inhibitory effect of compound A on MDZ 1′-hydroxylase activity mediated with recombinant CYP3A64 (A) and CYP3A4 (B). Results are expressed as percentage of control values (means of triplicate determinations) and were obtained after preincubation of compound A, NADPH, and liver microsomes at 37°C; at various preincubation times, the incubation mixture was diluted 10-fold with buffer before the addition of MDZ (20 μM) and NADPH to start the reaction.

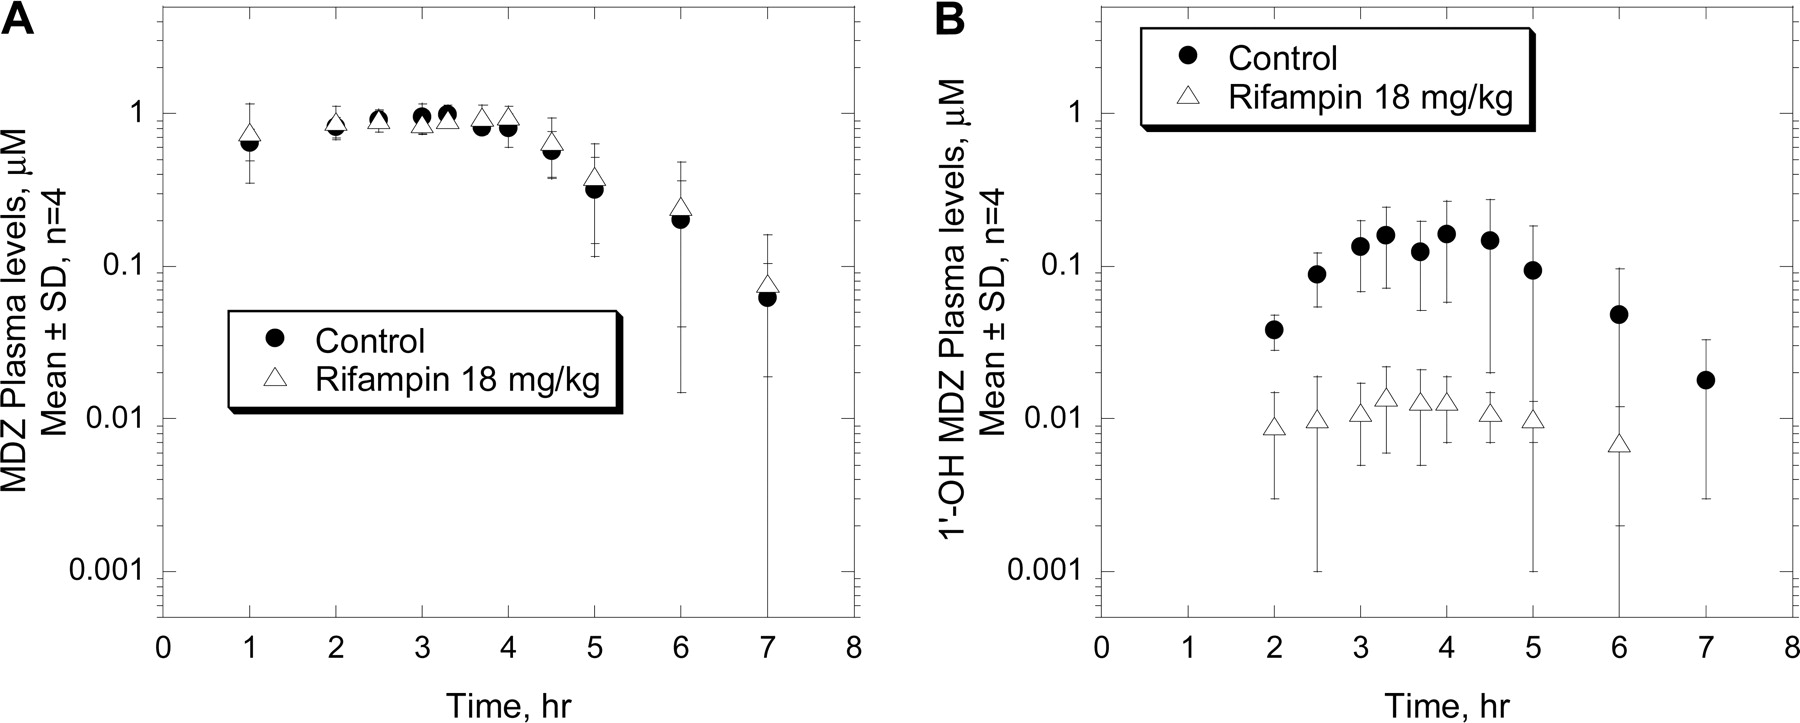
Mean plasma concentration-time profiles of MDZ (A) and 1′-OH MDZ (B) after i.v. administration of MDZ (0.5 mg/kg/h for 4 h) to rhesus monkeys pretreated with vehicle or rifampin (18 mg/kg p.o. once daily) for 5 days. Results are mean ± S.D., n = 4.
Effects of Rifampin on the Pharmacokinetics of MDZ after Intravenous Administration to Monkeys. After intravenous infusion of MDZ (0.5 mg/kg/h for 4 h) to control animals, plasma concentrations of MDZ appeared to reach a steady-state level of about 0.8 to 1.0 μM at about 2 h postdose and declined relatively quickly after the infusion stopped (Fig. 4A), with t1/2 of about 1 h (Table 1). In these monkeys, plasma clearance values ranged from 24 to 32 ml/min/kg, with a mean value of 27 ml/min/kg (Table 1). The major metabolite 1′-OH MDZ was detectable in plasma, although with relatively low levels, in all four monkeys (Fig. 4B). The AUC values of 1′-OH MDZ ranged from 0.2 to 0.9 μM · h, representing about 13% (range, 5–22%) of those for the parent MDZ (Table 1). Plasma levels of 4-OH MDZ were near detectable limits, and thus are not shown, in control monkeys. Analysis of urine samples revealed that the total urinary recovery of MDZ and its metabolites was about 67% of the i.v. dose, with 1′-OH MDZ glucuronide representing the major metabolite (65% of the dose) and 4-OH MDZ being the minor pathway (<1% of the dose) (Table 1). It is noteworthy that complete assessment of the in vivo MDZ metabolism in rhesus monkeys was not possible since recoveries of MDZ and its metabolites in feces via biliary excretion were not determined in this study. Nevertheless, the urinary analysis suggested that in rhesus monkeys, MDZ underwent extensive metabolism via oxidation (at least 67%), followed by glucuronidation, and that urinary excretion was the major (∼70%) elimination pathway.
Pharmacokinetic (PK) parameters of MDZ and its metabolites following intravenous administration of MDZ (0.5 mg/kg/h for 4 h) to rhesus monkeys pretreated with vehicle (PEG 400) or rifampin (18 mg/kg p.o.) for 5 days
Values are mean ± S.D., n = 4. Values in parentheses are range.
Treatment with rifampin for 5 days at 18 mg/kg p.o. did not significantly affect the i.v. plasma profiles (Fig. 4A) or pharmacokinetic parameters of MDZ; values for AUC, Vdss, CL, and t1/2 of MDZ were comparable between the control and rifampin-treated animals (Table 1). However, rifampin significantly decreased plasma levels of 1′-OH MDZ (Fig. 4B); values for 1′-OH MDZ were decreased to approximately 1% of that of MDZ, representing about 10% of the control value (Table 1). A metabolite-switching phenomenon was not apparent since a similar decreasing trend in plasma levels of 4-OH MDZ also was observed in rifampin-treated versus control animals (data not shown).

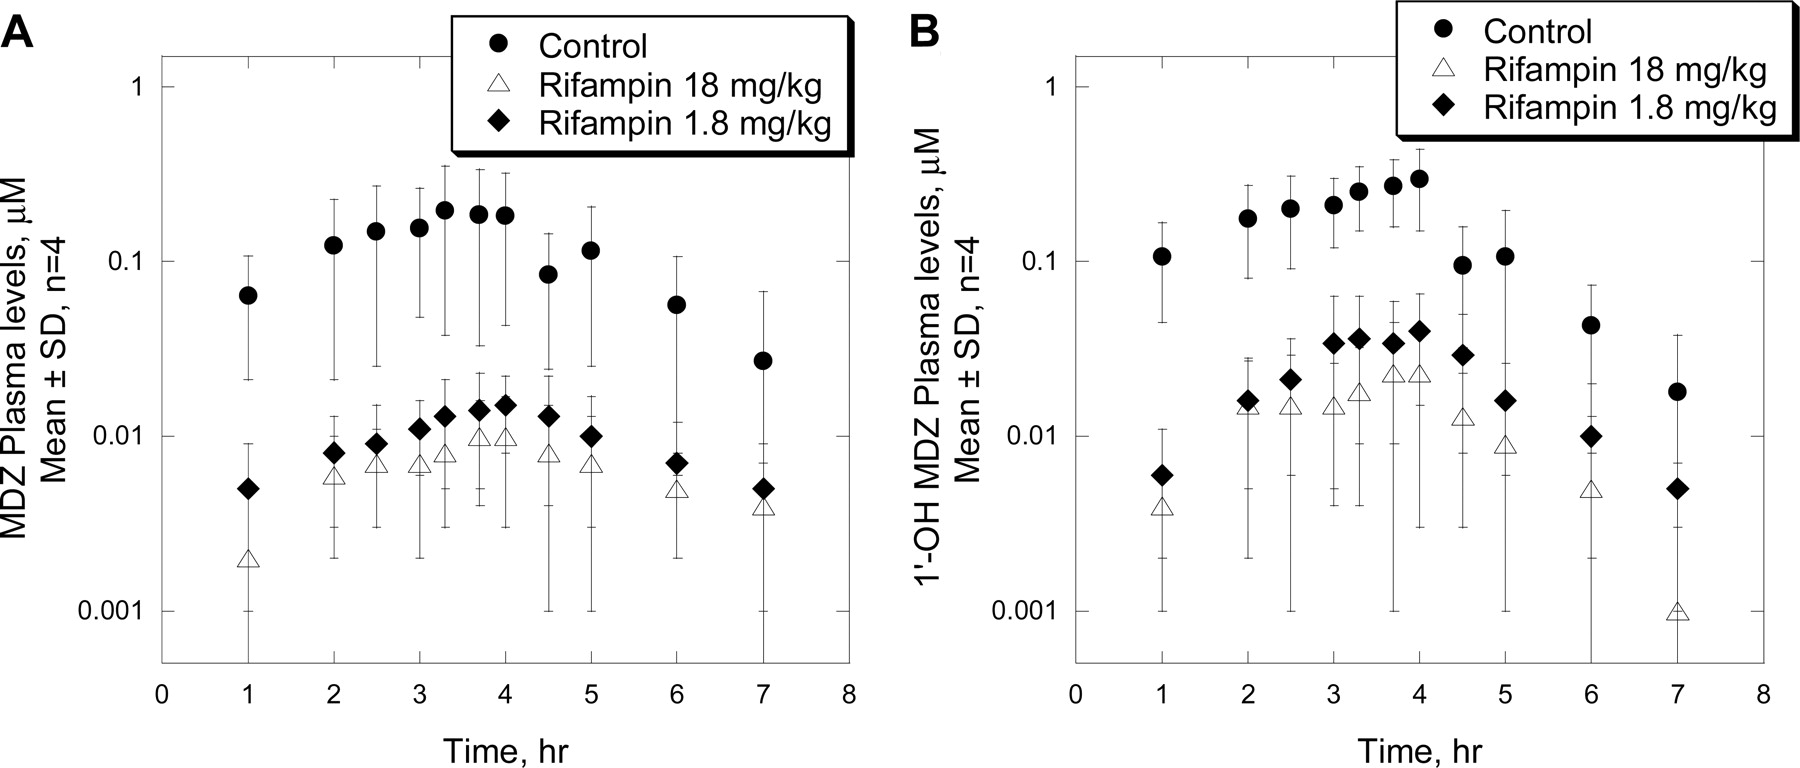
Mean plasma concentration-time profiles of MDZ (A) and 1′-OH MDZ (B) after i.pv. administration of MDZ (0.5 mg/kg/h for 4 h) to rhesus monkeys pretreated with vehicle or rifampin (18 or 1.8 mg/kg p.o. once daily) for 5 days. Results are mean ± S.D., n = 4.
Effects of Rifampin on the Pharmacokinetics of MDZ after Intraportal Vein Administration to Monkeys. Shown in Fig. 5, A and B, are mean plasma profiles of MDZ and its metabolite 1′-OH MDZ, respectively, after i.pv. administration of MDZ (0.5 mg/kg/h for 4 h) to rhesus monkeys pretreated with vehicle or rifampin (18 and 1.8 mg/kg p.o.) for 5 days. In control animals, MDZ plasma levels obtained after i.pv. administration were significantly lower than those observed after i.v. administration, with an apparent steady-state concentration of about 0.3 μM (range 0.1–0.4 μM) and AUC of 0.7 μM · h (Fig. 5A; Table 2). As a consequence, the hepatic availability, Fh, of MDZ was low (16%, Table 2), suggesting extensive hepatic first-pass elimination of MDZ in control monkeys. Consistent with this finding, ratios between plasma levels of 1′-OH MDZ and MDZ after i.pv. administration of MDZ (Fig. 5B) were higher than those obtained after the i.v. dosing; a mean value for the 1′-OH MDZ/MDZ AUC ratio was approximately 2 (Table 2).
Pharmacokinetic (PK) parameters of MDZ and 1′-OH MDZ following intrahepatic portal vein administration of MDZ (0.5 mg/kg/h for 4 h) to rhesus monkeys pretreated with vehicle (PEG 400) or rifampin (1.8 or 18 mg/kg p.o.) for 5 days
Values are mean ± S.D., n = 4. Values in parentheses are range.
Unlike the observation with the i.v. administration, treatment of rifampin at 18 mg/kg p.o. for 5 days caused a pronounced decrease (∼90%) in MDZ AUC after i.pv. administration of MDZ (Table 2). Consequently, the Fh, of MDZ was markedly decreased to 1% by rifampin treatment. A similar magnitude of interactions also was obtained after administration of rifampin at 1.8 mg/kg p.o. for 5 days (Fig. 5A; Table 2), suggesting that an apparent maximal induction effect of rifampin was reached at the doses used in this study. As was the case with the i.v. dosing, marked decreases in 1′-OH MDZ AUC also were observed in monkeys treated with rifampin, either at 18 or 1.8 mg/kg (Fig. 5B; Table 2). However, the AUC ratios between 1′-OH MDZ and MDZ in these animals, at both doses, although slightly higher than (∼20–43%), were not statistically significant from control values (Table 2).
In monkeys pretreated with rifampin, plasma concentrations of rifampin were maintained above 5 and 0.2 μM, after 18 and 1.8 mg/kg doses, respectively, over a period of 6 h after the last dose (5th dosing day) (Fig. 6). As shown in Table 2, systemic exposures of rifampin were increased as doses increased, although at a more than dose-proportional rate; plasma levels of rifampin reached Cmax of about 15 μM and 0.3 μM, and values for AUC0–7 h of rifampin were 67 and 1.2 μM · h, after 18 and 1.8 mg/kg, respectively (Table 2). Plasma concentrations of rifampin obtained at the 18 mg/kg dose were comparable to those reported after a therapeutic dose in humans (Sanofi-Aventis, 2003).
Effects of Compound A on the Pharmacokinetics of MDZ after Intraportal Vein Administration to Rhesus Monkeys. After MDZ administration (0.15 mg/kg/h) to control animals, plasma levels of MDZ were relatively low (Fig. 7), with a mean AUC value of 0.03 μM · h (Table 3). Consistent with the finding with the 0.5 mg/kg/h MDZ dose, 1′-OH MDZ plasma levels were substantial; the AUC ratio between 1′-OH MDZ and MDZ was about 1.6 (Fig. 7; Table 3).
Pharmacokinetic parameters of MDZ and 1′-OH MDZ following intrahepatic portal vein administration of MDZ (0.15 mg/kg/h for 4 h) to monkeys dosed with vehicle or compound A (6 mg/kg i.v.)
Values are mean ± S.D., n = 4. Values in parentheses are range.
Treatment with compound A caused marked increases in the AUC values of both MDZ and 1′-OH MDZ by 10-fold and 4-fold, respectively (Fig. 7; Table 3), resulting in statistically significant decreases in the 1′-OH MDZ/MDZ AUC ratio to about 60% (Table 3). Also, a similar increasing trend in plasma levels of 4-OH MDZ was observed in animals treated with compound A (data not shown). At the dose of compound A used in this study, plasma levels of compound A were above 0.5 μM for about 6 h (Fig. 5), with a mean AUC0–8 h value of 7 μM · h (Table 3).
Discussion
In the present in vitro studies, rifampin was characterized as an equipotent inducer of both rhesus monkey CYP3A64 and human CYP3A4, whereas compound A was equally efficient as an inactivator of CYP3A64 and CYP3A4. Subsequent pharmacokinetic interaction studies with MDZ showed that, in vivo, rhesus monkey CYP3A64 also was susceptible to induction by rifampin and inhibition by compound A. As is the case for CYP3A4 in humans, the in vivo clearance mechanism of MDZ in rhesus monkeys likely is primarily via CYP3A64, qualifying MDZ pharmacokinetics as an in vivo CYP3A64 probe. This conclusion is supported by 1) the finding that MDZ underwent extensive metabolism (at least 67%) in rhesus monkeys, with 1′-OH MDZ constituting the major metabolic pathway (Table 1), similar to in vivo observations in humans (Heizmann and Ziegler, 1981); and 2) the report by Carr et al. (2006) demonstrating MDZ as a good in vitro probe substrate for CYP3A64, similar to CYP3A4. In addition, our immunoinhibition studies using highly selective anti-human CYP3A4 monoclonal antibody (Mei et al., 1999; Carr et al., 2006) showed a near complete inhibition (>90%) of the major 1′OH MDZ and minor 4-OH MDZ metabolites, in both monkey and human liver microsomes (data not shown). Nevertheless, possible contributions of other rhesus CYP3A enzymes to MDZ metabolism could not be completely ruled out. Pharmacokinetically, MDZ was characterized as a high-clearance compound in rhesus monkeys, based on a blood/plasma partition ratio for MDZ of 0.6 (data not shown) and a mean CL of 27 ml/min/kg (Table 1), yielding a mean blood clearance (about 45 ml/min/kg) approaching the hepatic blood flow reported for this species (50–55 ml/min/kg). Interestingly, this in vivo clearance observation also is consistent with the high basal MDZ 1′-hydroxylase activity observed in vitro with CYP3A64.

Mean plasma concentration-time profiles of rifampin after oral administration of rifampin at 18 mg/kg or 1.8 mg/kg for 5 days, and of compound A after i.v. administration of compound A at 6 mg/kg single dose. Results are mean ± S.D., n = 4.

Mean plasma concentration-time profiles of MDZ and 1′-OH MDZ after i.pv. administration of MDZ (0.15 mg/kg/h for 4 h) to rhesus monkeys pretreated with vehicle or compound A (6 mg/kg i.v. single dose). Results are mean ± S.D., n = 4.
The MDZ and rifampin interaction results provided some useful insights into the in vitro-in vivo P450 induction relationship. The finding that rifampin did not significantly affect the i.v. kinetics of MDZ (CL or t1/2), whereas it markedly decreased Fh (∼16-fold), is in line with the concept (Wilkinson, 1987) that the i.v. pharmacokinetics of high clearance compounds are much less sensitive to changes in their intrinsic hepatic clearances, whereas their Fh (and oral pharmacokinetics) are expected to be significantly affected, even with a small change in the intrinsic clearance (Vmax/Km of ∼2-fold based on in vitro studies in this case). Indeed, a comparably large magnitude decrease in Fh (∼10-fold) was estimated using the well known parallel-tube model (Fh = 1–(CLh/Qh); CLh = Qh [1–e(–fu · CLint/Qh)]), based on the 2-fold change in CLint, and assuming the hepatic blood clearance (CLh) of MDZ and hepatic blood flow (Qh) of 45 and 50 ml/min/kg, respectively, and an unbound fraction of MDZ in monkey plasma (fu) of 0.2 (data not shown). The parallel-tube model, which has provided reasonable estimates for MDZ and other drugs with high extraction ratio (Higashikawa et al., 1998), also predicted a disproportionate change in Fh (∼30-fold), with a mere 2.5-fold change in CLint. Thus, this finding further supports the view that the likely extent of in vivo interaction could not be readily gauged based solely on in vitro Vmax/Km or Emax values, but also on the in vivo pharmacokinetic characteristics of the probe. In addition, the present results suggest that the in vitro EC50 value (the effective concentration for 50% maximal induction) is a helpful parameter in determining a range of plasma concentrations of inducers that would likely cause significant in vivo drug interactions. This conclusion is based on the finding that the apparent maximal induction effect of rifampin was observed in association with rifampin's Cmax of ∼0.3 μM, which was slightly higher than the EC50 value of 0.2 μM obtained in monkey hepatocytes. Given the fact that rifampin is a substrate of a human hepatic transporter, organic anion-transporting polypeptide (Tirona et al., 2003), a possibility exists that after the 1.8 mg/kg dose, the unbound intracellular concentrations of rifampin in monkey liver would exceed those observed in plasma (0.06 μM unbound concentration, based on fu of 20%), and consequently reached the in vitro EC50 value.
Similarly, the in vivo relevance of the in vitro inhibition of CYP3A64 was demonstrated in rhesus monkeys. The finding that compound A markedly increased the systemic exposure of the i.pv. administered MDZ is consistent with inhibition of CYP3A64-mediated hepatic metabolism of MDZ in this species. Notably, this inhibition effect was observed at plasma concentrations of compound A over the 6-h period of about 0.5 to 1 μM, which corresponded to unbound plasma concentrations of approximately 0.1 to 0.2 μM (based on 20% unbound fraction obtained using monkey plasma; data not shown) and exceeded its KI value obtained in vitro with CYP3A64. Although the single dosing regimen used in this study may not be sufficient to produce the maximal level of enzyme inactivation by compound A, the magnitude increase in the i.pv. AUC of MDZ by compound A was nevertheless close to an anticipated range based on the in vitro kinact and KI obtained in this study and using a quantitative prediction method proposed for mechanism-based inactivators by Ernest et al. (2005).
In this study, the pharmacokinetics of 1′-OH MDZ also was monitored, but unfortunately, limited information was attained. Unlike the in vitro metabolite formation kinetics, in vivo metabolite kinetics is known to be quite complex, dependent not only on its formation rate, but also its elimination rate, as well as the exposure of its parent (Houston, 1982). The finding that the exposure to 1′-OH MDZ was markedly decreased with a comparable decrease in 1′-OH MDZ/MDZ AUC ratios after i.v. administration of MDZ to monkeys pretreated with rifampin suggested that rifampin might also induce a major elimination process of 1′-OH MDZ, presumably glucuronidation. This suggestion is in agreement with published reports that rifampin is an inducer for UGT (Li et al., 1999; Soars et al., 2004). However, the reasons for the different observation obtained after the i.pv. administration of MDZ (decreased MDZ and 1′-OH MDZ exposure, but not the 1′-OH MDZ/MDZ ratio) are unclear. Whether this apparent discrepancy is partly related to potential induction of the glucuronidation of 1′-OH MDZ during hepatic first pass by rifampin remains to be investigated. Regarding the in vivo effect of compound A, the finding of a significantly decreased 1′-OH MDZ/MDZ AUC ratio, although accompanied by increased 1′-OH MDZ exposure, is explainable by the more marked increase in MDZ exposure, and is consistent with the conclusion that compound A inhibited primarily the hepatic formation of 1′-OH MDZ via CYP3A64 inhibition.
Analogous to rhesus monkeys, an apparent in vitro-in vivo agreement also was obtained with MDZ and rifampin in humans. In clinical studies, rifampin has been reported to significantly increase the i.v. CL (2-fold) and decrease oral exposure of MDZ (20- to 40-fold) (Backman et al., 1996, 1998; Kharasch et al., 2004). The effect on CL is consistent with the in vitro induction data observed in human hepatocytes, as well as the fact that MDZ exhibits a moderate CL in humans (unlike monkeys), whereas that on the oral AUC could be attributable additionally to changes in the hepatic first pass as well as the induction of CYP3A4-mediated intestinal first pass of MDZ (Thummel et al., 1994; Tsunoda et al., 1999). In this regard, the i.pv. administration was used in the present monkey study to avoid potential complications from incomplete absorption and intestinal enzyme induction or inhibition. This allowed for a direct comparison with the present in vitro studies using liver preparations. Although not studied, the inhibitory effect of compound A on the MDZ pharmacokinetics in humans is also expected to be comparable to that observed in the present rhesus monkey study, based on almost identical in vitro CYP3A64 and CYP3A4 data, and the clinical observations that a similar magnitude of interactions has been reported for MDZ when coadministered with mechanism-based inhibitors with comparable kinact and KI values (Ernest et al., 2005).
In addition to rifampin and compound A, presented in this investigation, our in-house studies with a limited number of compounds (Merck Research Laboratories, data on file) also showed species similarities in induction and inhibition profiles between rhesus monkey CYP3A64 and human CYP3A4. In the case of rifampin, the enzyme-inducing effect in rhesus monkeys appeared to be mediated via the pregnane X receptor (Merck Research Laboratories, data on file), similar to humans (Gibson et al., 2002; Luo et al., 2002). Nevertheless, species differences in P450 responses between rhesus monkeys and humans remain a possibility for other compounds, considering the well documented marked species differences, especially between rodents and humans in response to CYP3A inducers (Gibson et al., 2002).
In conclusion, the present investigation showed that, in vitro, rhesus monkey CYP3A64 was susceptible to induction by rifampin and inhibition by compound A, resembling observations with human CYP3A4. With the use of MDZ as an in vivo probe for CYP3A64, the pharmacokinetic consequences of the in vitro findings and their corresponding in vitro-in vivo relationships were demonstrated in this species. With respect to P450 induction, both the in vitro Emax and EC50 values were valuable, when considered in combination with the ADME or pharmacokinetics characteristics of the probe and the inducer as well as route of administration of the probe, for assessing the likely extent of in vivo interaction. Finally, our results suggest that these in vitro and in vivo rhesus monkey models, when used in conjunction with in vitro human systems, may serve as valuable preclinical tools to help provide a basis for extrapolating in vitro human data to clinical outcomes and a mechanistic insight for the interpretation of drug interactions observed during early/late drug development processes.
Acknowledgments
We thank J. Brunner, K. Michel, and J. Adelsburger for animal experiments.
Footnotes
-
Article, publication date, and citation information can be found at http://dmd.aspetjournals.org.
-
This work was conducted at Merck Research Laboratories, West Point, PA.
-
doi:10.1124/dmd.106.009878.
-
ABBREVIATIONS: MDZ, midazolam; 1′-OH MDZ, 1′-hydroxy midazolam; 4-OH MDZ, 4-hydroxy midazolam; OR, oxidoreductase; DMSO, dimethyl sulfoxide; PCR, polymerase chain reaction; AUC, area under the plasma concentration-time curve; Cmax, peak plasma concentration; CL, plasma clearance; Fh, hepatic availability; Vdss, volume of distribution at steady state; t1/2, half-life; i.pv., intrahepatic portal vein; LC-MS/MS, liquid chromatography coupled with tandem mass spectrometry.
- Received February 22, 2006.
- Accepted June 14, 2006.
- The American Society for Pharmacology and Experimental Therapeutics


