


Abstract
(R)-3-[1-(2,6-Dichloro-3-fluoro-phenyl)-ethoxy]-5-(1-piperidin-4-yl-1H-pyrazol-4-yl)-pyridin-2-ylamine (PF02341066) was identified as an orally available, ATP-competitive small molecule inhibitor of cMet receptor tyrosine kinase. The objectives of the present studies were to characterize 1) the pharmacokinetic-pharmacodynamic relationship of the plasma concentrations of PF02341066 to cMet phosphorylation in tumor (biomarker) and 2) the relationship of cMet phosphorylation to antitumor efficacy (pharmacological response). Athymic mice implanted with GTL16 gastric carcinoma or U87MG glioblastoma xenografts were treated with PF02341066 once daily at doses selected to encompass ED50 values. Plasma concentrations of PF02341066 were best described by a one-compartment pharmacokinetic model. A time-delay (hysteresis) was observed between the plasma concentrations of PF02341066 and the cMet phosphorylation response. A link model was therefore used to account for this hysteresis. The model fitted the time courses of cMet phosphorylation well, suggesting that the main reason for the hysteresis is a rate-limiting distribution from plasma into tumor. The EC50 and EC90 values were estimated to be 19 and 167 ng/ml, respectively. For tumor growth inhibition, the exponential tumor growth model fitted the time courses of individual tumor growth inhibition well. The EC50 for the GTL16 tumor growth inhibition was estimated to be 213 ng/ml. Thus, the EC90 for the inhibition of cMet phosphorylation corresponded to the EC50 for the tumor growth inhibition, suggesting that near-complete inhibition of cMet phosphorylation (>90%) is required to significantly inhibit tumor growth (>50%). The present results will be helpful in determining the appropriate dosing regimen and in guiding dose escalation to rapidly achieve efficacious systemic exposure in the clinic.
Pharmacokinetic-pharmacodynamic (PKPD) modeling is increasingly being applied in drug discovery and development. Specific applications include 1) the selection of drug candidates with most favorable PKPD properties and 2) the prediction of exposure response in patients with the aim of optimizing the design of early clinical trials. The increased understanding of drug action derived from PKPD-based drug development leads to more information, especially with regard to the identification of drug dosage regimen that results in optimal therapeutic outcome (Derendorf et al., 2000; Lesko et al., 2000; Chien et al., 2005). The use of PKPD modeling in this context relies on prediction of the time course of drug effects in patients, using information from preclinical investigation. Preclinical studies are useful alternatives to investigate PKPD relationships to get insight into the in vivo mechanism of drug action. The integration of PKPD modeling and simulation in drug development has provided opportunities to accelerate the evaluation of new chemical entities in the clinic. Thus, the PKPD investigation could contribute to shortening the overall period of drug development.
The cMet receptor tyrosine kinase and its ligand, hepatocyte growth factor (HGF), are highly expressed relative to surrounding tissue in numerous cancers, and their expression correlates with poor patient prognosis (Birchmeier et al., 2003). Cell lines engineered to express high levels of cMet and HGF receptor (autocrine loop) or mutant cMet displayed a proliferative, motogenic, and/or invasive phenotype and grew as metastatic tumors in nude mice (Rong et al., 1992, 1994; Bellusci et al., 1994; Jeffers et al., 1997). Thus, cMet and HGF have been implicated in the development and progression of multiple human cancers and are attractive targets for cancer therapy. PF02341066 (Fig. 1), was identified as an orally available, ATP-competitive small molecule inhibitor of cMet kinase (Ki 4 nM) (Zou et al., 2007). PF02341066 was selective for cMet (and anaplastic lymphoma kinase) compared with a panel of >120 diverse tyrosine and serine-threonine kinases. PF02341066 potently inhibited in vitro cMet phosphorylation and signal transduction as well as cMet-dependent proliferation, migration, or invasion of human tumor cells (IC50 values: 5–20 nM). In addition, PF02341066 potently inhibited HGF-stimulated endothelial cell survival and invasion or serum-stimulated endothelial cell tubulogenesis in vitro, suggesting that this compound also exhibits antiangiogenic properties (Zou et al., 2007).
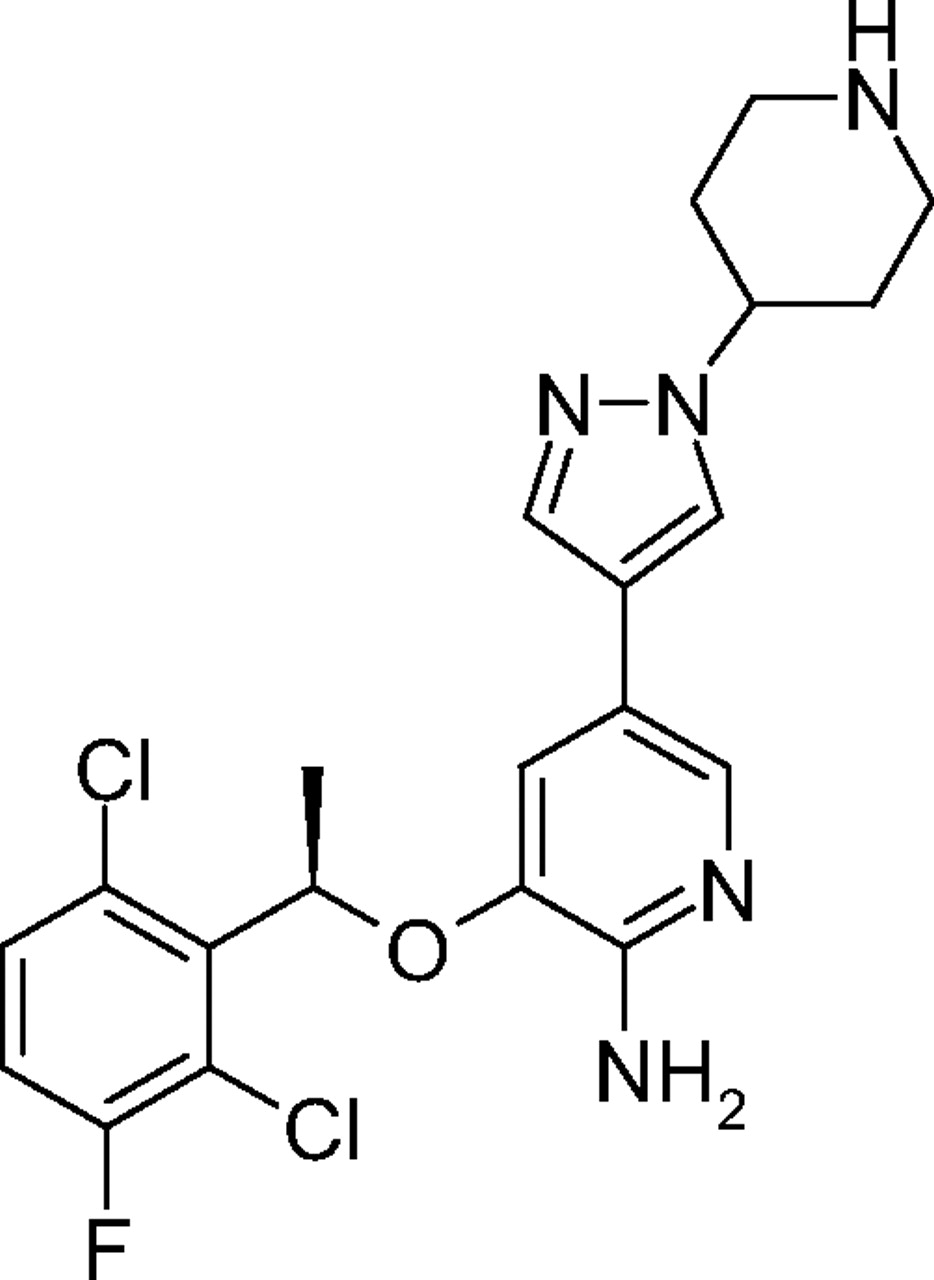
Chemical structure of PF02341066 [(R)-3-[1-(2,6-dichloro-3-fluoro-phenyl)-ethoxy]-5-(1-piperidin-4-yl-1H-pyrazol-4-yl)-pyridin-2-ylamine].
The application of PKPD principles and procedures to the rational development of PF02341066 will be essential. The objectives of the present studies were to characterize 1) the PKPD relationship of PF02341066 plasma concentrations to cMet phosphorylation in tumors (biomarker) and 2) the relationship of cMet phosphorylation to antitumor efficacy (pharmacological response) in athymic mice implanted with human tumor xenografts. The extrapolation of the present PKPD relationships to patients using the combination of in vitro and in vivo data can be particularly helpful in determining the appropriate dosing regimen in clinical studies and in guiding dose escalation to achieve systemic exposure in patients who are expected to have pharmacological effects.
Materials and Methods
Chemicals. PF02341066 (hydrochloride salt: chemical purity >99%) and a structurally related in-house compound (internal standard for analysis) were synthesized by Pfizer Global Research and Development (San Diego, CA). All other commercially available reagents and solvents were of either analytical or high-performance liquid chromatography (HPLC) grade.
In Vivo PKPD Study. Detailed information about in vivo PKPD studies was reported previously by Zou et al. (2007). In brief, three separate repeated oral-dose PKPD studies were conducted with PF02341066 in athymic mice implanted with GTL16 gastric carcinoma or U87MG glioblastoma xenografts (studies 1–3). Mice were treated with PF02341066 for 9 to 11 days at selected doses. A subset of mice was humanely euthanized at 1, 4, 8, and 24 h after the last dosing. Blood samples (n = 3/time point) were collected by exsanguination via cardiac puncture to determine plasma concentration of PF02341066 (studies 1–3). Resected tumors (n = 3/time point) were snap-frozen and pulverized using a liquid nitrogen-cooled cryomortar and pestle, and protein lysates were generated. The level of total phosphorylated tyrosine protein in the cMet receptor (cMet phosphorylation) was determined using a capture enzyme-linked immunosorbent assay method (studies 1 and 2). Tumor volume was also measured during the treatment period (studies 1–3) by electronic Vernier calipers and was calculated as the product of its length × width2 × 0.4. Dose levels of each study were summarized as follows: 1) study 1 (GTL16 xenograft model) at 8.5, 17, and 34 mg/kg; 2) study 2 (GTL16 xenograft model) at 3.13, 6.25, 12.5, 25, and 50 mg/kg; and 3) study 3 (U87MG xenograft model) at 3.13, 6.25, 12.5, 25, and 50 mg/kg. All of the procedures were conducted in accordance with the Institute for Laboratory Animal Research Guide for the Care and Use of Laboratory Animals and with Pfizer Animal Care and Use Committee guidelines.
PF02341066 Analysis. Plasma concentrations of PF02341066 were quantitatively determined by liquid chromatography-tandem mass spectrometry. Mouse plasma samples were extracted with a methanol-acetonitrile mixture (1:1, v/v). Chromatography was performed with an HP1100 HPLC system (Agilent Technologies, Palo Alto, CA) using a reverse-phase column (XDB-C18, 2.1 × 50 mm, 5 μm; Agilent Technologies). Mass spectrometric analysis was performed on a Quattro Ultima triple-stage quadrupole mass spectrometer (Micromass; Waters, Beverly, MA) using electrospray ionization. The mobile phase consisted of A (98% HPLC grade water, 2% acetonitrile, and 0.1% formic acid) and B (98% acetonitrile, 2% HPLC grade water, and 0.1% formic acid) at a flow rate of 0.4 ml/min. The gradient elution was programmed from 5 to 60% B over 2.5 min. The mass spectrometer was operated under the following conditions: capillary voltage 2.5 kV, cone voltage 45 V, source temperature 120°C, and dissolution temperature = 350°C. Sample analysis was performed in the positive ionization multiple reaction monitoring mode with unit resolution for the transitions of m/z 450 to 260 for PF02341066 and m/z 377 to 348 for the internal standard. Total time for the analytical run was 4.6 min. Data were processed using Masslynx 3.5 software (Micromass). The calibration curve range was 1 to 2500 ng/ml. The back-calculated calibration standard concentrations were within ±15% of their theoretical concentrations with coefficients of variation of less than 12%. The precision and accuracy of the quality control samples were within ±14%.
In Vitro Plasma Protein Binding. The plasma free fraction of PF02341066 was determined in mouse plasma at 0.23 to 9 μg/ml (0.5–20 μM) using the equilibrium dialysis technique. The study was conducted in a 96-well Teflon dialysis chamber (HTDialysis LLC, Gales Ferry, CT) using a semipermeable membrane (Spectra/Por4; Spectrum, Laguna Hills, CA) with a 12,000 to 14,000 Da molecular mass cut-off. An aliquot of plasma (0.15 ml) was placed in half the well in triplicate. The second half of the well contained an equal volume of potassium buffer (100 mM, pH 7.4). The plate was covered with a top seal film to avoid evaporation and incubated at 37°C for 6 h. Pilot experiments revealed that 1) PF02341066 was stable in plasma and 2) protein binding reached equilibrium at 37°C for 6 h. After incubation, the plasma (0.02 ml) and buffer (0.08 ml) were transferred to separate tubes containing either 0.08 ml of blank buffer or 0.02 ml of blank plasma, respectively. Samples were extracted with 0.3 ml of an acetonitrile-methanol mixture (1:1, v/v) containing the internal standard and analyzed by liquid chromatography-tandem mass spectrometry as described above. The free fraction (fu) was calculated by the equation fu = Cbuffer/Cplasma, where Cbuffer and Cplasma denote the concentrations of PF02341066 in buffer and plasma, respectively, after the incubation.
Pharmacokinetic Analysis. A naive-pooled pharmacokinetic analysis was used to determine pharmacokinetic parameters of PF02341066 in mice because a subset of mice (n = 3/time points) was humanely euthanized at each time point to collect blood samples. Therefore, all individual data at each dose were pooled together for the pharmacokinetic analysis as if they came from a single individual (Sheiner, 1984). Pharmacokinetic analysis was performed with a standard one-compartment linear model with a first-order absorption rate as implemented in NONMEM version V (University of California at San Francisco, San Francisco, CA) (Beal and Sheiner, 1992). The subroutine ADVAN2 with TRANS2 was used for the NONMEM analysis. This model was parameterized using absorption rate constant (ka, hours-1), oral clearance (CL/F, liters per hour per kilogram), and oral volume of distribution (Vd/F, liters per kilogram). Residual variability was characterized by a proportional error model. Pharmacokinetic parameters obtained were used to simulate plasma concentrations as a function of time after oral dose administration to drive the time-dependent pharmacodynamic model.
PKPD Modeling. The response of cMet phosphorylation in tumor to a plasma concentration of PF02341066 was modeled using a link model (an effect-compartment model) (Sheiner et al., 1979) and an indirect response model (Dayneka et al., 1993; Jusko and Ko, 1994). In brief, the effect site concentration of PF02341066 (Ce, nanograms per milliliter) was expressed by the following differential equation:  where ke0 is the rate constant (hours-1) for equilibration with the effect site and Cp is the plasma concentration of PF02341066 (nanograms per milliliter).
In the link model, the following equation was used to determine EC50 (the concentration causing one-half maximum effect, Emax) for the inhibition of cMet phosphorylation (E):  where E0 is the baseline of cMet phosphorylation and γ is the Hill coefficient.
An indirect response model assumes that cMet phosphorylation is maintained by the balance of formation and degradation rates. PF02341066 is considered to inhibit the formation rate because PF02341066 is a competitive ATP-binding inhibitor of cMet kinase. Therefore, the following differential equation was used to determine EC50 for the inhibition of cMet phosphorylation (R):  where kin is the zero-order formation rate constant (hours-1) and kout is the first-order degradation rate constant (hours-1).
Furthermore, an indirect response model with the effect compartment, that is, Ce instead of Cp, was performed to determine EC50 for the inhibition of cMet phosphorylation (R): 
In vivo tumor growth in xenograft models is known to follow exponential growth, at least in its early phases. Subsequently, the tumor volume follows a linear growth, eventually reaching a plateau (Gompertz, 1825; Bissery et al., 1996). This behavior can be described using a Gompertz model (Gompertz, 1825). In our approach, the tumor growth curves in control groups were first modeled by an exponential tumor growth model in which tumor volume inhibits the growth rate:  where T is tumor volume, kin is the first-order tumor growth rate constant (hours-1), TG50 is the tumor volume that inhibits 50% of the tumor growth rate, and kout is the first-order tumor loss rate constant (hours-1).
The response of tumor volume (T) to plasma concentration of PF02341066 was then modeled using an exponential tumor growth model including inhibition of the growth rate by both tumor volume and PF02341066 concentration: 
In many in house studies, the estimates of TG50 values in control groups were greater than the observed maximum tumor volumes, suggesting that tumor growth simply followed the exponential growth curve in a study period. Therefore, the above tumor model in the control group could be simplified to the following differential equation: 
The response of tumor volume (T) to plasma concentration of PF02341066 was then modeled by the following differential equation: 
All analyses were performed with NONMEM version V and S-Plus 6.2 (Insightful Corporation, Seattle, WA). The NONMEM subroutine ADVAN6 was used for the link model, whereas the ADVAN8 was used for the indirect response model and the tumor growth inhibition model. The Hill coefficient (γ) was fixed to be unity in all PKPD models. The initial conditions at time 0 for the gastrointestinal tract compartment, cMet phosphorylation, and tumor volume were the dose amount (milligrams per kilogram), the mean cMet phosphorylation ratio of control animals (i.e., unity), and the individual tumor volume (cubic millimeters), respectively. Residual variability was characterized by a proportional error model. In the exponential tumor growth model with a population analysis, an interanimal variability for kout was estimated using an exponential variance model. Model selection was based on a number of criteria such as the objective function value, estimates, standard errors, and scientific plausibility and exploratory analysis of the goodness-of-fit plots. The difference in the objective function between two nested models was compared with a χ2 distribution in which a difference of 6.63 was significant at the 1% level. The final models were validated by running a bootstrap validation procedure with 5000 data sets (Efron and Tibshirani, 1993). The parametric statistics of the parameters (median and 10th and 90th percentiles) generated were compared with the final parameter estimates generated by the NONMEM analysis.
Results
Pharmacokinetics. The unbound fractions of PF02341066 in mouse plasma (0.030–0.033) were concentration-independent at 0.23 to 9 μg/ml (0.5–20 μM). The majority of plasma concentrations of PF02341066 at the lowest dose of 3.13 mg/kg were below the lower limit of quantitation (<1 ng/ml). Therefore, pharmacokinetic analysis at the lowest dose was not performed. The observed and model-fitted plasma concentrations of PF02341066 in athymic mice implanted with human tumor xenografts after oral administration are shown in Fig. 2. The pharmacokinetic parameters of PF02341066 are tabulated in Table 1. Plasma concentrations of PF02341066 at the doses of 6.25 to 50 mg/kg in all studies were best described by a one-compartment model with a fixed absorption lag time of 0.8 h. The objective function value for the pharmacokinetic analysis was 1199.5. Pharmacokinetic parameter estimates for ka, CL/F, and Vd/F were 0.24 to 0.34 h-1, 1.5 to 14 liters/h/kg, and 2.5 to 56 liters/kg, respectively (Table 1). The values of ka seemed to be independent of the doses. The CL/F and Vd/F values tended to be higher at the lower doses than at the higher doses, suggesting nonlinear pharmacokinetics at the dose range of 6.25 to 50 mg/kg. Preliminary in-house data suggest that nonlinear pharmacokinetics of PF02341066 could be in part due to saturation of hepatic/intestinal clearance at higher doses. The standard errors of each pharmacokinetic parameter were relatively small (co-efficient of variation <30%). Residual variability was estimated to be 28%. The final parameter estimates (median values) from the bootstrap validation were 0.23 to 0.33 h-1, 1.5 to 14 liters/h/kg, and 2.5 to 57 liters/kg, respectively. Thus, the final parameter estimates for the bootstrap validation were in good agreement with the estimates of the final pharmacokinetic model (<±3%).
Pharmacokinetic parameter estimates of PF02341066 in athymic mice bearing GTL16 or U87MG tumors after repeated oral administration of PF02341066 Precision of the estimates is expressed as S.E. in parentheses.
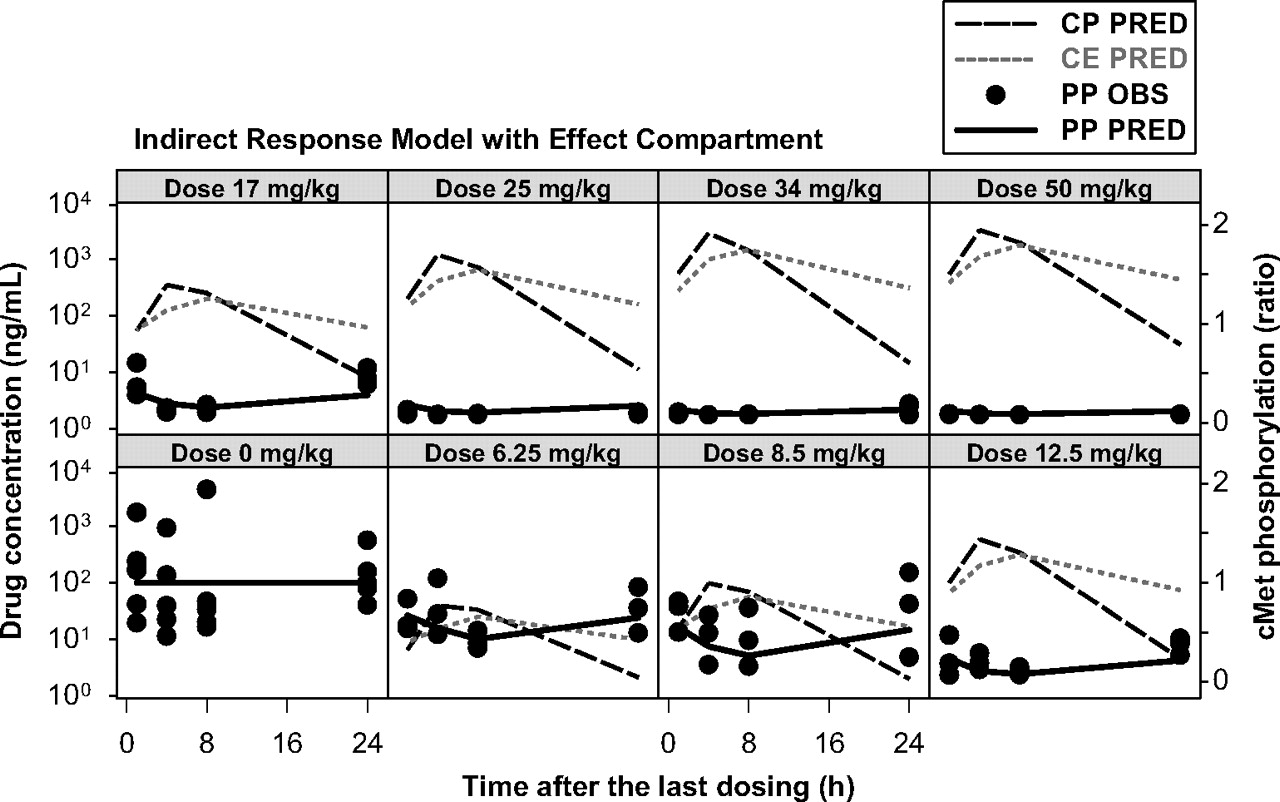
PKPD Relationship. In general, the maximum plasma concentrations were observed at 4 h postdose, whereas the maximum inhibition of cMet phosphorylation was observed at 8 h postdose. Thus, it was apparent that there was a time delay (hysteresis) between plasma concentrations of PF02341066 and the cMet phosphorylation response. The inhibition of cMet phosphorylation was returned to the baseline level at 24 h postdose at the doses of 3.13 and 6.25 mg/kg whereas near-complete inhibition was observed during the dosing interval at the doses of 25 to 50 mg/kg. The observed and model-fitted cMet phosphorylation-time profiles in the GTL16 xenograft model are graphically presented in Fig. 3 (the link model) and Fig. 4 (the indirect response model with the effect compartment). The link model fitted the time profiles of cMet phosphorylation inhibition well. The objective function value was -322. The EC50 value was estimated to be 19 ng/ml (Table 2). The calculated EC90 value by the Hill equation was 167 ng/ml, which was equivalent to 13 nM free. The indirect response model did not fit the time profiles of cMet phosphorylation inhibition well, especially at the lower doses. This model tended to overpredict the inhibition of cMet phosphorylation and the objective function value was -265. The estimated EC50 value was 4.6 ng/ml. By incorporating the effect compartment to the indirect response model, the model fitted the time profiles of cMet phosphorylation inhibition well. The objective function value was -322. The EC50 value was estimated to be 19 ng/ml (Table 2). The calculated EC90 value by the Hill equation was 167 ng/ml. The final parameter estimates from the bootstrap validation of the link model were 19 ng/ml (10th and 90th percentiles: 15 and 22 ng/ml, respectively) for EC50 and 0.13 h-1 (0.11 and 0.16 h-1, respectively) for ke0. The final parameter estimates from the bootstrap validation of the indirect response model with the effect compartment were 19 ng/ml (16 and 21 ng/ml, respectively) for EC50, 20.2 h-1 (19.7 and 20.7 h-1, respectively) for kout and 0.14 h-1 (0.11 and 0.16 h-1, respectively) for ke0. Thus, the final parameter estimates (50th percentile) for the bootstrap validation were in good agreement with the estimates of the final model (<±2%).
Pharmacodynamic parameter estimates of PF02341066 for cMet phosphorylation in athymic mice bearing GTL16 tumors after repeated oral administration of PF02341066 Precision of the estimates is expressed as S.E. in parentheses.

Observed and model-fitted plasma concentrations of PF02341066 in athymic mice implanted with GTL16 or U87MG xenografts after repeated oral administration of PF02341066. OBS, observed plasma concentrations of PF02341066; PRED, model-fitted plasma concentrations of PF02341066.
Regarding the tumor growth inhibition, the antitumor efficacies of PF02341066 on day 11 (the last dosing day) in the GTL16 xenograft model were 25, 34, 60, 89, and 100% inhibition at the doses of 3.13, 6.25, 12.5, 25, and 50 mg/kg, respectively (Zou et al., 2007). The antitumor efficacies of PF02341066 on day 9 (the last dosing day) in the U87MG xenograft model were 35, 50, 71, 83, and 97% inhibition at the doses of 3.13, 6.25, 12.5, 25, and 50 mg/kg, respectively (Zou et al., 2007). The observed and model-fitted tumor volume-time profiles in athymic mice implanted with GTL16 and U87MG xenografts are graphically presented in Figs. 5 and 6, respectively. The exponential tumor growth model including the growth rate inhibition by PF02341066 concentration well fitted the individual tumor volume-time profiles of the GTL16 and U87MG xenografts during the PF02341066 repeated-dose treatment. The objective function values for the GTL16 and U87MG xenograft models were 2404 and 2514, respectively. The EC50 values were estimated to be 213 ng/ml (17 nM free) in the GTL16 model and 94 ng/ml (7.5 nM free) in the U87MG model (Table 3). The final parameter estimates of EC50 for the bootstrap validation were 214 ng/ml (10th and 90th percentiles: 58 and 370 ng/ml, respectively) for the GTL16 xenograft model and 95 ng/ml (28 and 161 ng/ml, respectively) for the U87MG xenograft model. The final parameter estimates of all the PKPD parameters were in good agreement with the estimates of the final model (<±1%).
Pharmacodynamic parameter estimates of PF02341066 for tumor growth inhibition in athymic mice bearing GTL16 or U87MG tumors after repeated oral administration of PF02341066 Precision of the estimates is expressed as S.E. in parentheses.
Discussion
The present study provides novel information on the PKPD relationship for an orally available cMet kinase inhibitor in human tumor xenograft models. The pharmacodynamic biomarker response, measured as cMet phosphorylation, was delayed relative to the plasma concentrations of PF02341066 in the tumor xenografts models. Slow distribution to tumors may be one of the reasons for this delayed response (hysteresis). This observation therefore positioned PF02341066 as an interesting compound to investigate the application of two types of PKPD models that have been proposed to characterize the delay between drug concentration and biomarker response, that is, the link model (Sheiner et al., 1979) and the indirect response model (Dayneka et al., 1993; Jusko et al., 1994). In the link model, it is assumed that the rate of onset and offset of biomarker response is governed by the rate of drug distribution to and from a hypothetical “effect site” (Sheiner et al., 1979). However, many drugs showed delayed response for other reasons, particularly because of indirect mechanisms of action such as stimulation or inhibition of formation (kin) or loss (kout) of substance controlling the physiological response (Dayneka et al., 1993; Jusko et al., 1994). The indirect response model accounts for delays caused by the time needed for changes in kin or kout to be fully expressed in the measured physiological response. In the present study, the link model provided adequate fitting for the inhibition of cMet phosphorylation (objective function value =-322). On the contrary, the indirect response model did not fit the cMet phosphorylation time course well (objective function value =-266). We therefore incorporated the effect compartment into the indirect response model, resulting in better fitting for the inhibition of cMet phosphorylation (objective function value =-322). The pharmacodynamic parameters obtained from this combined model, that is, the indirect response model with the effect compartment, were identical to those from the link model: EC50 = 19 ng/ml and ke0 = 0.14 h-1 (Table 2). The objective function values for both the models were also identical. In the combined model, kout was estimated to be 20 h-1, which was much larger than the estimated ke0 (0.14 h-1), representing essentially instantaneous equilibration of cMet phosphorylation in response to changes in the drug concentration. The estimate of ke0 was equivalent to a drug distribution half-life of 5 h. Consistently PF02341066 showed a relatively large volume of distribution (2.5–56 liters/kg). The maximum plasma concentrations were observed at a relatively late time point, i.e., 4 h postdose (Fig. 2). These pharmacokinetic trends were observed across preclinical species (in-house data). In addition, PF02341066 demonstrated a rapid inhibition of cMet phosphorylation (<20 min) in GTL-16 gastric carcinoma cells in vitro (Zou et al., 2007). These findings taken together suggest that the main reason for the observed hysteresis is a rate-limiting distribution from plasma to the effect site, i.e., tumors. The factors controlling cMet phosphorylation levels might be of no importance to the observed hysteresis. Therefore, the combined model would be better simplified to the link model. This is in line with the theoretical hypothesis that there are circumstances in which the indirect response model could mimic a direct pharmacological response (Jusko et al., 1995; van Schaick et al., 1997). In general, the intermediary components between pharmacokinetics in plasma and the pharmacodynamic response in effect site, such as drug distribution to the effect site, indirect response mechanisms, cascading transduction steps, and others, are not known in advance. For this reason, a general PKPD model combining an indirect response model and effect compartment has been proposed to describe a time delay (hysteresis) between pharmacokinetics in plasma and pharmacodynamic response in effect site (Verotta et al., 1995; Mager et al., 2003). The distinction between the different processes in the combined indirect response model/effect compartment requires intensive sampling at multiple doses in relation to the half-lives of the ke0 value and the rate of biosignal turnover. The PKPD field is clearly moving toward mechanistic modeling to have a deeper understanding of the actions of drugs.
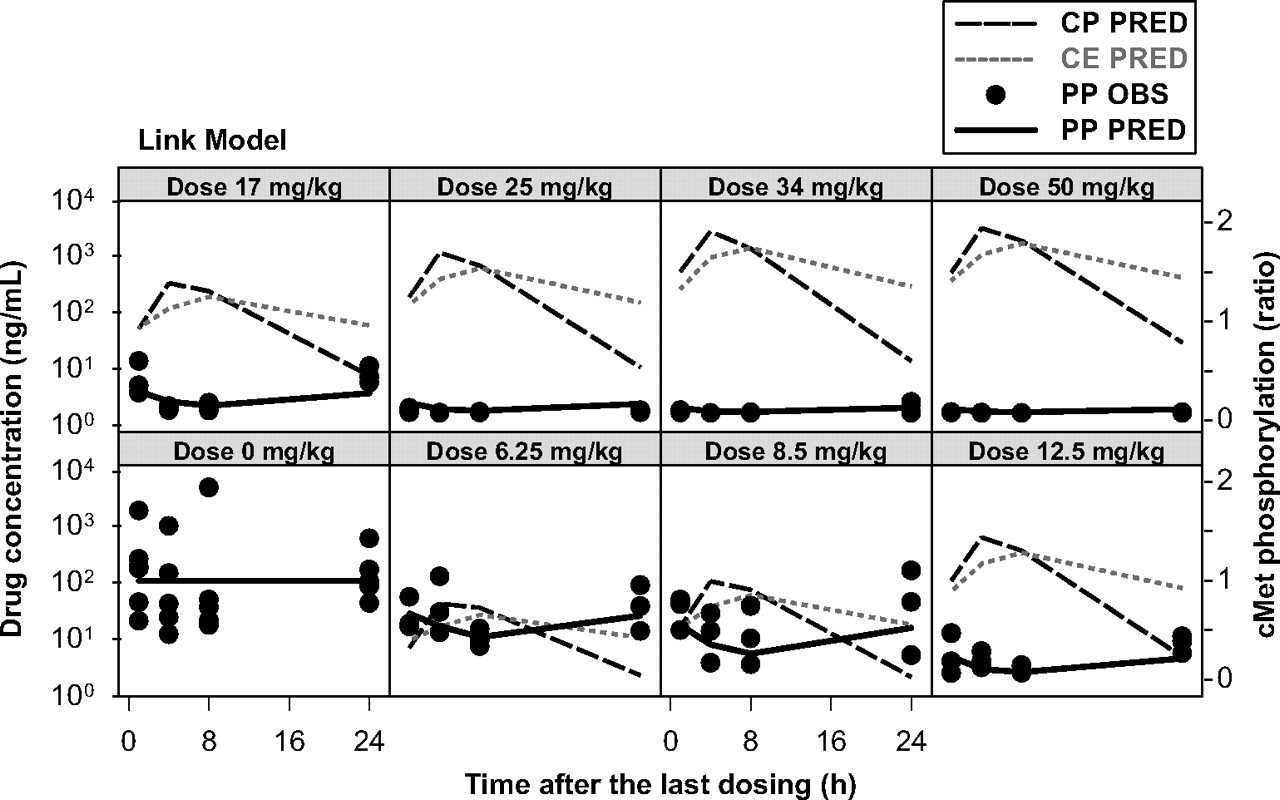
Observed and model-fitted cMet phosphorylation inhibition by PF02341066 in athymic mice implanted with GTL16 xenografts after repeated oral administration of PF02341066 (link model). CP PRED, model-fitted plasma concentrations of PF02341066; CE PRED, model-fitted concentrations of PF02341066 in the effect compartment; PP OBS, observed cMet phosphorylation (ratio to the mean of control animals), PP PRED, model-fitted cMet phosphorylation (ratio to the mean of control animals).

Observed and model-fitted cMet phosphorylation inhibition by PF02341066 in athymic mice implanted with GTL16 xenografts after repeated oral administration of PF02341066 (indirect response model with effect compartment). CP PRED, model-fitted plasma concentrations of PF02341066; CE PRED, model-fitted concentrations of PF02341066 in the effect compartment; PP OBS, observed cMet phosphorylation (ratio to the mean of control animals), PP PRED, model-fitted cMet phosphorylation (ratio to the mean of control animals).

Observed and model-fitted tumor growth inhibition by PF02341066 in athymic mice implanted with GTL16 xenografts after repeated oral administration of PF02341066. OBS, observed tumor volume; IPRE, model-fitted individual tumor volume.

Observed and model-fitted tumor growth inhibition by PF02341066 in athymic mice implanted with U87MG xenografts after repeated oral administration of PF02341066. OBS, observed tumor volume; IPRE, model-fitted individual tumor volume.
We evaluated PKPD relationships of the plasma concentrations of PF02341066 to the inhibition of cMet phosphorylation at steady state after multiple doses of PF02341066. In general, the application of conventional PKPD models assumes that the model parameters stay constant over time. Based on our preliminary studies, no tolerance or sensitization of cMet phosphorylation was observed between single-dose studies and multiple-dose studies. The inhibition of cMet phosphorylation was reversible and returned to the baseline level at the lower dose levels in the present studies. In addition, our pharmacokinetic studies of PF02341066 in rodents did not indicate accumulation and/or induction of PF02341066 plasma concentrations. Therefore, it was not necessary to incorporate time-dependent parameters to the present PKPD models.
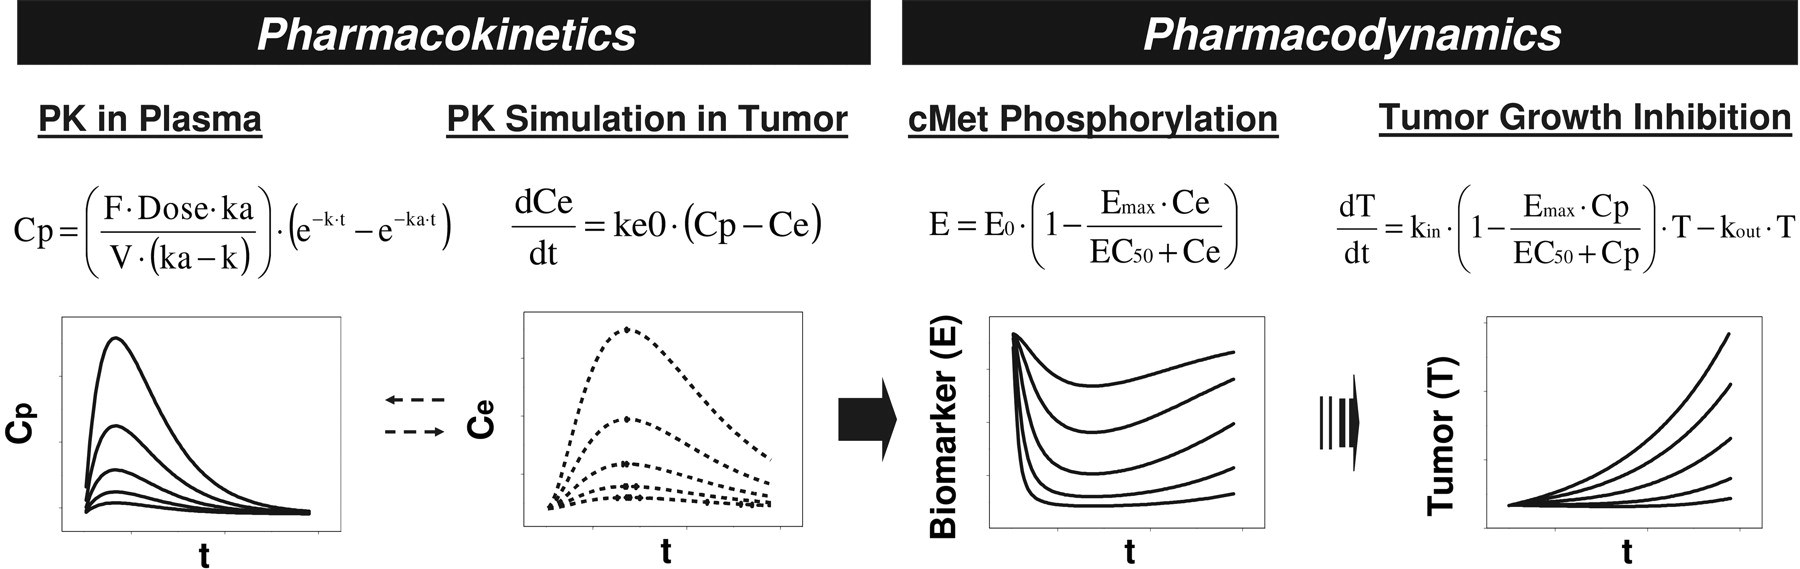
PKPD modeling summary of cMet phosphorylation inhibition and anti-tumor efficacy by PF02341066 in human tumor xenograft models.
It has long been recognized that in vivo tumor growth in xenograft models follows exponential growth in its early phases, subsequently follows a linear growth, and eventually reaches a plateau (Gompertz, 1825; Bissery et al., 1996). This inhibition is mainly reflected by the fact that a large tumor mass hampers the nutrient supply. Such growth curves can be described by a Gompertz model (Gompertz, 1825). However, a plateau phase is never observed in general xenograft model data sets. Therefore, some mathematical models have been proposed to characterize an exponential growth followed by a linear kinetics (Norton and Simon, 1977; Simeoni et al., 2004). In the present study, the exponential tumor growth inhibition model was used to quantitatively determine EC50 estimates of PF02341066. We first performed the exponential tumor growth model analysis, in which the first-order growth rate (kin) was inhibited by both the PF02341066 concentration and the tumor volume expressed as TG50, which inhibited 50% of the tumor growth rate. The TG50 values for the GTL16 and U87MG xenograft models were estimated to be greater than 10,000 mm3, which was much larger than the observed maximum tumor volumes. The model-fitted tumor growth curves in the GTL16 and U87MG xenograft models were superimposed between the two models with and without the TG50 estimation. The PKPD model was therefore simplified to the exponential tumor growth model without TG50. That is, the tumor growth rate was inhibited by only the PF02341066 concentration. Thus, the present approach is flexible enough to accurately characterize the growth patterns of different cell lines in xenograft models.
Regarding the biomarker-pharmacological response relationships between cMet phosphorylation and antitumor efficacy, the following relationships were apparently characterized: 1) the complete inhibition of cMet phosphorylation during the dosing interval, i.e., 24 h, was consistent with the complete tumor growth inhibition and 2) potent inhibition of cMet phosphorylation for only a portion of the dosing interval was consistent with suboptimal antitumor efficacy. In the present PKPD analyses, these findings were also characterized in a quantitative manner using the PKPD modeling for biomarker response and tumor growth inhibition. The PKPD results in the GTL16 xenograft model suggested that the EC50 value for tumor growth inhibition (213 ng/ml total) was equivalent to the EC90 value for cMet phosphorylation (167 ng/ml total). In addition, a similar dose-dependent effect of PF02341066 on cMet phosphorylation at 4 h postdose and tumor growth inhibition was observed in the U87MG xenograft model (Zou et al., 2007). The EC50 values for tumor growth inhibition were similar between the GTL16 (213 ng/ml total) and U87MG (94 ng/ml total) xenograft models (Table 3). The pharmacokinetic parameters of PF02341066 were also similar between the GTL16 and U87MG xenograft models (Table 1; Fig. 2). Collectively these findings suggest that the duration of cMet phosphorylation inhibition is important to maximize antitumor efficacy of PF02341066.
In conclusion, the PKPD relationship of the plasma concentrations of PF02341066 to the inhibitions of cMet phosphorylation and tumor growth in human tumor xenografts models were well characterized in a quantitative manner using the PKPD modeling described in the present study (Fig. 7). That is, the EC90 value (167 ng/ml) for the inhibition of cMet phosphorylation corresponded to the EC50 value (213 ng/ml) for the GTL16 tumor growth inhibition, suggesting that near-complete inhibition of cMet phosphorylation (>90%) is required to significantly inhibit tumor growth (>50%). Therefore, the EC90 value for the inhibition of cMet phosphorylation could be considered to be the minimum target efficacious concentration in the clinic. The PKPD modeling results also provide insights in the factor that determines the time course of the inhibition of cMet phosphorylation. That is, the distribution process of PF02341066 to target tissues could be a rate-limiting step in the pharmacodynamics of PF02341066. On the basis of the present preclinical PKPD modeling, an efficacious clinical dose of PF02341066 could be projected with accurately predicted or pharmacokinetic parameters obtained in patients by simulating near-complete inhibition of cMet phosphorylation (>90%) with the target efficacious concentrations. The present PKPD results will be helpful in determining the appropriate dosing regimen and in guiding dose escalation to rapidly achieve efficacious systemic exposure in the clinic.
Acknowledgments
We acknowledge the expert technical assistance of members of the PK Group (Pfizer Global Research and Development, San Diego, CA), Melissa Cook and Robert Hunter, for the animal experiments. We also thank Jean Cui, Michelle Tran-Dube, Pei-Pei Kung, and Mitch Nambu (Pfizer Global Research and Development) for synthesizing PF02341066.
Footnotes
-
Article, publication date, and citation information can be found at http://dmd.aspetjournals.org.
-
doi:10.1124/dmd.107.019711.
-
ABBREVIATIONS: PKPD, pharmacokinetic-pharmacodynamic; HGF, hepatocyte growth factor; PF02341066, (R)-3-[1-(2,6-dichloro-3-fluoro-phenyl)-ethoxy]-5-(1-piperidin-4-yl-1H-pyrazol-4-yl)-pyridin-2-ylamine; HPLC, high-performance liquid chromatography.
- Received November 12, 2007.
- Accepted March 31, 2008.
- The American Society for Pharmacology and Experimental Therapeutics


