


Abstract
Silymarin, used by 30 to 40% of liver disease patients, is composed of six major flavonolignans, each of which may contribute to silymarin's hepatoprotective properties. Previous studies have only described the pharmacokinetics for two flavonolignans, silybin A and silybin B, in healthy volunteers. The aim of this study was to determine the pharmacokinetics of the major silymarin flavonolignans in liver disease patients. Healthy volunteers and three patient cohorts were administered a single, 600-mg p.o. dose of milk thistle extract, and 14 blood samples were obtained over 24 h. Silybin A and B accounted for 43% of the exposure to the sum of total silymarin flavonolignans in healthy volunteers and only 31 to 38% in liver disease cohorts as a result of accumulation of silychristin (20–36%). Area under the curve (AUC0–24h) for the sum of total silymarin flavonolignans was 2.4-, 3.3-, and 4.7-fold higher for hepatitis C virus (HCV) noncirrhosis, nonalcoholic fatty liver disease (p ≤ 0.03), and HCV cirrhosis cohorts (p ≤ 0.03), respectively, compared with healthy volunteers (AUC0–24h = 2021 ng · h/ml). Caspase-3/7 activity correlated with the AUC0–24h for the sum of all silymarin conjugates among all subjects (R2 = 0.52) and was 5-fold higher in the HCV cirrhosis cohort (p ≤ 0.005 versus healthy). No correlation was observed with other measures of disease activity, including plasma alanine aminotransferase, interleukin 6, and 8-isoprostane F2α, a measure of oxidative stress. These findings suggest that the pharmacokinetics of silymarin is altered in patients with liver disease. Patients with cirrhosis had the highest plasma caspase-3/7 activity and also achieved the highest exposures for the major silymarin flavonolignans.
Silymarin, an extract of milk thistle (Silybum marianum), is an herbal medicine that has been used for centuries to self-treat liver disease. High public perception of silymarin's therapeutic benefits is suggested from the use of this complementary alternative medicine by 30 to 40% of patients with liver disease (Russo et al., 2001). Silymarin is composed of six major flavonolignans: silybin A (SA), silybin B (SB), isosilybin A (ISA), isosilybin B (ISB), silychristin (SC), and silydianin (SD). Antioxidant (Kren et al., 2000; Psotová et al., 2002), anti-inflammatory/immunomodulatory (Manna et al., 1999; Schümann et al., 2003), and antifibrotic (Crocenzi and Roma, 2006) properties of silymarin have been shown in various in vitro and animal models. Whether one or more of these six silymarin flavonolignans are responsible for potentially hepatoprotective effects in patients with liver disease is unknown.
Oxidative stress, inflammation, and fibrosis are characteristics of chronic liver disease and provide the rationale for investigations on the effect of silymarin on disease progression in the absence of direct antiviral activity. Although silymarin appears to be well tolerated, the therapeutic benefits of silymarin have not been consistently shown in various liver disease populations (Saller et al., 2001; Jacobs et al., 2002; Mayer et al., 2005; Rambaldi et al., 2007). For example, changes in standard surrogate clinical endpoints, such as serum alanine aminotransaminase (ALT), have not been observed in patients with chronic hepatitis C and early stage of disease (Buzzelli et al., 1994; Pár et al., 2000; Tanamly et al., 2004; Gordon et al., 2006). Other studies suggest silymarin may have antifibrotic activity and may decrease the complications of liver disease and mortality in patients with cirrhotic disease (Ferenci et al., 1989; Pares et al., 1998; Lucena et al., 2002). In addition, silymarin has been shown to reduce insulin resistance and lipid peroxidation in cirrhotic diabetic patients (Velussi et al., 1997), which are metabolic complications also observed in patients with nonalcoholic steatohepatitis. However, the use of different silymarin regimens and lack of information on the silymarin exposures attained in these various patient populations make it difficult to draw conclusions on the efficacy of silymarin and on which patient population should be targeted for further clinical investigation.
The pharmacokinetics for only two of the six major silymarin flavonolignans, SA and SB, have been extensively studied because they are also contained in two phospholipid formulations with better bioavailability, silipide and silybin-phytosome. However, neither of these formulations has been studied in patients with liver disease, and the pharmacokinetics of silymarin has only been described in healthy volunteers (Weyhenmeyer et al., 1992; Rickling et al., 1995; Wen et al., 2008). Extensive first-pass phase II metabolism presumably accounts for the low systemic exposures that have been observed with customary doses of silymarin. For example, plasma area under the plasma concentration-time curves (AUCs) for total flavonolignans (which reflect parent plus conjugated flavonolignans) have been reported to be 3- to 4-fold and 12- to 36-fold higher for SA and SB, respectively, compared with AUCs for parent flavonolignans (Weyhenmeyer et al., 1992; Rickling et al., 1995; Wen et al., 2008). Silymarin conjugates likely undergo primarily biliary excretion because only about 5% of the dose is recovered as conjugates in urine (Lorenz et al., 1984; Weyhenmeyer et al., 1992). Silymarin's disposition may be altered in liver disease since some phase II conjugation pathways and transporter proteins that could be involved in the active transport of flavonolignans have been shown to be decreased in patients with liver disease (Hinoshita et al., 2001; Congiu et al., 2002; Guardigli et al., 2005). Thus, differences in silymarin's pharmacokinetics and systemic exposures may account for inconsistencies in clinical outcomes that have been observed between patients with mild and cirrhotic liver disease.
To determine whether silymarin's disposition is influenced by the severity or type of liver disease, we conducted a single-dose pharmacokinetic study with a standardized milk thistle extract in three patient cohorts that differed by stage and type of liver disease. A healthy volunteer cohort was also included for comparison with patient cohorts and for reference to previous investigations. The pharmacokinetics of six major silymarin flavonolignans and their conjugates were determined and correlated with ALT and with 8-isoprostane F2α and caspase-3/7 activity as plasma measures of oxidative stress and apoptosis, respectively. Sulfate and glucuronide conjugate pools for the major silymarin flavonolignans were also examined to gain additional insight on how liver disease might influence silymarin's metabolism and disposition.
Materials and Methods
Subjects and Study Design. This single-dose, open-label, nonrandomized study enrolled five subjects into each of the four cohorts (n = 20). The primary objective of this study was to determine preliminary point estimates and variance information for the pharmacokinetic parameters AUC, Cmax, Tmax, CL/F, and t1/2 in healthy volunteers and in patients diagnosed with either hepatitis C virus (HCV) and minimal liver disease or cirrhosis, or nonalcoholic fatty liver disease (NAFLD) receiving a single 600-mg dose of milk thistle extract. Assuming an absence of disease effects, the selected sample size of n = 5 per each cohort was based on historical experience in healthy subjects and not on statistical considerations. However, an a priori power calculation suggested that a two-sided t test would have 90% power to detect a 2.5-fold increase in the AUC for total SA + SB at an α = 0.05 using previously reported mean and variance data from healthy volunteers (Weyhenmeyer et al., 1992).
Male and female subjects aged 18 to 65 years with a body weight ≥ 50 kg were eligible without regard to smoking status. A healthy volunteer cohort was identified by medical history, screening physical examination, vital signs, and clinical laboratory measurements. Two chronic HCV patient cohorts consisted of nonresponders to interferon-based therapies: one cohort without cirrhosis (Metavir stage I or II) and the other with cirrhosis (Metavir stage III or IV). The final patient cohort consisted of NAFLD patients confirmed by a diagnostic biopsy within 6 months of study participation or by serologies that confirmed the exclusion of other liver diseases. Exclusion criteria included pregnant or lactating females, other active liver diseases, HIV coinfection, history of pancreatic or biliary disease, acute illness that would interfere with drug absorption, allergy or hypersensitivity reaction to milk thistle or any of its components, use of any silymarin-containing product within 30 days before enrollment, or use of alcohol within 48 h of enrollment. Concomitant use of p.o. contraceptives or inhibitors or inducers of cytochrome P450 3A4 or 2C9 were also excluded because of theoretical concerns for potential drug interactions (Beckmann-Knopp et al., 2000).
Subjects were fasted overnight for 8 to 12 h and then received a single, 480-mg p.o. dose of silymarin administered as two 300-mg milk thistle capsules with approximately 240 ml of water. A low-fat research breakfast, lunch, or dinner was served immediately after each dose. Meals were served between 8:30 and 9:00 AM, 12:00 and 1:30 PM, and 5:00 and 7:00 PM. Fourteen serial blood samples were collected at time points 0, 0.25, 0.5, 0.75, 1, 1.5, 2, 3, 4, 5, 6, 8, 12, and 24 h after silymarin dosing.
The study was conducted at the Verne S. Caviness General Clinical Research Center at the University of North Carolina at Chapel Hill. The study protocol and subject-informed consent were approved by The University of North Carolina institutional review board, and the study was conducted according to the Declaration of Helsinki. All the subjects provided written informed consent before enrollment.
Silymarin Dose. A common, commercially available milk thistle extract used by many patients seen at the University of North Carolina Hepatitis Clinic (Nutraceutical Sciences Institute, Boynton Beach, FL) was selected for investigation. According to manufacturer's labeling, each capsule contained 300 mg of milk thistle extract prepared from seed and was standardized as 80% (240 mg) silymarin. All the doses were administered from Lot 0418901. The specific flavonolignan content of this milk thistle extract has been previously determined by our laboratory (Wen et al., 2008) as follows: 37.7 mg, SA; 58.8 mg, SB; 14.8 mg, ISA; 6.3 mg, ISB; 39.2 mg, SC; and 15.3 mg, SD. Therefore, these six flavonolignans account for 172 mg, or 57%, of the 300-mg milk thistle extract contained in each capsule (Wen et al., 2008).
Silymarin Flavonolignan Plasma Concentrations. Whole blood samples were collected in two 3-ml EDTA-lined tubes (K2-EDTA tubes; BD, Franklin Lakes, NJ) and centrifuged at 2400 rpm for 10 min at 4°C. The plasma was collected, frozen, and stored at –20°C until analysis. Plasma concentrations of the six silymarin flavonolignans were quantified using a recently described liquid chromatography (LC)/mass spectrometry (MS) method (Wen et al., 2008). Briefly, 100-μl aliquots of the plasma samples were used to determine parent (i.e., nonconjugated) or total (i.e., parent + conjugates) flavonolignan concentrations after a 6-h incubation at 37°C in the absence or presence of a mixture of sulfatase (80 U/ml) and β-glucuronidase (8000 U/ml) (Sigma-Aldrich, St. Louis, MO), respectively. Plasma concentrations of flavonolignan conjugate were estimated by taking the difference in parent flavonolignan plasma concentrations before and after enzymatic hydrolysis with β-glucuronidase and sulfatase. This subtraction method provides an estimate of plasma concentrations of silymarin conjugates expressed in terms of “parent flavonolignan equivalents.” Plasma samples were also incubated with either enzyme separately to study the effect of liver disease on silymarin's two pathways of phase II metabolism. Concentrations of sulfate and glucuronide conjugates were determined at the Tmax, 1.5 h postdose, for SB and ISA (see Fig. 3) because they exhibited the highest Cmax and AUC0–24h for total flavonolignan concentrations in plasma among the six flavonolignans.
Flavonolignans were separated using an Agilent HP 1050 LC system (Palo Alto, CA) and a Luna C18 column (50 × 2.0 mm i.d., 3 μm) and a methanol/1% acetic acid (44:56 v/v, pH 2.8) mobile phase with isocratic elution at a flow rate of 0.3 ml/min and a run time of 12 min. MS analysis and detection were conducted using an API 100 LC/MS system (PerkinElmer Sciex, Toronto, ON, Canada) with a TurboIonSpray interface in the negative electrospray ionization mode. The limit of detection and linear quantitative range for the six silymarin flavonolignans were 2 to 1000 and 5 to 1000 ng/ml, respectively. Intraday and interday precisions were 1.7 to 11%, and 4.5 to 14%, respectively. For authentic reference standards, the composition of silybin (Silibinin; Sigma-Aldrich) was confirmed to be a mixture of SA and SB by LC/electrospray ionization/MS, and the specific contents of SA and SB were analyzed to be 48 and 52%, respectively. SC was obtained from ChromaDex (Santa Ana, CA), and SD was purchased from U.S. Pharmacopoeia (Rockville, MD). ISA and ISB reference standards were obtained as a gift from Ulrich Mengs (Madaus GmbH, Köln, Germany).
Measures of Liver Disease Activity. Plasma interleukin (IL)-6 (Quantikine HS; R&D Systems, Minneapolis, MN) and 8-isoprostane F2α (direct enzyme-linked immunosorbent assay; Assay Designs, Ann Arbor, MI) concentrations were determined according to manufacturer instructions. Plasma caspase-3/7 activity (Caspase-GLO 3/7 assay; Promega, Madison, WI) was measured using a recently described method by Seidel et al. (2005) with the following modifications: plasma was diluted 1:10 in buffer and incubated with substrate for 2h.
Pharmacokinetic and Statistical Analysis. Pharmacokinetic parameters including AUC from time 0 to 24 h (AUC0–24h), maximum plasma concentration (Cmax), time to Cmax (Tmax), apparent clearance [total oral clearance divided by bioavailability (CL/F)], and terminal half-life (t1/2) were calculated for the six parent and total silymarin flavonolignans for each subject using noncompartmental methods, WinNonlin-Pro (version 4.1; Pharsight Corp, Mountain View, CA). AUC was calculated by the linear up/log down trapezoidal method to the last time point (AUC0–24h). For CL/F calculations, the dose of each silymarin flavonolignan was determined from their specific content in the Nutraceutical Sciences Institute milk thistle product as described above. All pharmacokinetic parameters are reported as geometric means with their 95% confidence intervals. A one-way analysis of variance was conducted on natural log-transformed data using the Dunnett's multiple comparison to test for significant differences between the healthy control group and each of the three different liver disease patient cohorts, p < 0.05 significant (SAS JMP 6.0.0; SAS Institute, Inc., Cary, NC).
Results
Subjects. The demographics for study participants are presented in Table 1. The mean age for the three patient cohorts was approximately 20 years older than the healthy cohort. Serum ALT (normal, male: 19–72 U/l; female: 12–48 U/l) was approximately 2-fold higher for both HCV noncirrhosis and NAFLD cohorts and approximately 4-fold higher for the HCV cirrhosis cohort compared with the healthy cohort. The HCV cirrhosis cohort was characterized by a lower platelet count (normal 155–440 cells/mm3), whereas total bilirubin (normal 0–1.2 mg/dl) was similar across all the cohorts, indicative of well compensated liver disease. Renal function was normal (CrCl >60 ml/min) for all the study subjects.
Subject characteristics
Data are presented as mean values ± S.D. unless otherwise specified.
Pharmacokinetics of Parent Silymarin Flavonolignans. The plasma Cmax and AUC0–24h for six major silymarin flavonolignans are presented in Table 2. SA and SB were the main flavonolignans in the plasma for all the cohorts, and their Cmax ranged from 12 ng/ml (healthy) up to 69 ng/ml (HCV cirrhosis) and from 9 ng/ml (healthy) up to 40 ng/ml (NAFLD), respectively. SA and SB exposures (AUC0–24h) were also higher in patient cohorts compared with the healthy cohort. Cmax and AUC0–24h for the other silymarin flavonolignans (ISA, ISB, SC, and SD) were only consistently quantifiable in the liver disease cohorts. The HCV cirrhosis cohort had the highest AUC0–24h for all the silymarin flavonolignans. Absorption from the gastrointestinal tract was rapid for all the cohorts as indicated by a median Tmax between 0.5 and 2 h for the various flavonolignans. By 6 h postdose, flavonolignan concentrations had fallen below the detection limit in a majority of subjects because of short elimination half-lives (0.6–1.6 h) for the silymarin flavonolignans observed in all the cohorts (data not shown).
Pharmacokinetics of parent silymarin flavonolignans
Data are presented as geometric means (95% CI).
The apparent clearances for the six major silymarin flavonolignans have not been previously reported and are also presented in Table 2. CL/Fs for SA and SB were between 27 and 48% and 33 and 51% lower, respectively, in the HCV cohorts compared with the healthy cohort. However, these differences were not detected as significant because of large intersubject variability. CL/F for the NAFLD cohort was comparable with the healthy cohort. These data suggest that both liver disease etiology and disease stage may be associated with decreases in the clearance of parent silymarin flavonolignans that may result in increased exposures compared with those observed in healthy volunteers.
Pharmacokinetics of Total Silymarin Flavonolignans.Table 3 depicts the plasma Cmax and AUC0–24h for the total (parent + conjugates) concentration of each silymarin flavonolignan, which were determined following complete enzymatic hydrolysis of conjugates (sulfates and glucuronides) as described under Materials and Methods. Cmax and AUC0–24h for the total concentration of each silymarin flavonolignan were increased by similar extents (1.8–6.3-fold and 1.2–9.9-fold, respectively) in patient cohorts compared with healthy volunteers. The highest exposures were observed for SB, ISA, and SC across all the disease cohorts and were highest in the HCV cirrhosis cohort (p ≤ 0.02). To determine exposures to the total amount of the six silymarin flavonolignans in blood for each cohort, AUC0–24h for the total concentration of each flavonolignan was summed and evaluated across the four cohorts. AUC0–24h for the sum of total silymarin flavonolignans was 2.4-, 3.3-, and 4.7-fold higher for the HCV noncirrhosis, NAFLD (p ≤ 0.03), and HCV cirrhosis (p ≤ 0.03) cohorts, respectively, compared with healthy volunteers (AUC0–24h = 2021 ng · h/ml).
Pharmacokinetics of total (parent + conjugated) silymarin flavonolignans
Data are presented as geometric means (95% CI).
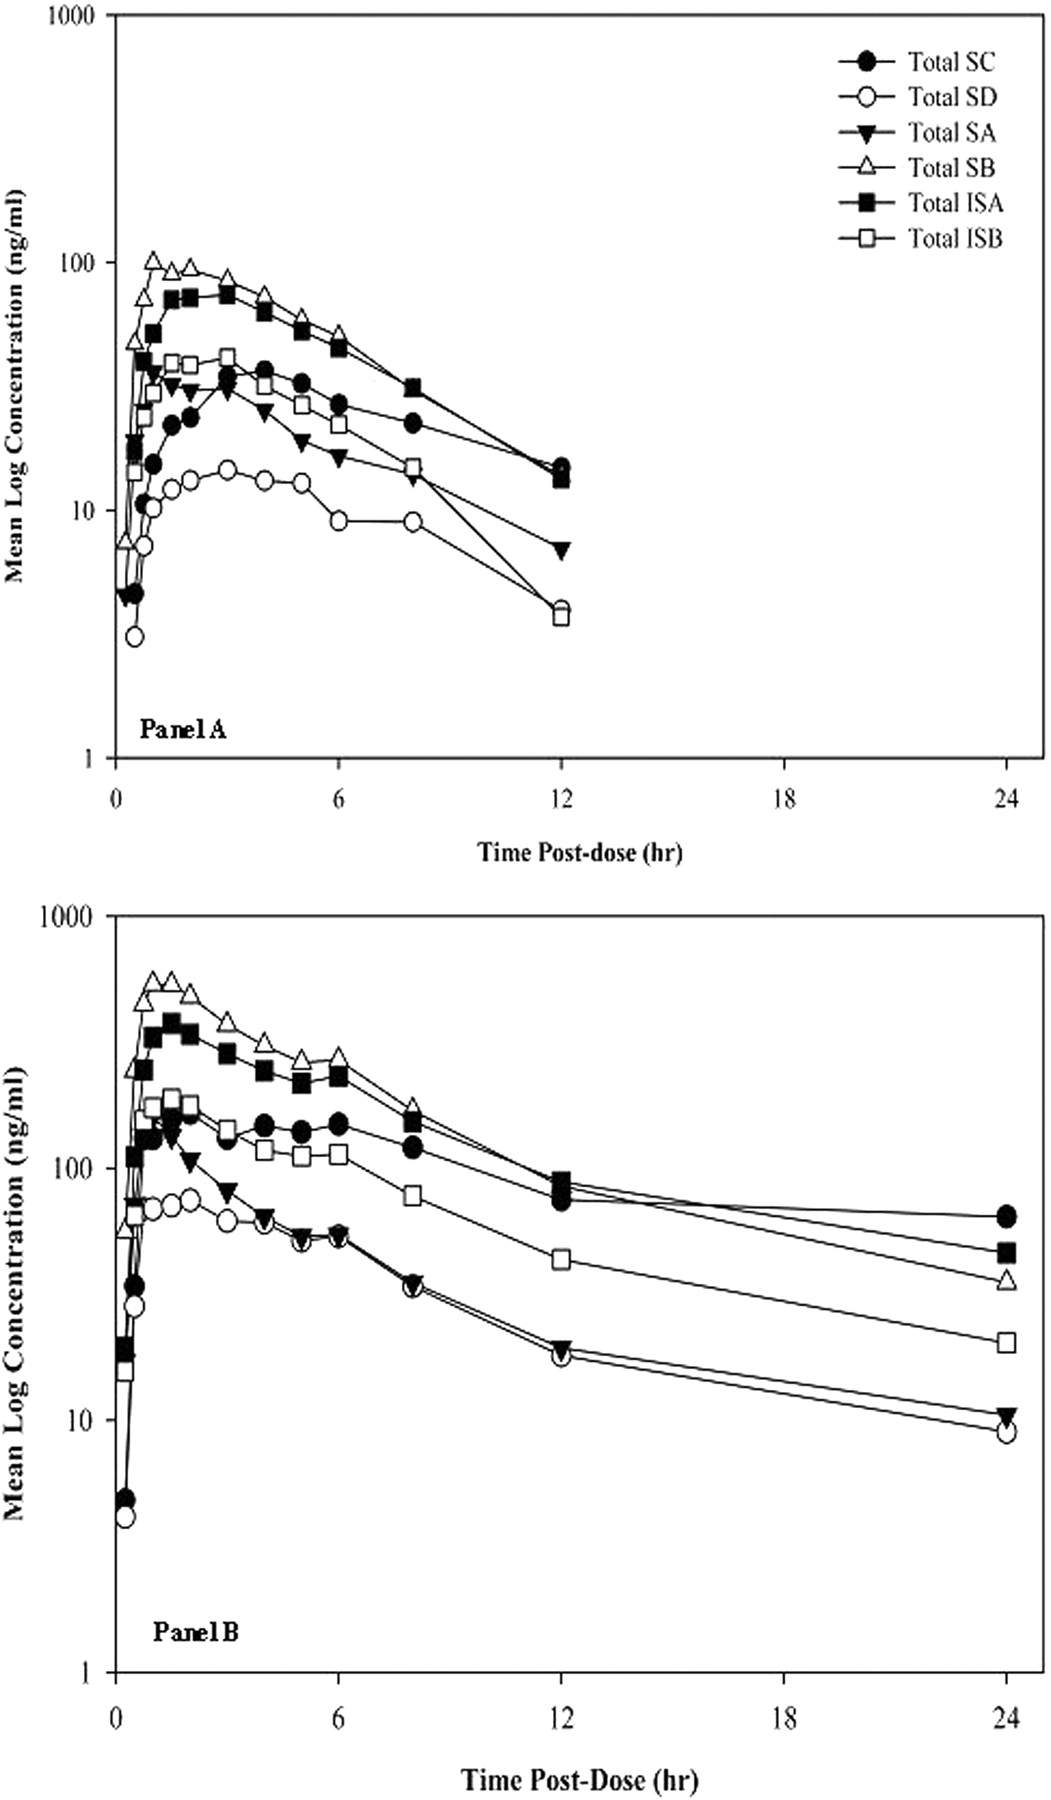
Terminal elimination half-lives for the silymarin flavonolignans ranged from 4 to 10 h for the healthy cohort compared with 8 to 25 h in the patient cohorts. The effect of liver disease on the plasma pharmacokinetics for total silymarin flavonolignans is best depicted by comparing the concentration versus time profiles between healthy and HCV cirrhosis cohorts for each silymarin flavonolignan. As seen in Fig. 1, the concentration versus time profiles for each of the six total silymarin flavonolignans were elevated in patients with HCV cirrhosis (Fig. 1B) over the 24-h sampling period compared with those in healthy volunteers (Fig. 1A). Time versus concentration profiles for the HCV noncirrhotic and NALFD cohorts were intermediate to those of the healthy and HCV cirrhosis cohorts and are reflected in the AUC0–24h data depicted in Table 3.
Pharmacokinetics of Silymarin Flavonolignan Conjugates. To more clearly determine the influence of disease type and severity on the disposition of silymarin conjugates, a “conjugate pool” concentration was calculated at each time point for all the cohorts. First, the conjugate (sulfates + glucuronides) concentrations for each silymarin flavonolignan were obtained from the difference between parent (Table 2) and total (Table 3) plasma concentrations. Then the conjugate concentrations for all six silymarin flavonolignans were summed to obtain a “sum silymarin conjugates” concentration. Figure 2 depicts, for each cohort, the concentration versus time profiles for sum silymarin conjugates expressed in terms of “parent flavonolignan equivalents.” These concentration data were used to determine the sum silymarin conjugates AUC0–24h, which are also depicted in Fig. 2 (see Table inset). Compared with healthy volunteers, sum silymarin conjugates AUC0–24h were 2.4-, 3.3-, and 4.7-fold greater in HCV noncirrhosis, NAFLD, and HCV cirrhosis cohorts, respectively. The sum silymarin conjugates Cmax (data not shown) and AUC0–24h were significantly elevated in the NAFLD and HCV cirrhosis cohorts compared with the healthy cohort (p ≤ 0.03). These increases in sum silymarin conjugates AUC0–24h are similar to the increases observed for the sum of total silymarin flavonolignans AUC0–24h because flavonolignan conjugates account for 97 to 99% of total flavonolignan concentrations. The elimination half-life for patient cohorts ranged from 8 to 10 h compared with 4 h for the healthy cohort. Although the 24-h sampling interval did not allow precise estimates of the terminal elimination phase, these data suggest that the elimination of silymarin conjugates is more prolonged in liver disease.
Silymarin Flavonolignan Metabolism.Figure 3 depicts the relative proportions of glucuronide conjugates for SB and ISA, which were between 77 and 86% and 14 and 23%, respectively, across all the cohorts. Whereas the primary route of metabolism was glucuronidation for SB and sulfation for ISA, there were no significant effects of disease severity or type on the extent of their conjugation. These data indicate that the higher silymarin flavonolignan conjugate exposures observed in patient cohorts did not reflect alterations in preferred pathways of phase II metabolism.
Measures of Disease Activity. To determine whether changes in sum silymarin conjugates AUC0–24h were associated with various measures of liver disease activity, the sum silymarin conjugates AUC0–24h was correlated with measures of oxidative stress and apoptosis in plasma for each of the 20 subjects. As seen in Fig. 4, the sum silymarin conjugates AUC0–24h correlated with plasma caspase-3/7 activity (R2 = 0.52, p < 0.001), a measure of apoptosis. Compared with healthy volunteers, plasma caspase-3/7 activity was 1.3-, 1.1-, and 4.7-fold higher in HCV noncirrhosis, NAFLD, and HCV cirrhosis (p ≤ 0.005) cohorts, respectively. In contrast, no correlations were observed with plasma concentrations of either 8-isoprostane F2α (Fig. 3 inset), a biomarker of oxidative stress, or between IL-6 and ALT across all the patients, and significant differences between cohorts were not detected (data not shown).
Discussion
Single daily doses of silymarin up to 1260 mg/day (Huber et al., 2005; Gordon et al., 2006) have only been studied in patients with early stage liver disease, whereas other trials in patients with advanced disease have used thrice-daily doses of 140 or 150 mg (Ferenci et al., 1989; Pares et al., 1998; Lucena et al., 2002). Previous clinical trials have failed to include measures of silymarin exposure, and the inconsistent reports of silymarin's clinical benefits may reflect variation in the exposures attained because of either the effects of liver disease on silymarin's pharmacokinetics or the different dosing regimens used. This is the first investigation of the pharmacokinetics of the six major silymarin flavonolignans and their conjugates in patients with different types and stages of liver disease. Exposures for parent silymarin flavonolignans were generally higher in patient cohorts, especially for ISA, ISB, and SC, which were not detected in healthy volunteers. However, these exposures were not maintained past 6 h postdose as a result of low Cmax concentrations and short half-lives. These data suggest that the silymarin dosing regimens currently used by patients to self-treat their liver disease or previously evaluated in clinical trials may not provide adequate plasma exposures to obtain the antioxidant, anti-inflammatory, or antifibrotic benefits of silymarin.

Total (parent + conjugated) concentration versus time profiles of the six major silymarin flavonolignans in healthy volunteers (A) and HCV patients with cirrhosis (B). A, contains the legend for Fig. 1. The linear quantitative range for the six silymarin flavonolignans by the LC/MS assay is 5 to 1000 ng/ml.

Sum silymarin conjugates versus time profile for each cohort. Table inset depicts the geometric means (95% CI) for sum silymarin conjugates AUC0–24h (expressed as “parent flavonolignan equivalents”); *, p ≤ 0.03, comparisons with the healthy cohort.

The percentage of total conjugates that are glucuronides for SB and ISB at 1.5-h postdose. Bars represent the cohorts: healthy, open; HCV noncirrhotic, gray; cirrhotic cohort, black; and NAFLD, white-hatched.
Previous silymarin pharmacokinetic studies in healthy subjects have underestimated total silymarin exposures because they have only focused on SA and SB, which are the major silymarin flavonolignans in milk thistle extracts. SA and SB comprised 56% of the flavonolignans in the milk thistle extract used in this study (Wen et al., 2008), but they accounted for only 43% of the sum of total silymarin flavonolignan exposure in healthy volunteers. In patients with liver disease, SA and SB accounted for even less of the sum of total silymarin flavonolignans (31–38%) as a result of the accumulation of SC, which accounted for 18% in healthy subjects and 20 to 36% in patients with liver disease. All the silymarin flavonolignans have been shown to have potent antioxidant activity (Psotová et al., 2002; Kvasnicka et al., 2003), and therefore they may contribute significantly to the clinical effects of silymarin in patients with liver disease.
The increases in peak plasma concentrations and exposures for parent silymarin flavonolignans in patients with liver disease most likely reflect increased intestinal absorption by the gastrointestinal tract and not decreased phase II conjugation by either the gut or liver because total silymarin conjugates were also increased. Hepatic and gastrointestinal tissues share many of the same drug transporters that are involved in the absorption of flavonolignans (Cermak and Wolffram, 2006; Morris and Zhang, 2006), and biliary obstruction results in changes in transporter expression in both rat liver and intestine (Kamisako and Ogawa, 2007). Because hepatic expression of many of these drug transporters may be down-regulated in chronic HCV (Hinoshita et al., 2001), the increased absorption of silymarin flavonoilgnans may reflect a similar down-regulation of transporters within the gastrointestinal tract, such as multidrug resistance protein 2, that may normally limit the absorption of silymarin flavonolignans.

Correlation of sum silymarin conjugates AUC0–24h (expressed as “parent flavonolignan equivalents”) with measures of liver disease activity among all the study participants. Caspase-3/7 activity correlated with sum silymarin conjugates AUC0–24h (R2 = 0.52, p < 0.001). Plasma 8-isoprostane F2α did not correlate with sum silymarin conjugates AUC0–24h (R2 = 0.01, p > 0.9), see inset. RLU, relative light units.
In our study, the most significant alteration in the disposition of silymarin in patients with liver disease was reflected in the plasma concentrations for the sum of total silymarin flavonolignans where exposures were 2.4- to 4.7-fold higher in patient cohorts compared with healthy volunteers. The difference in the mean age between the healthy cohort (30 ± 17 years) and liver disease cohorts (e.g., 53 ± 4 years HCV cirrhosis) may be a limitation to our study because of the potential for age-related differences in metabolism. However, it is unlikely that the 2.4- to 4.7-fold differences in silymarin exposures between liver disease cohorts and healthy volunteers can be explained by age differences because ages overlap between cohorts and significant influences of age on the disposition of drugs that primarily undergo high first-pass, phase II metabolism by the glucuronosyl transferase system have not been observed.
The extent of phase II conjugation by either glucuronidation or sulfation pathways for SB and ISA was unaffected by liver disease stage or type. Therefore, the elevated plasma levels of phase II conjugates of silymarin may result primarily from alterations in hepatic excretion processes rather than from increased phase II metabolism. Similar increases in flavonolignan exposures have been reported in a rat model of cirrhosis where an approximately 2-fold increase in plasma AUC for SA and SB conjugates was correlated with a 50% reduction in the bile/blood exposure ratio for SA and SB conjugates in cirrhotic rats compared with control (Wu et al., 2008). In humans, decreased biliary excretion of flavonolignan conjugates may potentially influence the efficacy of silymarin as a result of reduced enterohepatic recycling and return of parent flavonolignans via portal blood. In addition, different types of liver disease or liver injury have been shown to induce different changes in the expression of hepatic transporters in humans (Barnes et al., 2007) and in animal models (Lickteig et al., 2007).
Our data suggest that one measure of liver disease activity, a simple biochemical assay of caspase-3/7 activity in blood, may be useful for predicting the disposition of drugs that undergo extensive conjugation and biliary elimination like silymarin in patients with liver disease. In patients with chronic HCV, apoptosis and serum caspase-3/7 activity correlate with liver disease grade and stage (Calabrese et al., 2000; Bantel et al., 2001, 2004; Seidel et al., 2005). Caspase-3/7 activity reflects the net contributions of several activators of apoptosis because of their downstream location in both the intrinsic and extrinsic pathways of apoptosis. In contrast to caspase-3/7 activity, plasma levels of 8-isoprostane F2α, IL-6, and serum ALT values did not correlate with AUC0–24h for sum silymarin conjugates. Altered hepatic expression of biliary transporters was shown to be independent of the inflammation and oxidative stress associated with bile duct ligation (Wagner et al., 2005). Therefore, other components of disease activity, perhaps related to the development of cirrhosis, may account for the association between caspase-3/7 activity and altered disposition of silymarin conjugates, which was most apparent in the HCV cirrhotic cohort. Alternatively, hepatocytes undergoing apoptosis may represent that fraction of the liver with decreased ability to eliminate conjugates of silymarin flavonolignans.
It is not known whether parent or conjugated silymarin flavonolignans are responsible for silymarin's purported therapeutic effects because both silybin and its 7-glucuronide conjugate have shown antioxidant activity in vitro at a concentration of 330 μM (Kren et al., 2000). Recently, the antiviral activity of a standardized silymarin extract was shown in an in vitro cell culture model of HCV replication at concentrations ranging between 20 and 40 μM (Polyak et al., 2007). In our study, the peak plasma concentration for all the silymarin flavonolignans combined only amounted to 0.5 μM (225 ng/ml) for HCV patients with cirrhosis, who achieved the highest levels of exposure following a customary dose of silymarin. Therefore, customary doses of silymarin are not likely to achieve the plasma concentrations required for the antioxidant and antiviral effects of silymarin.
Silymarin exposures have been underestimated in previous studies because of their failure to quantitate the six major silymarin flavonolignans. Therefore, future clinical investigations should be directed toward an evaluation of the independent roles of the major silymarin flavonolignans and their conjugates to determine their effects in various liver disease populations. However, before such studies are undertaken, pharmacokinetic studies that examine higher, multiple daily silymarin dose regimens in patients with liver disease are needed to identify regimens that provide optimal 24-h exposures. To this end, a Phase I double-blind, randomized clinical trial has been undertaken to evaluate the safety, tolerability, and pharmacokinetics of silymarin in a dose escalation manner in both noncirrhotic HCV and NAFLD patients.
Acknowledgments
We thank Trang Nguyen for assistance with sample preparation, Dr. Sonia Miranda for assistance with the caspase-3/7 and 8-isoprostane F2α assays, and Dr. Heyward Hull for providing statistical consultation.
Footnotes
-
This work was supported by the National Institutes of Health Grants K24 DK066144 and RR00046 from the General Clinical Research Centers program of the Division of Research Resources.
-
Article, publication date, and citation information can be found at http://dmd.aspetjournals.org.
-
doi:10.1124/dmd.107.019604.
-
ABBREVIATIONS: SA, silybin A; SB, silybin B; ISA, isosilybin A; ISB, isosilybin B; SC, silychristin; SD, silydianin; ALT, alanine aminotransaminase; AUC, area under the plasma concentration-time curve; HCV, hepatitis C virus; NAFLD, nonalcoholic fatty liver disease; LC/MS, liquid chromatography/mass spectrometry; IL, interleukin.
- Received November 1, 2007.
- Accepted June 18, 2008.
- The American Society for Pharmacology and Experimental Therapeutics


