


Abstract
New, more efficient methods of estimating unbound drug concentrations in the central nervous system (CNS) combine the amount of drug in whole brain tissue samples measured by conventional methods with in vitro estimates of the unbound brain volume of distribution (Vu,brain). Although the brain slice method is the most reliable in vitro method for measuring Vu,brain, it has not previously been adapted for the needs of drug discovery research. The aim of this study was to increase the throughput and optimize the experimental conditions of this method. Equilibrium of drug between the buffer and the brain slice within the 4 to 5 h of incubation is a fundamental requirement. However, it is difficult to meet this requirement for many of the extensively binding, lipophilic compounds in drug discovery programs. In this study, the dimensions of the incubation vessel and mode of stirring influenced the equilibration time, as did the amount of brain tissue per unit of buffer volume. The use of casette experiments for investigating Vu,brain in a linear drug concentration range increased the throughput of the method. The Vu,brain for the model compounds ranged from 4 to 3000 ml · g brain–1, and the sources of variability are discussed. The optimized setup of the brain slice method allows precise, robust estimation of Vu,brain for drugs with diverse properties, including highly lipophilic compounds. This is a critical step forward for the implementation of relevant measurements of CNS exposure in the drug discovery setting.
Current drug discovery programs strategically focus on achieving a mechanistic and quantitative understanding of the time course of pharmacological effects and how they are related to drug exposure and the drug-target interaction. This approach identifies key issues for lead optimization as well as facilitating predictions of human exposure to the drug. A critical step in the establishment of these pharmacokinetic-pharmacodynamic relationships is the estimation of exposure to the drug in experimental animals. The unbound drug concentration in plasma is the most relevant and convenient measure of systemic exposure. For centrally acting drugs, however, the blood-brain barrier can regulate drug exposure in the CNS, and the unbound plasma concentration may no longer reflect the concentration at the target site. Our definition of CNS exposure is the unbound drug concentration in the brain interstitial fluid, Cu,brainISF, which surrounds most central drug targets. If a drug target is intracellular, however, exposure would be best defined as the unbound drug concentration in the intracellular fluid. This concentration is regulated not only by events at the blood-brain barrier but also by drug transporters at the brain cell plasma membrane (Dallas et al., 2006).
Calculation of Cu,brainISF, a rational and increasingly common approach in drug discovery for assessing CNS exposure, is approached by measuring the amount of drug in brain tissue (Abrain) and estimating the unbound brain volume of distribution (Vu,brain) in vitro (eq. 1):  The range of unbound drug ISF concentrations for investigated drugs covers only 2 orders of magnitude when normalized to the unbound drug plasma concentration (Hammarlund-Udenaes et al., 2008). In contrast, intrabrain distribution as described by Vu,brain is hugely variable between compounds, spanning 5 orders of magnitude from the hydrophilic morphine glucuronides (Bouw et al., 2001) to the lipophilic thioridazine used in this study. As a consequence, it can be inferred that nonspecific brain tissue partitioning, rather than blood-brain barrier transport properties, dominates the amount of drug measured in whole brain tissue samples. This accentuates the importance of determining Vu,brain in conjunction with analysis of brain tissue samples for the assessment of drug exposure in the CNS.
In a previous study, we established in vivo agreement with in vitro methods for estimating Vu,brain by comparing in vitro data with microdialysis data (Fridén et al., 2007). In vivo agreement for the brain slice method was superior to that for the brain homogenate binding method (Kalvass and Maurer, 2002; Mano et al., 2002), presumably because the intact cells of the slice have functional transporters and because the extra- to intracellular pH gradient is similar to that in vivo, whereas the cells in the homogenate are destroyed. There is an interesting extension to this in that the homogenate and slice methods can be used in combination to assess the intracellular exposure to unbound drug (Fridén et al., 2007). However, the slice method is sufficient when combined with in vivo data for assessing extracellular CNS exposure.
The critical issue identified with our previously published method and similar set-ups is the long incubation time needed to reach equilibrium between the slice and the buffer. Only when equilibrium has been reached will the concentration of drug in the buffer be equal to the concentration of unbound drug in the slice ISF, which is the basis for the calculation of Vu,brain. The time to reach this equilibrium increases with increasing Vu,brain (Becker and Liu, 2006; Fridén et al., 2007). If there is insufficient time allowed for equilibration, there is a risk of underestimating Vu,brain. The set of compounds used in our previous study was somewhat biased toward hydrophilic drugs because of a lack of microdialysis data on lipophilic drugs. However, many compounds in drug discovery programs are very lipophilic and would require much longer equilibration times. Increasing the incubation time would seem to be the natural solution to the problem, but the viability of the slices is likely to decrease with prolonged incubation times and the advantages of studying distribution in viable tissue would be lost.
The aims of this study were to provide an in depth analysis of the influence of experimental conditions on the time to reach equilibrium and to describe the development of a high-throughput brain slice method capable of determining the Vu,brain of drug compounds up to 3000 ml · g brain–1. The optimized method provides an opportunity for efficiently obtaining relevant estimates of extra- or intracellular CNS exposure to drug molecules in the drug discovery setting.
Materials and Methods
Compound Selection. To characterize the brain slice method, six model compounds were selected (Table 1). Thioridazine and paroxetine are lipophilic bases that are expected to have extremely high Vu,brain values due to extensive binding in brain tissue. The neutral, lipophilic, poorly soluble rimonabant was included to detect problems related to solubility or adsorption to materials used. Collectively, these compounds were chosen to represent the extremes of lipophilicity and to give an indication of the operational range of the slice method. The moderately lipophilic and neutral diazepam and acidic indomethacin were also included to further demonstrate pH-dependent cellular uptake. Finally, to capture the functionality of the amino acid transporter (Su et al., 1995), gabapentin was included.
Physicochemical description of drugs included in the study
Values of logD7.4 (ACDLogD pH 7.4) and pKa (ACDpKa) were calculated using ACDlabs databases (version 9.03; Advanced Chemistry Development Inc., Toronto, ON, Canada).
Chemicals. Diazepam, [14C]inulin, paroxetine, and thioridazine were obtained from Sigma-Aldrich (St. Louis, MO). Gabapentin was purchased from Toronto Research Chemicals Inc. (Toronto, ON, Canada). Tritiated water was purchased from PerkinElmer Life and Analytical Sciences (Waltham, MA). [14C]Dimethyloxazolidinedione was purchased from American Radiolabeled Chemicals (St. Louis, MO). All other chemicals were of analytical grade. All solvents were of HPLC grade.
Animals. Male Sprague-Dawley rats (Harlan, Horst, The Netherlands) weighing 300 to 400 g were used for in vitro brain slice experiments and preparation of brain homogenate. All animals were group-housed at 18 to 22°C under a 12-h light/dark cycle with free access to food and water for at least 5 days before the experiment. The study was approved by the Animal Ethics Committee of Gothenburg (412-2005).
Procedures for Investigating the Experimental Conditions of the Slice Method. The efficiency of different modes of buffer agitation was studied in incubation vessels of different dimensions by measuring the time required to disperse a small volume of dye. After selection of incubator type, incubation vessel, and buffer volume, the rate of drug uptake into the slice was studied as a function of shaking speed (revolutions per minute) by incubating brain slices for a shorter period of time (30 min). Thioridazine was chosen as the model compound for this purpose because its high Vu,brain is not reached at this time point, and the observed uptake would be potentially sensitive to alterations in shaking speed. The uptake clearance (CL) was defined as the diffusional clearance between the buffer and the brain slice. A time-dependent equation for the approach of Vu,brain to its steady-state value was established as a function of CL. By taking the converse relationship, CL was estimated from the measured Vu,brain at t = 30 min (eq. 21).
The influence of the amount of slice tissue per unit of buffer volume was investigated by simulations of the model presented below, as well as by experimentally comparing the time course of drug uptake in a single slice versus that in six slices in a constant buffer volume.
The linearity of Vu,brain, i.e., its level of independence from the concentration, was investigated by comparing values obtained with different initial drug concentrations in the buffer (0.01, 0.03, 0.1, 1, 10, and 100 μM). Paroxetine was chosen as model compound for this purpose because of its high analytical sensitivity and high Vu,brain. The occurrence of distributional interactions between different compounds was investigated by comparing Vu,brain values for the model compounds determined in cassette incubations with Vu,brain values determined in single-compound incubations.
The buffer composition was evaluated with the aim of finding a buffer system that was robust and capable of maintaining an incubation pH of 7.3, as checked with a pH electrode immediately after each incubation. The physiological pH of the brain ISF is 7.3 (Davson and Segal, 1996). Two buffer systems were evaluated: 1) 15 mM NaHCO3 and 10 mM HEPES supplied with 5% CO2 in oxygen and 2) 25 mM HEPES supplied with 100% oxygen. The HEPES buffer was prepared at room temperature and the pH was adjusted to 7.58. At the incubation temperature of 35°C the pH was initially 7.40, followed by a gradual decrease to the desired pH of 7.30 over the 5 h of incubation with six brain slices. Ascorbic acid has been reported to reduce swelling of brain slices (Brahma et al., 2000). Therefore, inclusion of 0.4 μM ascorbic acid with the 25 mM HEPES buffer was evaluated. The influx of water that occurs in incubated slices (swelling) was assessed by comparing the Vu,brain for tritiated water with the estimated brain water volume of 0.8 ml · g brain–1 (Reinoso et al., 1997). The damage to the sliced tissue from the slicing procedure was assessed by comparing the [14C]inulin Vu,brain with the in vivo volume of interstitial fluid, VbrainISF, of 0.2 ml · g brain–1 (Nicholson and Syková, 1998). The intracellular pH of the slice was measured at 5 h by the dimethyloxazolidinedione method (Waddell and Butler, 1959).
The amount of albumin present in brain slices and brain homogenate was determined using a radial immunoassay for rat albumin (Cardiotech Services Inc., Louisville, KY). The fraction unbound in the buffer is assumed to be 100% in the slice method. As confirmation, the unbound fraction was also determined experimentally by overnight equilibrium dialysis of a buffer sample that had previously been incubated with 6 slices for 5 h.
Final Protocol for Brain Slice Experiments. The following is a description of the final protocol that was developed during the course of this study. This protocol was used to obtain the data reported here for calculating Vu,brain unless otherwise specified. For comparison, experiments were also made with our previously published setup (Fridén et al., 2007).
Drug-naive animals were sacrificed under isoflurane anesthesia, and the brain was removed and immersed in ice-cold oxygenated buffer (129 mM NaCl, 10 mM glucose, 3 mM KCl, 1.4 mM CaCl2, 1.2 mM MgSO4, 0.4 mM K2HPO4, 25 mM HEPES, and 0.4 mM ascorbic acid). A 6-mm coronal section was cut with a razor and mounted with cyanoacrylate glue onto the tray of a DTK-Zero1 Microslicer (Dosaka, Kyoto, Japan). Six 300-μm coronal slices of striatal areas were cut using cutting speed 6 and frequency 7. The six slices were all transferred into one Ø80-mm flat-bottomed glass dish containing 15 ml of buffer plus model compounds 0.2 μM diazepam, 0.2 μM gabapentin, 0.5 μM indomethacin, 0.1 μM paroxetine, 0.1 μM rimonabant, and 0.2 μM thioridazine. The tray was briefly filled with 100% oxygen over the buffer, lightly covered with a glass lid, and placed in a humidified and continuously oxygenated box inside a Forma Orbital Shaker 420 (Thermo Fisher Scientific, Waltham, MA) set at 35°C with a rotation speed of 45 rpm. Although preincubation was not routine in this study, slices can be preincubated without drug for 5 min before the addition of concentrated drug solutions. The time required to anesthetize the animal, to prepare the slices, and to start the incubation was less than 20 min. At the prespecified time point, the slices were removed one by one from the dish, dried on filter paper, and weighed in a 2-ml Eppendorf tube (∼33 mg). The slices were individually homogenized in 9 volumes (w/v) of buffer with an ultrasonic probe (Sonifier 250; Branson Ultrasonics, Danbury, CT). The buffer was sampled directly from the dish by aspiration of 200 μl and was dispensed in an Eppendorf tube containing 200 μl of blank brain homogenate that had been prepared with 4 volumes of buffer. The purpose of this step was to wash the pipette tip for nonspecifically bound drug, as well as to match the matrix of the slice homogenates. The samples were stored at –20°C until analysis. Vu,brain was calculated according to eq. 2, where Aslice and Cbuffer are the amount of drug in the slice per gram and the concentration of drug in the buffer, respectively. Vi (milliliters per gram of slice) is the volume of buffer film that remains around the sampled slice because of incomplete absorption of buffer by the filter paper:  Vi was estimated using [14C]inulin in a separate experiment in which brain slices were incubated for 30 and 60 s (n = 9). The radioactivity was measured in brain slices (Aslice, Becquerels per gram of slice) and buffer (Cbuffer, Becquerels per milliliter of buffer). The ratio Aslice/Cbuffer (milliliters per gram of slice) was plotted against time (seconds), and linear regression analysis was used to calculate a zero-time y-intercept. Because at time 0 there has been no uptake of [14C]inulin into the slice tissue, the zero time extrapolated Aslice/Cbuffer ratio represents the volume of the buffer film that covers the sampled slice. Vi was found to be 0.094 ml · g slice–1 in agreement with original reports (Kakee et al., 1996). Compound recovery, i.e., mass balance, was calculated from a buffer sample taken before the start of the incubation.
Quantification of Sources of Variability inVu,brain. A series of three repeat experiments was performed on 3 days using the final protocol of the slice method to evaluate the reproducibility of the method and to quantify the importance of different sources of variability. The buffer and drug solutions were made fresh every day from stored stock solutions, and the pH was adjusted before the experiments. The three repeats were done within 5 days with rats of similar weight from a single delivery from the supplier. The Vu,brain of the compounds in the cassette was determined in six brain slices from each of three rats. Hence the total number of slices was 54 across the 3 days. The variability associated with drug analysis was addressed by repeating the entire analytical procedure, including sample preparation, for all samples on 2 different days.
Determination of Intracellular Binding,Vu,cell. Intracellular binding, as described by the volume of distribution of unbound drug in the cell (Vu,cell) was calculated from the unbound fraction in diluted brain homogenate (fu,hD) using (eq. 3)  where Acell and Cu,cell are the amount of drug associated with the cells and the intracellular unbound drug concentrations, respectively (Fridén et al., 2007). D and Vcell represent the dilution factor and the cell volume (0.8 ml · g brain–1), respectively. Equilibrium dialysis of brain homogenate was performed as described previously (Wan et al., 2007).
Calculation of the Partitioning Coefficient of Unbound Drug in the Cell,Kp,uu,cell. The ratio of intracellular to extracellular unbound drug concentration (Kp,uu,cell) was calculated using Vu,brain from the slice experiments and Vu,cell from the homogenate method (eq. 4):  The volume of the brain interstitial fluid (VbrainISF) was taken as 0.2 ml · g brain–1 (Nicholson and Syková, 1998).
Analytical Procedures. Brain homogenate samples were obtained from sampled and homogenized brain slices and from buffer samples mixed with blank brain homogenate as described above. The amount of drug in brain homogenates was quantified with reversed-phase liquid chromatography and multiple reaction monitoring mass spectrometry (liquid chromatography-tandem mass spectrometry) detection using a Micromass Quattro Ultima instrument (Waters, Manchester, UK), equipped with electrospray run-in positive mode. Gradient elution over 2 min used acetonitrile (initial 5% and final 95%) and 0.2% formic acid with a flow rate of 0.7 ml/min. For mass transitions and chromatographic conditions, see Supplemental Table 1.
Fifty microliters of brain homogenate was protein-precipitated in NUNC 96-deepwell plates (Nalge Nunc International, Rochester, NY) with 150 μlof ice-cold acetonitrile containing 0.2% formic acid. After 1 min of vortexing and 20 min of centrifuging at 4000 rpm and 4°C (Rotanta/TR; Hettich, Tuttlingen, Germany), the supernatant was transferred to a new 96-deepwell plate and diluted with 0.2% formic acid to reduce the acetonitrile concentration to 37.5%. Ten- and 100-fold dilutions of the samples were made in 37.5% acetonitrile in 0.2% formic acid. The additional dilution of protein-precipitated samples was to ensure that the responses used in the calculations were within the linear response range of the mass spectrometer. Five microliters of the three dilutions was injected into the HPLC system. There was complete peak separation. All compounds were quantified together from a single injection, except for rimonabant, which required separate analysis. The amount of drug in the slice (Aslice) and the buffer concentration (Cbuffer) were not quantified as absolute concentrations. Instead they were expressed in terms of mass spectrometer response (chromatographic peak areas). To minimize any effects of nonlinearity in response, the peak areas were chosen from the three different analyzed dilutions (1-, 10-, and 100-fold) such that the peaks for slice and buffer were of similar size for each compound. Thereafter, the peak areas were scaled back to undiluted buffer and brain slice by multiplying by the dilution factors 1, 10, and 100 as appropriate. Furthermore, the peak area for slice was multiplied by 10 to account for the dilution associated with the preparation of the homogenate. The peak area for buffer was multiplied by 2 to account for the dilution associated with the 1:1 mixing of buffer sample with blank brain homogenate. The dilutions associated with protein precipitation were not considered because dilution was the same for all samples. The resulting peak areas were used as Aslice and Cbuffer for the calculation of Vu,brain (eq. 2). There were no matrix effects on the response of these compounds; the response was similar in the sample matrix and mobile phase. For the strongly retarded rimonabant; however, it was necessary to perform liquid-liquid extraction before analysis.
Radioactive isotopes were quantified using a WinSpectral 1414 liquid scintillation counter (Wallac, Turku, Finland) and an OptiPhase HiSafe 3 scintillation cocktail (Fisher Chemicals, Loughborough, England). Brain slices were dissolved with 1 ml of Soluene-350 (PerkinElmer Life and Analytical Sciences) and bleached with 100 μl of hydrogen peroxide.
Modeling Brain Slice Uptake. A model-based approach was implemented to aid characterization and simulation of the possible mechanistic behavior and time course of drug uptake in brain slices. The central problem of modeling drug uptake in slices is to transpose the kinetics of a closed in vitro system into a mathematical form showing the concentration dependence of transfer rates. We defined the system as a closed two-compartment model, with compartments corresponding to well-stirred buffer and slice tissue. The underlying assumption is that the transfer kinetics between buffer and brain slices are slow with regard to dispersion kinetics within the buffer, which are improved by stirring. The clearance between the two phases is passive and symmetrical.
The variables of the system are time (t; minutes) as the independent variable, the unbound drug concentration in the brain slice compartment or brain slice ISF (Cu,brainISF; micromolar), the buffer concentration (Cbuffer; micromolar), the amount of compound in the brain slices (Abrain; micromoles per gram of brain), the amount of compound in the buffer (Abuffer; micromoles per gram of brain), and the amount of drug added to the system (Dose; micromoles per gram of brain), where the mass balance of the system is defined as Dose = Abrain + Abuffer; the diffusional uptake clearance (CL; milliliters per minute per gram of brain) and the steady-state unbound volume of distribution (Vuss,brain; milliliters per gram of brain), where Vuss,brain = Abrain/Cu,brainISF; the measured unbound brain volume of distribution (Vu,brain; milliliters per gram of brain), where Vu,brain = Abrain/Cbuffer; the volume of buffer normalized to the amount of brain slice tissue (Vbuffer; milliliters per gram of brain); and the amount of brain slice normalized to the buffer volume (Wbrain; gram of brain per milliliter of buffer). Wbrain and Vbuffer describe the same system property, namely, the proportions of brain tissue and buffer. Wbrain is the inverse of Vbuffer and vice versa.
The differential equations describing the system are as follows (eqs. 5 and 6): 
 The initial conditions are as follows (eqs. 7 and 8):
 The system admits the following solution (eqs. 9 and 10):
 with (eq. 11)
  At equilibrium, the system displays the concentrations as follows (eq. 12):
To characterize the transfer kinetics, the parameter T0.8 is introduced to represent the time to reach 80% of the equilibrium. Because 100% of the equilibrium is reached at infinity, 80% is considered sufficient in the drug discovery context. At t = T0.8, Cu,brainISF/Cbuffer = 0.8 (see eqs. 13 and 14): 

The first derivative of T0.8 as a function of Wbrain is computed to study the influence of the amount of brain tissue per buffer volume unit on the time to reach 80% of equilibrium (eqs. 15 and 16): 
 The sign of this derivative function follows the sign of g(Wbrain) (eqs. 17 and 18):
 g(Wbrain) is a decreasing function of Wbrain and has a negative upper bound g(0) =–ln5 +0.8. g(Wbrain) is therefore a negative function for any Wbrain. It can be concluded that the first derivative dT0.8/dWbrain is a negative function. Consequently, the time to reach equilibrium (T0.8) will decrease when Wbrain or the number of slices increase.
A time-dependent relationship for Vu,brain is obtained from the explicit solution of the model (eq. 19)  using eqs. 5 and 6:
Uptake clearance (CL) was calculated from an experimental estimate of Vu,brain at 30 min by transposing the relationship (eq. 20) to its converse and allocating the 30-min value to Vu,brain (eq. 21).  The same relationship can be applied at any experimental time.
Data Presentation and Statistical Analysis.Vu,brain values were analyzed on the log scale as they are essentially ratios and variability increased with mean level. Means quoted in Table 2 are therefore geometric means, antilogs of means calculated on log data.
Estimates of Vu,brain and variance components (expressed as percentage of total variability) for model compounds
Analysis was repeated for the cassette experiment with six slices from each of three rats on 3 days (n = 54 slices). Mean values of compound recovery are given with the S.D. calculated on the linear scale
The sources of variability derived from the series of three repeat experiments were as follows: “Days” = changes in the overall averages of Vu,brain across days; “Rats” = changes in the overall averages of Vu,brain for the rats, pooled across the days, fitted as rats within day variability; “Slices” = changes in the overall averages of Vu,brain in the slices, pooled across rats and days, fitted as slices within rats and days; and “Analytical” = changes in the two analytical replicates for each slice, pooled across slices, rats and days.
In the analysis in which all compounds (except gabapentin) were included together, the following sources of variability were also assessed: “Compound × Days” = changes in the differences between the compounds across the days (this is a measure of the consistency (reproducibility) of compound effects across days); “Compound × Rats” = changes in the differences between the compounds across the rats, pooled across the days, fitted as the compound by rat interaction within days; [this is a measure of the consistency (reproducibility) of compound effects across rats]; and “Compound × Slice” = changes in the differences between the compounds across the slices for a rat, pooled across the rats and days, fitted as the compound by slice interaction within rats and days (this is a measure of the consistency (reproducibility) of compound effects across slices).
The sources of variability (variance components) were assessed using mixed modeling (SAS PROC MIXED, 1999; SAS Institute, Cary, NC). The confidence interval ratio (CIR) was used to present the magnitude of the variability of Vu,brain. This is a way of applying confidence intervals from log scale analyses back onto the original data scale. The upper boundary of the approximate 95% confidence interval is obtained by multiplying the mean by the CIR, whereas the lower boundary is obtained by dividing the mean by the CIR. A t value of 2, rather than an approximate t statistic value based on Satterthwaite's approximation, was used to define the limits.
The variance components determined from the series of three repeat experiments were used to generate the CIR for Vu,brain using different design scenarios. This calculation was done to evaluate the benefits in terms of the improved precision of the Vu,brain estimate from performing the experiment on more than 1 day or in slices from more than a single rat.
Results
This section presents the sequence of steps taken to optimize the brain slice method with regard to experimental simplicity, throughput, and time to reach equilibrium.
Dimensions of Incubation Vessel and Buffer Convection (Stirring). The dimensions of the incubation vessel and buffer volume were more important for efficient mixing than the speed (revolution per minute) of reciprocal or rotational shaking. Efficient convection was favored by a large dish diameter with a proportionally small buffer volume. It was difficult to produce significant buffer convection in small vessels such as the 20-ml scintillation vials of the previous setup. In fact, bubbling gas through the mixture was more efficient than any kind of shaking when the previous setup was used. A rotationally shaken flat-bottomed Ø80-mm crystallization dish with a 15-ml buffer volume seemed optimal and was further investigated with regard to the shaking speed (Fig. 1). The lowest stirring rate investigated (45 rpm) produced very gentle stirring and increased the uptake clearance of thioridazine 7-fold compared with that for the unstirred situation. The highest speed investigated (90 rpm) produced an unacceptably violent journey for the slices. Thus, 45 rpm (or lower) was considered an appropriate stirring rate under these conditions.
Time to Reach Equilibrium: The Influence of Amount of Tissue Per Unit of Buffer Volume. Experiments with our previous setup showed that it was not possible to reach equilibrium for paroxetine, thioridazine, and rimonabant, the most extensively binding drugs. Figure 2 shows the simulated time profiles of thioridazine Vu,brain for incubations of one, two, or six slices in the same dish. The profile was not monoexponential as might have been expected but showed a sigmoid slope toward the equilibrium Vu,brain. This means that the equilibrium will be reached sooner if the buffer concentration is allowed to decrease simultaneously with the increase in slice concentration; the more slices in the incubation, the faster the decrease in buffer concentration. The experimental time course of the incubations of one and six slices using the cassette of compounds confirmed the simulated behavior (Fig. 3). The data for the three drugs with high Vu,brain (thioridazine, paroxetine, and rimonabant) clearly deviate from the monoexponential increase in Vu,brain that is seen for the other drugs. It is also clear that the time for thioridazine and paroxetine to reach equilibrium is shorter when six slices are incubated in the same vessel than when a single slice is incubated.
Evaluation of Buffer Composition. Keeping the pH at its physiological value of 7.30 is the single most important property of the buffer for accurate and precise determination of Vu,brain. The previously used bicarbonate buffer system required a 5% CO2 atmosphere to maintain the pH. Any drop in the CO2 pressure by, for example, repeatedly opening the incubator to transfer slices can cause an alkaline shift of more than 1 pH unit. The oxygenated 25 mM HEPES buffer was a more practical and robust solution. It allowed maintenance of the pH during the incubation period with only a small decrease from 7.40 to 7.30 over 5 h. The inclusion of 0.4 μM ascorbic acid in the HEPES buffer significantly improved the stability of the slices.

The effect of rotational speed on the uptake clearance of thioridazine as estimated from Vu,brain at 30 min using eq. 21. Error bars represent standard deviations for three slices.

Simulation of the Vu,brain of drug in brain slices using eq. 3. The solid, dashed, and dotted lines represent the situation when six slices, two slices, and one slice were incubated in 15 ml of buffer. The equilibrium is reached faster with larger amounts of brain tissue per unit volume.
Properties of the Brain Slices. The amended brain slice method was characterized with regard to tissue damage, swelling, and intracellular pH and was compared with our previously published method. The [14C]inulin Vu,brain value in both setups was 0.42 ± 0.03 ml · g brain–1. A slightly higher [14C]inulin Vu,brain value (0.48 ± 0.02 ml · g brain–1) was observed if the 5-min preincubation period was omitted. The Vu,brain values for tritiated water were 0.84 ± 0.01 and 0.81 ± 0.02 ml · g brain–1 using the previous and amended setups, respectively. The intracellular slice pH values were 7.06 ± 0.01 and 7.02 ± 0.02 at final buffer pH values of 7.27 and 7.30 for the previous and amended methods, respectively. There were no detectable levels of albumin from residual blood in the homogenate of the brain slices. As derived from the detection limit of the albumin assay, the amount of remaining plasma would be the maximum 0.1% of the slice weight. A fraction unbound close to the assumed 100% in the incubation buffer was experimentally confirmed for diazepam (99 ± 3%), gabapentin (93 ± 6%), indomethacin (100 ± 3%), paroxetine (87 ± 2%), and thioridazine (79 ± 4%). It was not possible to determine the fraction unbound in buffer for rimonabant because of adsorption to some component of the equilibrium dialysis apparatus. Hence, the slice buffer concentration was considered to be 100% unbound for all compounds throughout this study.
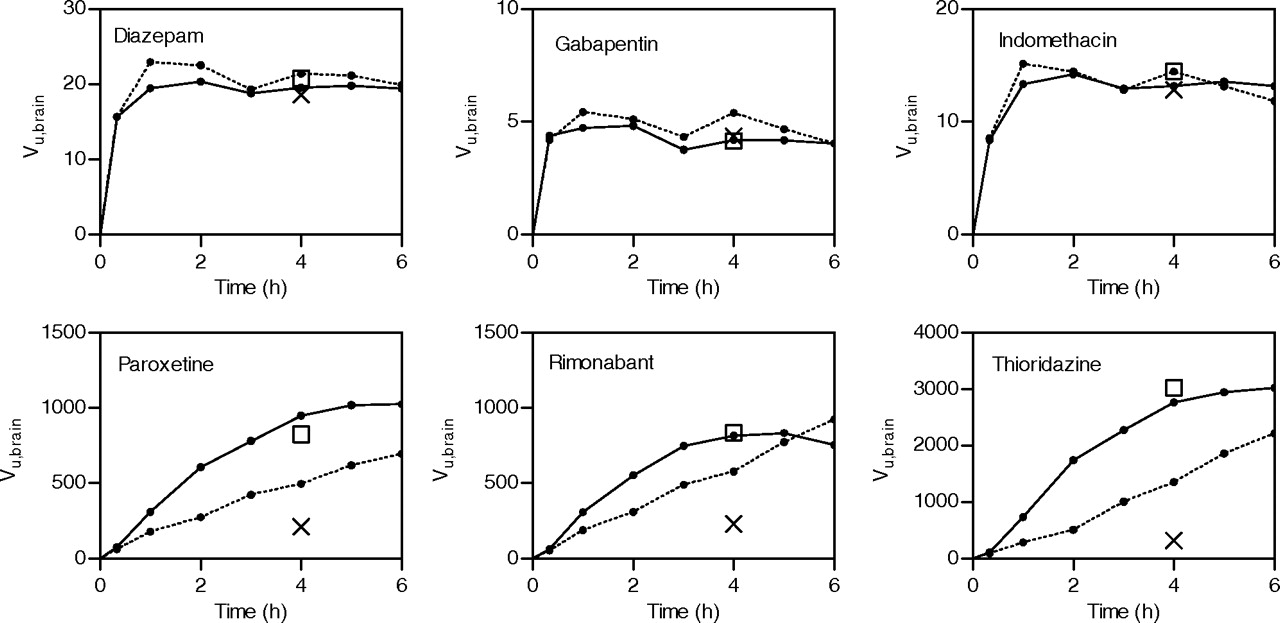
Brain slice uptake experiments with the cassette of six model compounds. Samples were taken at 0.33, 1, 2, 3, 4, 5, and 6 h. The solid and dotted lines represent incubations with six slices and one slice per incubation dish, respectively. □, Vu,brain in incubations with single compounds. ×, Vu,brain as determined by our previously published method (Fridén et al., 2007).
Linearity ofVu,brain and Validity of Cassette Experiments.Figure 4 shows that the Vu,brain of paroxetine was linear up to a starting buffer concentration of 1 μM, resulting in a final buffer concentration on the order of 0.1 μM and an amount in the slice of 75 μmol · g brain–1. At higher concentrations, the partitioning was reduced. The Vu,brain values of the model drugs determined in cassette experiments were compared with those determined in single compound incubations (included as open squares in Fig. 3). The observed differences were less than 15%.
Reproducibility and Variability inVu,brain. The mean Vu,brain of each compound was calculated from the 5-h incubations done on 3 days, using six slices each from three rats. The sources of variability were first estimated for the different compounds separately. Except for gabapentin, which had wider variabilities per day and rat, the greatest sources of variability were the slices and the analytical variability (Table 2). In a second step, all the sources of variability were estimated from the combined data of all compounds except gabapentin (Table 3). The main sources of variability were those due to slices and analytical variability. There was little or no variability in the overall Vu,brain for the different days and rats, whereas there was some compound-specific day and rat variability (compound × day and compound × rat) (Table 3). In general, the expected variability for a compound studied in six slices from one rat on a single day and analyzed once would result in a CIR of 1.07. This is contrasted with other design scenarios of 12 or 18 slices in Table 4 by assessing the likely 95% confidence interval (expressed as a ratio figure, the CIR).
Variance components after combining values from all compounds except gabapentin
Confidence intervals for varying the number of slices added per experiment
Multiples of six slices are considered, because the amended setup of the slice method requires six slices in each incubation

Brain slice experiments with varying buffer concentrations of paroxetine. The paroxetine Vu,brain value was linear up to a starting buffer concentration of 1 μM.
Intracellular Exposure,Kp,uu,cell. The Vu,brain is a gross reflection of the intracellular protein binding or membrane partitioning but also reflects the concentration gradient of unbound drug across the cell membranes (Kp,uu,cell). For the neutral compounds diazepam and rimonabant, this was close to unity. In contrast to the basic paroxetine and thioridazine, with Kp,uu,cell values of 2.3 and 3.3, respectively, the acidic indomethacin had a value of 0.54. Gabapentin had the highest Kp,uu,cell of 4.7 (Fig. 5).
Discussion
In this article, we describe the development of a brain slice method capable of measuring the tissue distribution of hydrophilic through to very lipophilic compounds in a high-throughput manner. The method measures the partitioning of drug between buffer and brain slice to yield the unbound brain volume of distribution (Vu,brain). The unbound drug concentration in the brain interstitial fluid, the most relevant measure of central drug exposure, can then be calculated from the measured total amount of drug in brain tissue using Vu,brain as a conversion factor. We also describe the combined use of brain slice and brain homogenate studies to obtain the intracellular to extracellular partitioning of unbound drug in the brain tissue.
Vu,brain can only be determined when the concentrations of drug in the slice and the buffer are in equilibrium because, at that point, the buffer concentration is equal to the concentration of unbound drug in the slice interstitial fluid. Efficient, gentle stirring was produced in a relatively large dish in a slowly rotated orbital shaker. There were significant improvements made by increasing stirring efficiency; however, it was also necessary to increase the amount of tissue per unit of buffer volume to reduce the time required to reach equilibrium to 5 h for drugs with a high potential for binding to brain tissue. Because Vu,brain is the slice/buffer ratio, equilibrium is reached faster when the increase in the amount of drug in the slice is paralleled by a decline in buffer concentration. The inverse relationship between equilibration time and amount of tissue per unit of buffer volume was also shown mathematically with the closed two-compartment model (Fig. 2).
There are currently no straightforward or standard methods of assessing the viability of brain slices in terms of percentage of viable cells. However, the in vivo characteristics of the slices are qualitatively preserved. There was little gain of water, as measured by the Vu,brain of tritiated water (0.81 ml · g brain–1), which is close to the brain water volume in vivo (0.8 ml · g brain–1) (Reinoso et al., 1997). The pH values of rat brain intra- and extracellular space in vivo were approximately 7.0 and 7.3, respectively (Davson and Segal, 1996). The intracellular pH of the slice in this study was 7.02 at a buffer pH of 7.30. The Vu,brain of [14C]inulin, a measure of the extracellular space, gave an indication of the damage to the slice tissue occurring during the slicing or incubation procedures. The [14C]inulin Vu,brain (0.42 ml · g brain–1) was higher than the in vivo value of 0.20 ml · g brain–1 (Nicholson and Syková, 1998). The Vu,brain for [14C]inulin was slightly higher when the slices were not preincubated for 5 min, which may be interpreted as resealing of membranes during incubation. It may be advisable to preincubate slices if the drug molecules studied are potentially restricted to the extracellular space. Because most drug-like molecules eventually equilibrate with the intracellular spaces, preincubation was not otherwise performed in this study.

Kp,uu,cell of the model compounds, representing the ratio of concentrations of unbound drug in the intracellular and interstitial brain fluids (Cu,cell/Cu,brainISF). The dashed line represents unity Kp,uu,cell and equal intra- and extracellular drug concentrations. Basic compounds (gray bars) generally had higher ratios than neutral compounds (open bars) and acidic indomethacin (black bar). The zwitterionic gabapentin (striped bar) had the highest Kp,uu,cell because of active uptake into brain parenchymal cells.
In pharmacokinetics, it is assumed that tissue distribution is linear, i.e., the extent of partitioning is independent of concentration. This is also a fundamental assumption when the slice method is used to calculate Cu,brainISF from measured total amounts in brain. Tissue partitioning is determined mainly by nonspecific membrane partitioning (Wan et al., 2007) and should not be saturable even at high concentrations. Given the importance of this assumption, an investigation of the linearity of Vu,brain was merited. The Vu,brain of paroxetine was linear up to an initial buffer concentration of 1 μM, above which partitioning was reduced (Fig. 4). This finding should be no surprise, because unbound drug concentrations in the micromolar range in vivo would be unrealistic for such a lipophilic and potent drug and the resulting millimolar tissue concentrations. Whatever the mechanism or nature of the observed nonlinearity, it is strongly suggested that the starting buffer concentration should be submicromolar. A starting concentration of 0.1 μM seems appropriate for most compounds. The buffer concentration of lipophilic compounds with a high Vu,brain value will fall to a few nanomoles per liter before equilibrium is reached, making analytical sensitivity the lower boundary for the concentrations chosen.
One of the requirements for the implementation of a new method in drug discovery is a sufficiently high throughput and an acceptable level of simplicity of the experiment. The approach used in this study to increase throughput was to include several drugs in the same incubation, i.e., compound pooling or cassette dosing. The Vu,brain values for the model compounds studied in a cassette were similar to (differences <15%) those studied as single compounds (Fig. 3). As long as the compounds in the cassette can be analyzed without interference in the HPLC-tandem mass spectrometry system, it is considered safe to use cassettes containing 10 compounds at a starting buffer concentration for each compound of 0.1 μM. While keeping buffer concentrations to a minimum, the risk of interaction with transporters may be further minimized by preferentially pooling drug compounds from different chemical classes rather than having too many closely related compounds in the same incubation.
The amended method was remarkably precise, with only small variations, as indicated by the low CIRs (Table 4). Analysis of variance components in the cassette experiments revealed that the main sources of variability were associated with the slices and the analysis. The slice and compound × slice variability implies that the Vu,brain of the compounds will vary with the slice, so there will be benefits in using several slices and taking an average. The minimum values for these parameters using the optimized setup, i.e., six slices from a single rat on a single day, typically results in a 95% confidence interval within 7.0% of the Vu,brain estimate (CIR = 1.070).
Rank-ordering of compounds with regard to Vu,brain is of limited value because the Vu,brain does not affect the unbound drug concentrations in the brain nor the unbound brain/plasma concentration ratio at steady state (i.e., during long-term administration) (Hammarlund-Udenaes et al., 2008). Therefore, in a drug discovery situation, it is not possible to increase the unbound drug concentration by reducing the extent of binding. There are no good or optimal values for Vu,brain and it would, accordingly, be rational to determine Vu,brain only for those compounds that have available in vivo data for the amount of drug in brain, i.e., the total brain concentration. The brain slice method is typically run with 10 to 20 compounds on a monthly basis with 1 day for the experiment and 1 to 2 days for sample analysis, depending on the number of compounds and cassettes. The full capacity is not used because the demand is set by the number of compounds tested in vivo during the time between occasions.
The modifications made to the slice method were intended to make the method more simple and robust (Fridén et al., 2007). Apart from reaching equilibrium in a short enough time (5 h), the pH seemed to be the most likely factor to account for varying results during method development. The HEPES buffer was consequently used, because it does not require a steady 5% CO2 atmosphere to maintain the desired pH. Incubation in standard glass dishes is simple and avoids the use of adsorptive plastics. The analytical procedures in this study do not rely on tedious calibration curves; instead, the mass spectrometer response is compared for different dilutions of the samples. The matching of matrix in the buffer and slice samples has the advantage of reducing any effects of the matrix on the response in the mass spectrometer. However, the main advantage of mixing buffer and homogenate is that it circumvents handling protein-free aqueous samples of lipophilic and sparingly soluble compounds.
The ratio of unbound drug concentration in the slice intracellular fluid and buffer concentration (Kp,uu,cell) was calculated for the model compounds using information on intracellular partitioning (Vu,cell) from the brain homogenate binding method. As would be expected from the difference of 0.3 pH unit and in accordance with previous reports (Fridén et al., 2007), Kp,uu,cell was mainly related to the ion class of the drug molecule. Kp,uu,cell was higher for the basic compounds than for the neutral or acidic compounds (Fig. 5). Uptake or efflux transporters at the cell membrane of the brain cells could also influence Kp,uu,cell, as is the case for gabapentin (Su et al., 1995).
In conclusion, the good agreement between the in vivo unbound brain volume of distribution and that estimated in the brain slice method from our earlier publication prompted us to refine and simplify the experimental procedures for high-throughput purposes in drug discovery. The challenge of handling lipophilic compounds with extremely high Vu,brain values was managed by optimizing buffer composition and convection and increasing the amount of tissue per unit of buffer volume. These findings are also generally relevant to in vitro studies of lipophilic compounds. The amendments made to the brain slice method represent a critical advancement for the implementation of relevant CNS exposure measurements in support of pharmacokinetic-pharmacodynamic relationship studies in drug discovery.
Footnotes
-
This work was supported by AstraZeneca R&D Mölndal.
-
Article, publication date, and citation information can be found at http://dmd.aspetjournals.org.
-
doi:10.1124/dmd.108.026377.
-
ABBREVIATIONS: CNS, central nervous system; ISF, interstitial fluid; HPLC, high-performance liquid chromatography; CIR, confidence interval ratio.
-
↵
 The online version of this article (available at http://dmd.aspetjournals.org) contains supplemental material.
 - Received December 22, 2008.
- Accepted March 16, 2009.

- The American Society for Pharmacology and Experimental Therapeutics


