


Abstract
A specific substrate to Mu class glutathione S-transferase (GST), 1,2-dichloro-4-nitrobenzene (DCNB), was administered to mice with a disrupted GST Mu 1 gene (Gstm1-null mice) to investigate the in vivo role of murine Gstm1 in toxicological responses to DCNB. A single oral administration of DCNB at doses of 500 and 1000 mg/kg demonstrated a marked increase in blood methemoglobin (MetHB) in Gstm1-null mice but not in wild-type mice. Therefore, Gstm1-null mice were considered to be more predisposed to methemoglobinemia induced by a single dosing of DCNB. In contrast, 14-day repeated-dose studies of DCNB at doses up to 600 mg/kg demonstrated a marked increase in blood MetHB in both wild-type and Gstm1-null mice. However, marked increases in the blood reticulocyte count, relative spleen weight, and extramedullary hematopoiesis in the spleen were observed in Gstm1-null mice compared with wild-type mice. In addition, microarray and quantitative reverse transcription-polymerase chain reaction analyses in the spleen showed exclusive up-regulation of hematopoiesis-related genes in Gstm1-null mice. These changes were considered to be adaptive responses to methemoglobinemia and attenuated the higher predisposition to methemoglobinemia observed in Gstm1-null mice in the single-dose study. In toxicokinetics monitoring, DCNB concentrations in plasma and blood cells were higher in Gstm1-null mice than those in wild-type mice, resulting from the Gstm1 disruption. In conclusion, it is suggested that the higher exposure to DCNB due to Gstm1 disruption was reflected in methemoglobinemia in the single-dose study and in adaptive responses in the 14-day repeated-dose study.
Introduction
Glutathione S-transferases (GSTs) are major phase II conjugation enzymes that catalyze the conjugation of electrophilic compounds to GSH. Electrophilic compounds, which are produced in the metabolic process of several chemicals, such as acetaminophen (Larson, 2007), bromobenzene (Lau et al., 1980), and aflatoxin B1 (Guengerich et al., 1998), covalently bind to cellular macromolecules and induce severe toxicity. Accordingly, GSTs are generally recognized as important enzymes that detoxify electrophilic compounds produced by environmental carcinogens/toxicants, pesticides, and drugs (Eaton and Bammler, 1999).
However, the contribution of each GST isoform to xenobiotic-induced toxicity has not been well elucidated. Various isoforms of GST have been identified and classified into three families in terms of cellular localization, namely, cytosolic, mitochondrial, and microsomal GSTs. Cytosolic GSTs comprise the largest family and are further classified into seven classes (Alpha, Mu, Pi, Theta, Sigma, Zeta, and Omega) (Hayes et al., 2005). Furthermore, each class of GSTs is composed of several isoforms in both experimental animals and humans. When normal animal models are used, it is difficult to reveal the contribution of the isoforms that are responsible for metabolism and toxicity, especially in vivo (Gonzalez, 2003). Among the seven isoforms (GSTM1–GSTM7) of Mu class GST, GSTM1 is highly expressed in the liver and is considered to be a crucial GST isoform in mice, rats, and humans (Mannervik et al., 1985; Mitchell et al., 1997; Eaton and Bammler, 1999), and species differences in substrate specificity have been reported (Hansson et al., 1999).
In general, drug metabolism is widely recognized as an important factor that determines the incidence of toxicity by xenobiotics. In the last decade, genetically modified animals have been produced and used to examine the role of drug-metabolizing enzymes in vivo. In phase I enzymes, Cyp1a1, Cyp1a2, Cyp1b1, and Cyp2e1 knockout (null) mice were produced, and many studies were performed to examine in vivo metabolism, toxicity, and carcinogenesis (Gonzalez and Kimura, 2003). In addition, knockout mice of the Cyp3a family were recently produced and applied to the generation of CYP3A4 humanized mice to predict in vivo human metabolism (van Herwaarden et al., 2007). In phase II enzymes, toxicological approaches using knockout mice are very limited, although six lines of knockout mice for cytosolic GSTs have been established so far. Gstp1/p2 (Henderson et al., 1998), Gsta4 (Engle et al., 2004), Gstm1 (Fujimoto et al., 2006), Gstt1 (Fujimoto et al., 2007), Gstz1 (Fernández-Cañón et al., 2002; Lim et al., 2004), and Gsto1 (Chowdhury et al., 2006) knockout mice have already been established, and their phenotypes have been characterized. A few studies, such as acetaminophen administration to GSTp1/p2 knockout mice (Elsby et al., 2003), paraquat administration to Gsta4 knockout mice (Engle et al., 2004), and carbon tetrachloride administration to Gsta4 knockout mice (Dwivedi et al., 2006), have been performed to investigate toxicological responses to xenobiotics using knockout mice for GSTs. Although the compounds in these investigations, such as acetaminophen, paraquat, and carbon tetrachloride, were typical toxicants and provided significant information, they were not necessarily specific substrates for GST isoforms that were disrupted in each study. Accordingly, in vivo administration of specific substrates for disrupted GST isoforms would also be a useful approach to investigate the relationship between the drug metabolism mediated by GSTs and the subsequent incidence of toxicity.
Based on these backgrounds, we generated mice with a disrupted Gstm1 gene (Gstm1-null mice) by gene targeting and characterized its phenotypes by in vitro and in vivo metabolic studies using 1,2-dichloro-4-nitrobenzene (DCNB) (Fujimoto et al., 2006). As notable phenotypes, Gstm1-null mice showed markedly low GST activity to DCNB in the in vitro studies using cytosol prepared from the liver and kidney. In addition, in vivo administration of DCNB showed a high plasma concentration of DCNB in Gstm1-null mice compared with that in the wild-type control mice. From these results, DCNB was considered to be a specific substrate for murine GSTM1, and the in vivo administration of DCNB to Gstm1-null mice would provide useful information on the use of genetically modified animals. In practice, we are curious as to whether higher exposure to DCNB in Gstm1-null mice causes severe toxicity. DCNB is a basic chemical for the synthesis of intermediates, which are further processed to herbicides, bactericides, and dyestuffs. In addition, it has been registered in the Hazardous Substances Data Bank (http://toxnet.nlm.nih.gov/cgi-bin/sis/htmlgen?HSDB), which is a database of potentially hazardous chemicals. In addition, the biological threshold limit value in human urine has been established for nitro and amino aromatics, including DCNB because it has been reported to have a potential risk of methemoglobinemia (Linch, 1974). p-Nitrochlorobenzene and nitrobenzene, chemical analogs of DCNB, have been reported to cause methemoglobinemia in experimental animals and humans (Watanabe et al., 1976; Schimelman et al., 1978). In this study, we investigated in vivo toxicological responses to DCNB in Gstm1-null mice and focused on methemoglobinemia and its related changes.
Materials and Methods
Generation and Maintenance of Gstm1-Null Mice.
Gstm1-null mice were generated by homologous recombination in embryonic stem cells as described previously (Fujimoto et al., 2006). Wild-type and Gstm1-null mice were maintained in a C57BL/6J and 129S1 mixed background.
Animal Care.
All mice described in these studies were kept in a controlled environment at a room temperature of 23 ± 2°C and humidity of 55 ± 10% with an illumination period of 12 h (7:00 AM to 7:00 PM) per day. Each mouse was housed individually in a bracket cage and fed ad libitum with solid feed (Certified Rodent Diet 5002; PMI Nutrition International, Inc., Tokyo, Japan) sterilized by radiation (irradiated with a 60Co-γ ray of 30 kGy), and tap water was supplied by an automatic watering system. The studies were approved by the Ethics Review Committee for Animal Experimentation of Sankyo Co., Ltd., and were conducted in compliance with the “Law Concerning the Protection and Control of Animals” (Japanese Law 105, October 1, 1973; revised on June 22, 2005).
Study Designs.
Wild-type and Gstm1-null mice (males and females) at 14 to 16 weeks of age were orally administered DCNB (Wako Pure Chemical Industries, Ltd., Osaka, Japan), which was suspended in 0.5% methylcellulose solution. The dose levels of DCNB were 0, 500, and 1000 mg/kg in the single-dose study and 0, 150, 300, and 600 mg/kg in the 14-day repeated-dose study. An additional 14-day repeated-dose study was conducted to perform a pathological examination. The dose levels for this pathological study were set at 0, 150 (only females), and 300 mg/kg to avoid mortality. The first day of administration was defined as day 1, and autopsies were performed 24 h after the last dosing in each study.
Study Designs of Toxicokinetics Monitoring and Gene Expression Analysis.
The wild-type and Gstm1-null mice in the satellite groups of the 14-day repeated-dose study were orally treated with DCNB for 14 days at dose levels of 0 and 300 mg/kg. Blood was sampled 2 h after dosing on days 1 and 14, based on the previous information in which maximal concentrations of plasma DCNB were exhibited approximately 2 h after the DCNB treatment (Fujimoto et al., 2006). Then, the blood samples were centrifuged at 10,000 rpm for 5 min at 4°C to obtain samples of the plasma and blood cells. The TK samples were stored in a freezer set at −80°C. The spleens of female mice were also stored in a freezer set at −80°C and used for microarray and quantitative RT-PCR analyses.
Hematological Examination.
On the day of autopsy, the animals were anesthetized with ether, and blood samples were collected from the inferior vena cava. These samples were placed in blood sampling tubes (Microtainer; Nippon Becton Dickinson Company, Ltd., Tokyo, Japan) coated with EDTA-2K. The samples for analysis, along with an automated blood cell counter, were mixed with equal volumes of physiological saline (Otsuka Pharmaceutical Industries, Tokyo, Japan). The red blood cell count (RBC) and reticulocyte count (RET) were determined using an ADVIA120 automated blood cell counter (Bayer Medical Ltd., Tokyo, Japan). Blood methemoglobin (MetHB) was determined by the spectrophotometric method with a 7011 clinical spectrophotometer (Hitachi, Ltd., Tokyo, Japan).
Pathological Examination.
Macroscopic observations of organs and tissues were performed in each study during the autopsy. For the microscopic examinations, the organs and tissues were removed and then fixed in 10% neutral buffered formalin, embedded in paraffin, sectioned at a thickness of 2 to 3 μm and stained with hematoxylin and eosin. The grading score of increased extramedullary hematopoiesis in the spleen was determined based on the area percentage of the hematopoietic cells within spleen sections. The criteria for the grading score were defined as follows. No change (<10% increase) in area percentage of hematopoietic cells within spleen sections compared with the control was defined as grade 0. A slight increase (10–40% increase), moderate increase (41–60% increase), and marked increase (>60% increase) were defined as grade 1, grade 2, and grade 3, respectively.
Microarray Analysis.
Microarray analysis was performed according to the Affymetrix standard protocol. In brief, total RNA was isolated from an individual female mouse spleen, and the pooled RNA samples were prepared for both wild-type and Gstm1-null mice by mixing an equal amount of RNA samples within the groups. Five micrograms of the pooled RNA was used for cDNA synthesis using a T7-(dT)24 primer (GE Healthcare, Little Chalfont, Buckinghamshire, UK). A biotin-labeled cRNA mix was transcribed using a BioArray High Yield RNA transcript labeling kit (Enzo Diagnostics, Farmingdale, NY). Every biotin-labeled cRNA target sample (approximately 15 μg) was fragmented and hybridized to a Mouse 430 2.0 GeneChip array (Affymetrix, Santa Clara, CA) at 45°C for 18 h, followed by washing and staining with streptavidin-phycoerythrin using a Fluidics Station 400 (Affymetrix). Microarray image data were analyzed with the Comparison Analysis algorithm (Affymetrix).
Microarray Data Analysis.
Probe sets whose Change Call showed “NC” (Not Changed) and/or whose |Signal Log Ratio| values were lower than 0.6 were excluded from the analysis. In addition, probe sets whose sequences are not annotated with an Entrez Gene identification number were excluded from the data analysis as well. In the present study, we hypothesized that Gstm1-null mice-specific gene expression regulation might be associated with the marked increase in extramedullary hematopoiesis in the spleens of Gstm1-null mice. Accordingly, genes whose expression levels increased in the Gstm1-null mice (|expression ratio to control| >1.4) but not in the wild-type mice (|expression ratio to control| <1.4) after DCNB treatment were extracted in Table 3. Genes whose increasing ratio between Gstm1-null and wild-type mice (Gstm1-null/wild-type) exhibited values greater than 2.5 are listed in the table.
Quantitative RT-PCR.
Expression levels of mouse matrix metallopeptidase 9 (Mmp9), chitinase 3-like 1 (Chi3l3), triggering receptor expressed on myeloid cells 3 (Trem3), membrane-spanning 4-domains, subfamily A, member 3 (Ms4a3), lipocalin 2 (Lcn2), and glyceraldehyde-3-phosphate dehydrogenase (Gapdh) genes were measured by quantitative RT-PCR. For each sample, 1 μg of total RNA was reverse-transcribed by SuperScript II using an anchored oligo(dT) primer as described by the manufacturer (Invitrogen, Carlsbad, CA). The resultant cDNA (1.0 μl) was used as the template in a 30-μl PCR reaction containing 0.1 μM concentrations each of forward and reverse gene-specific primers designed using Primer3 (Rozen and Skaletsky, 2000), 3 mM MgCl2, 1.0 mM dNTPs, 0.025 IU of AmpliTaq Gold, and 1× SYBR Green PCR buffer (Applied Biosystems, Foster City, CA). PCR amplification was conducted in MicroAmp Optical 96-well reaction plates (Applied Biosystems) on an Applied Biosystems Prism 7000 Sequence Detection System using the following conditions: initial denaturation and enzyme activation for 10 min at 95°C, followed by 40 cycles of 95°C for 15 s and 60°C for 1 min. A dissociation protocol was performed to assess the specificity of the primers and the uniformity of the PCR-generated products. Each plate contained duplicate standards of purified PCR products of known template concentrations covering 8 orders of magnitude to interpolate relative template concentrations of the samples from the standard curves of log copy number versus the threshold cycle. The copy number of each unknown sample per gene was standardized to that of the Gapdh gene to control for differences in RNA loading, quality, and cDNA synthesis. Primer sequences and amplicon sizes are shown in Table 1.
Primers for quantitative RT-PCR
TK Analysis for DCNB and Its Metabolite, M0.
Fifty microliters of blood cells were hemolyzed with 200 μl of distilled water and the hemolysate obtained was used for the TK analysis. Fifty microliters of each plasma or hemolysate sample was mixed with 150 μl of ethanol and centrifuged at 3000 rpm for 5 min at 4°C. To determine the concentration of DCNB, the supernatant was subjected to a high-performance liquid chromatography system (Shimadzu Corporation, Kyoto, Japan) consisting of a system controller (SCL-10A), a pump (LC-10AD), an autosampler (SIL-10AXL), a column oven (CTO-10AC), and a UV detector (SPD-10A). The HPLC conditions for this analysis were as follows: the column was an L-column ODS (150 × 4.6 mm i.d.; Chemicals Evaluation and Research Institute, Tokyo, Japan); the column temperature was 40°C; the mobile phase was water-acetonitrile-1 M ammonium acetate (55:45:1, v/v/v); the flow rate was 1.0 ml/min; the injection volume was 10 μl; and the UV detector wavelength was 270 nm.
Statistical Analyses.
The results are expressed as the mean ± S.D. The values of the mean and S.D. in each group were calculated with calculation software (Microsoft Office Excel 2003; Microsoft, Redmond, WA). A parametric Dunnett's test (for comparison among three groups or more) or an F-t test (for comparison between two groups) was performed to analyze the statistical differences in the mean values. The statistical analysis was performed with statistical software (SAS version 6.1.2; SAS Institute Inc., Cary, NC). A 5% level of probability was considered to be statistically significant. For the F-t test, the homogeneity of variance was estimated by an F test and significant differences in the mean values were evaluated by a Student's t test (for homogeneous data) or an Aspin-Welch t test (for heterogeneous data). The mean values that consisted of one or two data points were excluded from the statistical analysis.
Results
Single-Dose Study of DCNB.
The toxicological responses to DCNB in wild-type and Gstm1-null mice were examined in the single-dose study. In the hematological examination, a marked increase in MetHB was observed in Gstm1-null mice, which was similar in both sexes (Fig. 1). Although a statistically significant increase in MetHB was observed in the wild-type females given 1000 mg/kg, the magnitude of the increase was slight compared with that in Gstm1-null mice.

Blood concentrations of MetHB in the single-dose study of DCNB. Blood concentrations of MetHB were measured 24 h after a single-dose oral administration of DCNB to wild-type control or Gstm1-null mice. Open, light gray, and dark gray bars indicate dose levels of 0, 500, and 1000 mg/kg DCNB, respectively. The values are depicted as the mean ± S.D. of four or five mice per group. Significant differences from the control (0 mg/kg) group by Dunnett's test: *, P < 0.05; **, P < 0.01; ***, P < 0.001.
14-Day Repeated-Dose Study of DCNB.
Toxicological responses to DCNB in wild-type and Gstm1-null mice were examined in the 14-day repeated-dose study. Three wild-type males given 600 mg/kg died on days 8 and 10. One wild-type female given 600 mg/kg died on day 5. Three Gstm1-null females given 600 mg/kg died on days 4, 5 and 6. Although decreases in activity and fecal volume were observed in the dead animals, no pathological changes were observed in the results of the unscheduled autopsies (data not shown), and the cause of death could not be confirmed. In the hematological examination, a marked increase in MetHB was observed in both wild-type and Gstm1-null mice, which was similar in both sexes (Fig. 2A). On the other hand, a marked increase in RET was observed in the Gstm1-null mice (Fig. 2B). Although a statistically significant increase in RET was observed in the wild-type mice, the magnitude of the increase was slight compared with that in the Gstm1-null mice. A slight decrease in RBC was observed in wild-type males and Gstm1-null females (Fig. 2C). In the relative organ weight, an increase in spleen weight was observed in the Gstm1-null mice (Fig. 3). In the pathological examination conducted as an additional study, increased extramedullary hematopoiesis was observed in both strains with a higher grade score in the Gstm1-null mice (Table 2). Microarray analysis in the spleen demonstrated genes whose expression levels increased in the Gstm1-null mice (|expression ratio to control| >1.4) but not in the wild-type mice (|expression ratio to control| <1.4) after DCNB treatment. All of the microarray data are presented as Supplemental Table S1. Genes whose increasing ratio between Gstm1-null and wild-type mice (Gstm1-null/wild-type) exhibited a greater value than 2.5 are listed in Table 3. From these genes, the representative five genes that are related to hematopoiesis (i.e., Mmp9, Chi3l3, Trem3, Ms4a3, and Lcn2) were evaluated by quantitative RT-PCR. Quantitative RT-PCR showed exclusive up-regulation in Gstm1-null mice after DCNB treatment (Fig. 4), consistent with the results of microarray analysis.
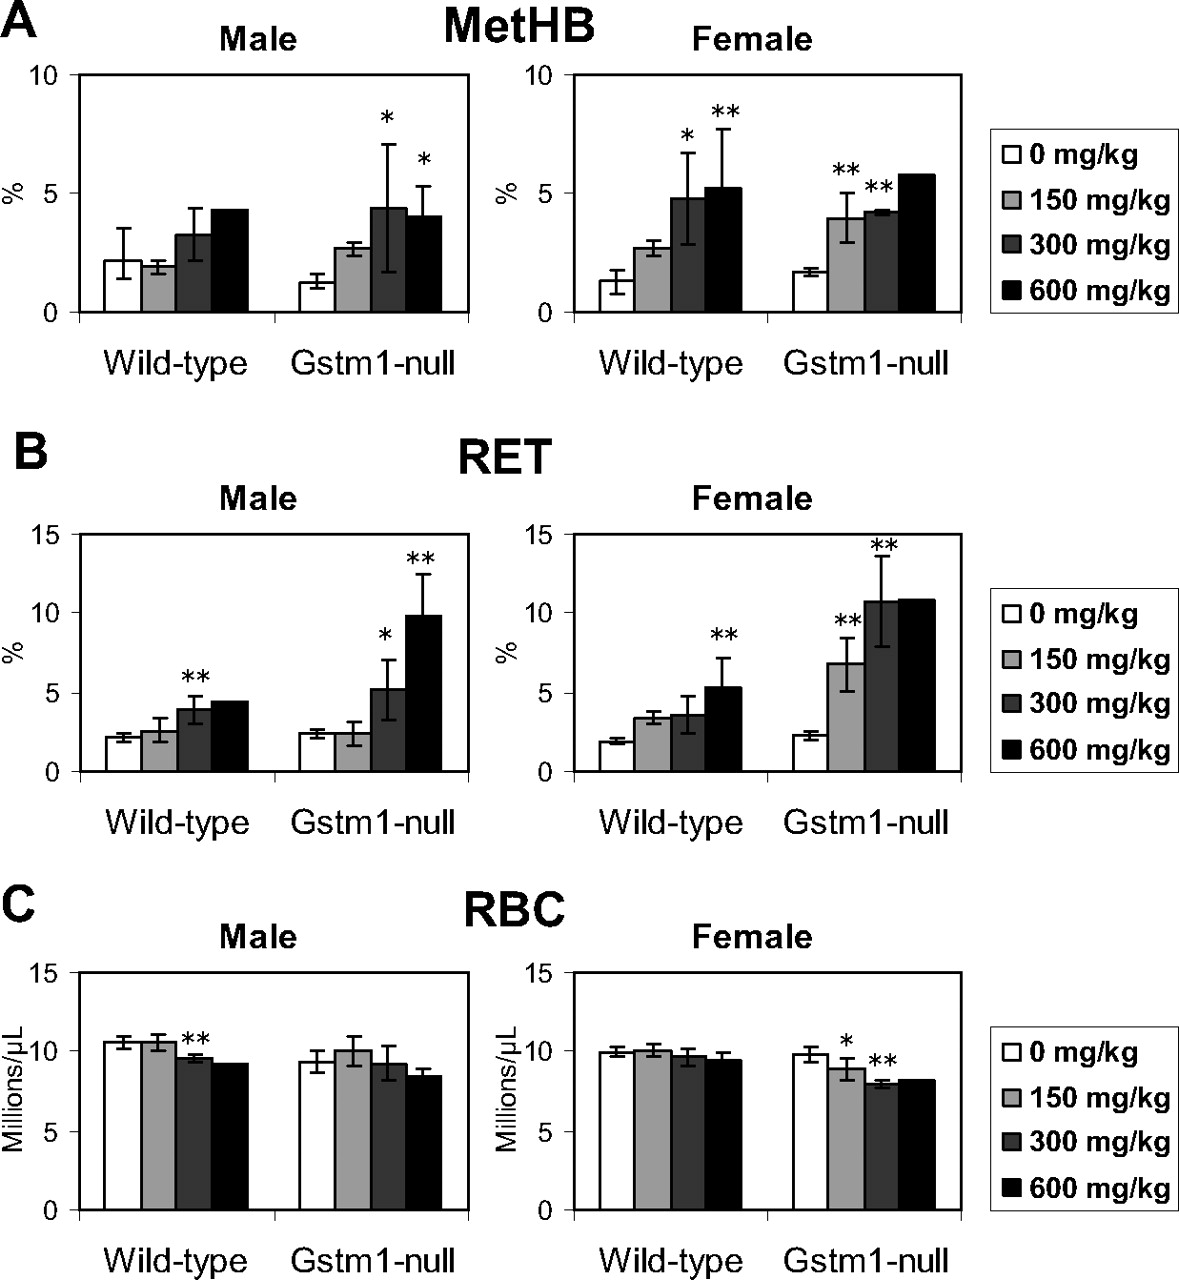
Hematological examination in the 14-day repeated-dose study of DCNB. Blood concentrations of MetHB (A), RET (B), and RBC (C) were measured after a repeated-dose oral administration of DCNB to wild-type control or Gstm1-null mice. Open, light gray, dark gray, and filled bars indicate dose levels of 0, 150, 300, and 600 DCNB mg/kg, respectively. The values are depicted as the mean ± S.D. of four or five mice per group. The values of wild-type male given 600 mg/kg and Gstm1-null female mice given 600 mg/kg are depicted as the mean of two animals and are excluded from statistical analysis. Significant differences from the control (0 mg/kg) group by Dunnett's test: *, P < 0.05; **, P < 0.01; ***, P < 0.001.

Relative spleen weight in the 14-day repeated-dose study of DCNB. Relative spleen weight was measured after a repeated-dose oral administration of DCNB to wild-type control or Gstm1-null mice. Open, light gray, dark gray, and filled bars indicate dose levels of 0, 150, 300, and 600 DCNB mg/kg, respectively. The values are depicted as the mean ± S.D. of four of five mice per group. The values of wild-type male mice given 600 mg/kg and Gstm1-null female mice given 600 mg/kg are depicted as the mean of two animals and are excluded from statistical analysis. Significant differences from the control (0 mg/kg) group by Dunnett's test: *, P < 0.05; **, P < 0.01; ***, P < 0.001.
Pathological grade of increased extramedullary hematopoiesis in the spleen after DCNB treatment for 14 days
Grade 0, no change compared with the control (0 mg/kg); grade 1, slight change; grade 2, moderate change; grade 3, marked change.
List of genes that were exclusively up-regulated in the spleen of female Gstm1-null mice after DCNB treatment for 14 days
Genes whose expression levels increased in the Gstm1-null mice (|expression ratio to control| >1.4) but not in the wild-type mice (|expression ratio to control| < 1.4) after DCNB treatment are extracted. In the table, genes whose increasing ratio between Gstm1-null and wild-type mice (Gstm1-null/wild-type) exhibited a value greater than 2.5 are listed. Expression levels of underlined genes were also measured by quantitative RT-PCR.

Quantitative RT-PCR analysis in the spleens of female mice in the 14-day repeated-dose study of DCNB. Quantitative RT-PCR was performed after a repeated-dose oral administration of DCNB to wild-type control or Gstm1-null mice. Open and dark gray bars indicate dose levels of 0 and 300 DCNB mg/kg, respectively. The values are depicted as the mean ± S.D. of four or five mice per group and are expressed as an arbitrary unit, whose values of wild-type control groups are set at 1 unit. Significant differences from the control (0 mg/kg) group: $, P < 0.05 (F test); *, P < 0.05 (Student's t test); #, P < 0.05 (Aspin-Welch t test).
TK Monitoring.
TK monitoring in plasma and blood cells was performed in the wild-type and Gstm1-null mice in the satellite groups of the 14-day repeated-dose study. DCNB concentrations in the Gstm1-null mice on days 1 and 14 were higher than those in the wild-type mice in both plasma and blood cells (Fig. 5, A and B). There were no apparent changes in DCNB concentrations after repeated dosing for 14 days. DCNB concentrations in blood cells were higher than those in plasma, and the ratio of blood cells/plasma was similar in both strains (Fig. 5C). Although a statistically significant increase was observed in the wild-type females, the magnitude of the increase was slight. Plasma M0 concentrations on days 1 and 14 in the Gstm1-null mice were lower than those in the wild-type mice (Fig. 5D). M0 concentrations in blood cells were below the lower limit of quantitation in most of the samples and could not be evaluated appropriately.
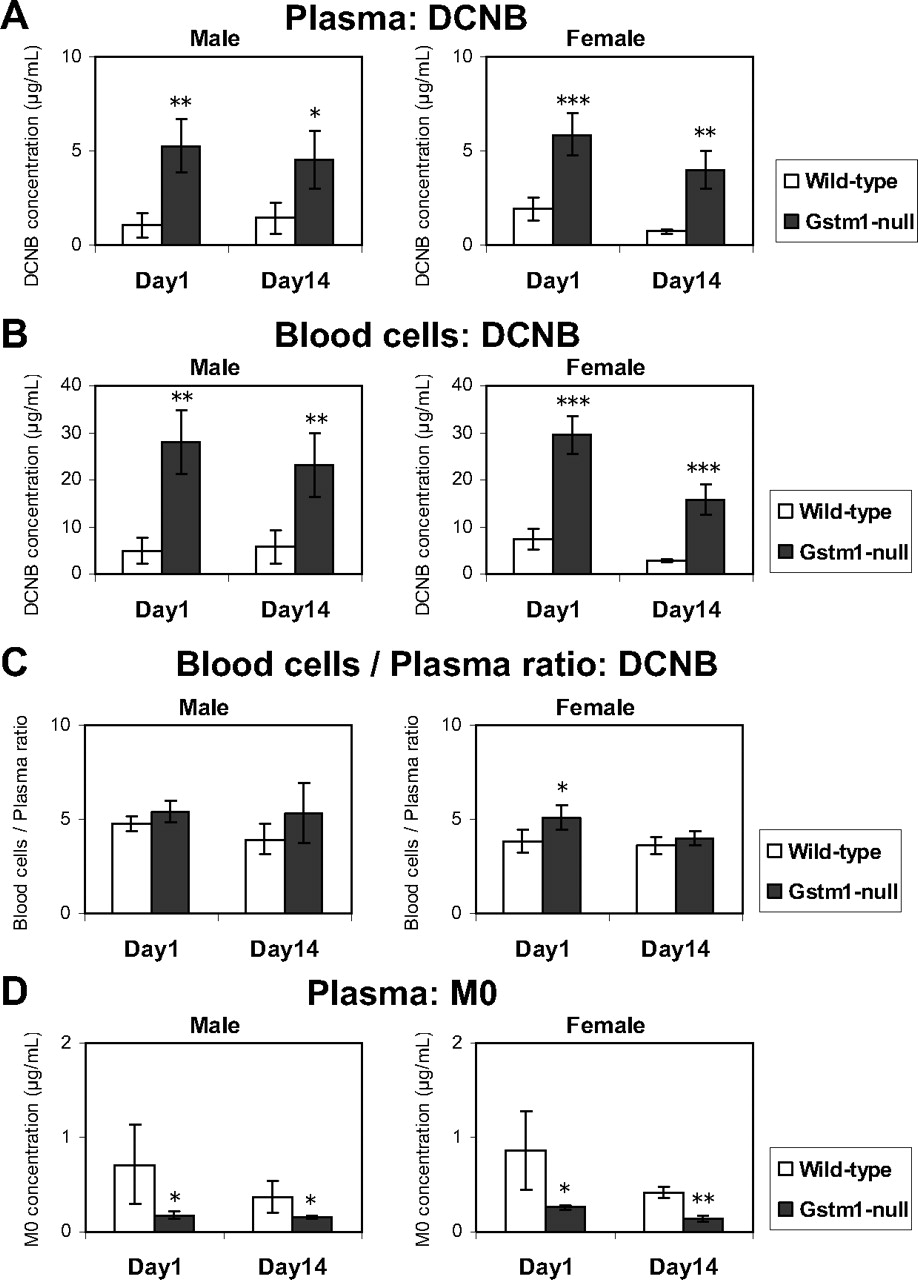
DCNB concentrations in plasma (A), blood cells (B), and the ratio of blood cells/plasma (C) after 2 h from the first (day 1) and last (day 14) dosing in a 14-day oral administration of DCNB (300 mg/kg) to wild-type control or Gstm1-null mice. D, M0 concentrations in plasma after 2 h from the first (day 1) and last (day 14) dosing in a 14-day oral administration of DCNB (300 mg/kg) to wild-type control or Gstm1-null mice. Open and dark gray bars indicate wild-type and Gstm1-null mice, respectively. The values are depicted as the mean ± S.D. of five mice per group. Significant differences from the wild-type control by F-t test: *, P < 0.05; **, P < 0.01; ***, P < 0.001.
Discussion
We investigated the effect of murine Gstm1 disruption on the toxicological response to DCNB, a specific substrate to Mu class GST, using Gstm1-null mice. In the single-dose study, a marked increase in blood MetHB was observed in the Gstm1-null mice, and the magnitude of the increase was greater than that in wild-type mice. Therefore, Gstm1-null mice were considered to be more predisposed to methemoglobinemia induced by a single dosing of DCNB, and it is suggested that the effect of Gstm1 disruption was reflected in methemoglobinemia in the single-dose study of DCNB. Because Gstm1-null mice showed markedly low GST activity to DCNB (Fujimoto et al., 2006) and higher exposure to DCNB in Gstm1-null mice was confirmed in TK monitoring, the predisposition to methemoglobinemia observed in Gstm1-null mice in the single-dose study is considered to be attributed to the higher exposure to DCNB.
In the 14-day repeated-dose study, in contrast, a marked increase in blood MetHB was observed in both wild-type and Gstm1-null mice, and the magnitude of the increase was similar in both strains. However, marked increases in blood RET, relative spleen weight, and extramedullary hematopoiesis in the spleen were observed in Gstm1-null mice. These changes were considered to be adaptive responses to methemoglobinemia, because it has been reported that repeated-dose studies of typical compounds that cause methemoglobinemia, such as nitrobenzene (Cattley et al., 1994), p-nitrochlorobenzene (Nair et al., 1986), and aniline (Hejtmancik et al., 2002), showed similar responses in experimental animals. The increase in blood RET is a compensatory hematopoiesis response to elevation of damaged erythrocytes, and the increase in relative spleen weight is attributed to sequestration of damaged erythrocytes and extramedullary hematopoiesis. In addition, these adaptive responses were not observed in the single-dose study of DCNB, and it has been reported that an increase in spleen weight was not observed 24 h after dosing with aniline to rats (Khan et al., 1997). Therefore, it is suggested that the adaptive responses enhanced by the repeated dosing for 14 days in Gstm1-null mice attenuated the higher predisposition to methemoglobinemia in the single-dose study. In addition, a single dosing seems to be not enough to show sufficient adaptive responses to methemoglobinemia. To get an insight into the molecular mechanism of adaptive responses, microarray analysis was conducted in the spleen of female mice and revealed that a number of genes were up-regulated exclusively in Gstm1-null mice after DCNB treatment. Five hematopoiesis-related genes, namely, Mmp9, Chi3l3, Trem3, Ms4a3, and Lcn2, were subjected to quantitative RT-PCR analysis to confirm their up-regulation, which was observed exclusively in the Gstm1-null mice. It has been reported that Mmp9 activation enhanced stem and progenitor cell recruitment and was found to be an essential factor for hematopoiesis (Heissig et al., 2002). The activation of the Mmp9-mediated response is also suggested by the up-regulation of Chi3l3, which is a chitinase family protein reported to be a substrate of Mmp9 and expressed in macrophages (Greenlee et al., 2006). Another macrophage-expressed gene, Trem3, which functions as an activating receptor (Chung et al., 2002), was also up-regulated in the Gstm1-null mice, suggesting that inflammatory cells were activated in the Gstm1-null mice after DCNB treatment. In addition, Ms4a3 is expressed in hematopoietic tissues and is tightly regulated during the differentiation of hematopoietic stem cells (Donato et al., 2002). On the other hand, Lpn2, a suppressor of red blood cell production (Miharada et al., 2005), was also found to be exclusively up-regulated in the Gstm1-null mice, which may be a feedback response against stimulated extramedullary hematopoiesis in the spleen. Taken together, splenic gene expression analysis in the repeated-dose study of DCNB showed exclusive up-regulation of hematopoiesis-related genes in Gstm1-null mice, supporting the increased extramedullary hematopoiesis in the spleen. However, several genes, such as Mmp8, Tm7sf3, and Spag5, whose biological functions are not apparently associated with hematopoiesis, were found by microarray analysis to exhibit exclusive up-regulation in Gstm1-null mice after the DCNB treatment. Further investigation will be needed to clarify the biological and toxicological significance of these gene expression changes that were exaggerated by the disruption of the Gstm1 gene after DCNB treatment. Regarding other parameters that changed in the 14-day repeated-dose study, a slight decrease in RBC was observed in Gstm1-null females but not in Gstm1-null males. Although it has been reported that typical compounds causing methemoglobinemia were accompanied by a hemolytic anemia (Nair et al., 1986; Cattley et al., 1994; Hejtmancik et al., 2002), not all compounds are hemolytic, such as chlorpropham (Fujitani et al., 2000) and sodium nitrite (National Toxicology Program, 2001). Therefore, it appears that methemoglobinemia induced by DCNB is not clearly associated with hemolytic anemia. To summarize the 14-day repeated-dose study of DCNB, it is suggested that the effect of Gstm1 disruption was reflected in adaptive responses to methemoglobinemia. This fact indicates that enhanced adaptive responses might mask the toxicities and careful interpretation might be necessary if genetically modified animals are to be used for the evaluation of toxicities.
In TK monitoring conducted in the satellite groups of the 14-day repeated-dose study, DCNB concentrations on days 1 and 14 in plasma and blood cells were higher in Gstm1-null mice than in wild-type mice. In addition, it seems that the movement of DCNB from plasma to blood cells and vice versa was not disturbed in Gstm1-null mice, because the ratio of blood cells/plasma was similar in both strains. Accordingly, the methemoglobinemia observed in the single-dose study and the adaptive responses observed in the 14-day repeated-dose study were considered to be based on a higher systemic exposure to DCNB in Gstm1-null mice. Although the metabolic pathway of DCNB has not yet been fully examined, it has been reported that glutathione conjugation by GST and the subsequent mercapturic acid formation were considered to be the main elimination pathway in the case of p-nitrochlorobenzene (Yoshida, 1994). Therefore, it seems reasonable to consider that glutathione conjugation catalyzed by GSTM1 and subsequent mercapturic acid formation would also be the main elimination pathway in the case of DCNB. The previous report (Fujimoto et al., 2006) showed a lower plasma concentration of M0 in Gstm1-null mice than in wild-type mice. In addition, a structural analysis of M0 revealed that the sulfur atom from glutathione was incorporated in M0, suggesting that M0 was produced after glutathione conjugation of DCNB. Moreover, the molecular weight of M0 was estimated to be 247, smaller than the glutathione conjugate of DCNB, whose molecular weight was 462. Considering these facts, it is suggested that DCNB is metabolized to M0 via a mercapturic acid pathway and is eliminated into the bile or urine. In the present study, plasma M0 concentrations in Gstm1-null mice showed lower values than those of wild-type mice and the results of the previous study were reproduced.
In conclusion, Gstm1-null mice showed marked methemoglobinemia and adaptive responses in single- and repeated-dose studies of DCNB, respectively. These findings were considered to be based on the higher exposure to DCNB due to Gstm1 disruption. It is suggested that the effect of Gstm1 disruption was reflected in toxicological responses related to methemoglobinemia. This study showed an example of a new approach to use genetically modified animals for the evaluation of toxicities that depend on drug metabolism.
Acknowledgments.
We thank Toshio Matsuura, Kiyomi Terada, Yasushi Yamazaki, Noriyo Niino, and Makoto Tomida for their technical assistance.
Footnotes
Article, publication date, and citation information can be found at http://dmd.aspetjournals.org.
doi:10.1124/dmd.110.033597.
↵
 The online version of this article (available at http://dmd.aspetjournals.org) contains supplemental material.
-
ABBREVIATIONS:
- GST
- glutathione S-transferase
- GSTM1
- glutathione S-transferase Mu 1
- DCNB
- 1,2-dichloro-4-nitrobenzene
- TK
- toxicokinetic
- RT
- reverse transcriptase
- PCR
- polymerase chain reaction
- RBC
- red blood cell count
- RET
- reticulocyte count
- MetHB
- methemoglobin
- M0
- methylsulfon-N-acetyl form of 1,2-dichloro-4-nitrobenzene.

- Received March 28, 2010.
- Accepted June 18, 2010.
- Copyright © 2010 by The American Society for Pharmacology and Experimental Therapeutics


