


Abstract
Cultures of primary hepatocytes and hepatoma cell line HepG2 are frequently used in in vitro models for human biotransformation studies. In this study, we characterized and compared the capacity of these model systems to indicate the presence of different classes of promutagens. Genotoxic sensitivity, enzyme activity, and gene expression were monitored in response to treatment with food promutagens benzo[a]pyrene, dimethylnitrosamine (DMN), and 2-amino-1-methyl-6-phenylimidazo[4,5-b]pyridine (PhIP). DNA damage could be detected reliably with the comet assay in primary human hepatocytes, which were maintained in sandwich culture. All three promutagens caused DNA damage in primary cells, but in HepG2 no genotoxic effects of DMN and PhIP could be detected. We supposed that the lack of specific enzymes accounts for their inability to process these promutagens. Therefore, we quantified the expression of a broad range of genes coding for drug-metabolizing enzymes with real-time reverse transcription-polymerase chain reaction. The genes code for cytochromes P450 and, in addition, for a series of important phase II enzymes. The expression level of these genes in human hepatocytes was similar to those previously reported for human liver samples. On the other hand, expression levels in HepG2 differed significantly from that in human. Activity and expression, especially of phase I enzymes, were demonstrated to be extremely low in HepG2 cells. Up-regulation of specific genes by test substances was similar in both cell types. In conclusion, human hepatocytes are the preferred model for biotransformation in human liver, whereas HepG2 cells may be useful to study regulation of drug-metabolizing enzymes.
Drug metabolism in the liver can be divided into two phases (Williams, 1971). Phase I is characterized by oxidative, reductive, and hydrolytic pathways adding a functional group (e.g., OH, SH, or NH2) to the substrate. In phase II, the newly introduced functional group is modified to O- and N-glucuronides, sulfate esters, various α-carboxyamides, and glutathionyl adducts, all with increased polarity relative to the unconjugated molecules (Parkinson, 1996). This two-step transformation should make the substrates more water soluble, so that they can be more readily excreted, and should lead to detoxification. However, many promutagens are inactive as mutagens prior to this biotransformation.
To estimate the risk of specific compounds to cause cancer in humans, many toxicity studies are done using animals. However, because of species differences, there is a need for a reliable human test system. Therefore, and to reduce the use of animals for toxicity assays, human cell culture models have been established. The preferred human in vitro models are primary hepatocytes and hepatoma cell line HepG2. In this work we evaluated the suitability of these model systems to predict genotoxicity of model promutagens that have been detected in human food samples. B[a]P1, PhIP, and DMN are among the most relevant compounds within their chemical group, and are carcinogenic in laboratory rodents and suspected human carcinogens (Ito et al., 1997; IARC, 1978). B[a]P is a polyaromatic hydrocarbon present in cooked meat and cigarette smoke, and is formed by the pyrolysis of fat (Knize et al., 1999). In humans it is mainly activated by CYP1A1 and in part by CYP1A2, CYP1B1, CYP2C9, and CYP3A4 (Gautier et al., 1996), and microsomal epoxide hydrolase (Sims et al., 1974). PhIP, a heterocyclic aromatic amine, is formed when protein-rich food is cooked at high temperatures (Knize et al., 1999). It is metabolically activated to a DNA-binding product via CYP1A2- and CYP1A1-catalyzed N-hydroxylation (Crofts et al., 1998). The nitrosamine DMN is present in many foodstuffs such as cured meat, cooked ham, smoked fish, and alcoholic beverages (Dich et al., 1996). CYP2E1 is responsible for the activation of DMN (Imaoka et al., 1996).
Here, primary human hepatocytes were cultivated between two layers of collagen (sandwich culture). This type of culture preserves both liver-specific functions and morphology over prolonged periods of time (Dunn et al., 1989; Bader et al., 1992). We established conditions to isolate the hepatocytes after treatment with test substances, avoiding damage of genomic DNA, which is essential for the evaluation of genotoxicity in comet assays. Primary hepatocytes showed higher genotoxic sensitivity toward treatment with promutagens than did HepG2. To show that this is due to a lack of specific enzymes in HepG2, we measured enzyme activity and mRNA expression of drug-metabolizing enzymes in both cell types. Furthermore, we show that increased expression of specific enzymes increases genotoxic sensitivity of HepG2 cells.
Most authors only describe the expression of cytochromes P450, belonging to phase I of drug metabolism in liver, but neglect the expression of phase II enzymes. However, phase II enzymes are important for the detoxification and for the activation of many xenobiotics (Cantelli-Forti et al., 1998). To get a more complete view about the drug metabolizing potential, we quantified mRNAs from genes coding for both phase I (CYPs 1A1, 1A2, 2B6, 2C9, 2D6, 2E1, 3A4, and 3A7) and phase II enzymes (microsomal epoxide hydrolase, UDP-glucuronosyltransferase 1A6, glutatione S-transferase M1, sulfotransferase 1A1, N-acetyltransferase 1, and NADP-quinone reductase 1). For mRNA quantification we used real-time RT-PCR and the LightCycler system.
Our results show that primary cells are more sensitive toward the promutagens tested. They express phase I enzymes at significantly higher levels than HepG2 cells and thereby more closely reflect metabolism in human liver.
Materials and Methods
Cell Culture. HepG2 cells were kindly provided by F. Darroudi (University of Leiden, Leiden, The Netherlands) and maintained in Dulbecco's modified Eagle's medium (Biochrom AG, Berlin, Germany) supplemented with 15% fetal calf serum and 50 μg/ml gentamicin (Invitrogen, Karlsruhe, Germany) and subcultured every 4 to 6 days. E47 cells (HepG2 containing CYP2E1-expression vector) and C34 cells (HepG2 with control vector) were kindly provided by A. Cederbaum (Mount Sinai School of Medicine, New York, NY) (Bai and Cederbaum, 2001). Both cell lines were maintained in the same medium as HepG2 cells with addition of 0.5 mg/ml G418 (PAA Laboratories GmbH, Linz, Austria). Human hepatocytes were isolated from specimens obtained from patients undergoing hepatic resections for the therapy of hepatic tumors after informed consent and according to the rules of the ethics committee of the Medical Highschool Hanover. Clinical characteristics of the patients are given in Table 1. Hepatocytes were isolated from prewashed livers by performing a two-step collagenase perfusion (Seglen, 1976) and cultivated within two layers of rat-tail collagen (sandwich culture) (Elsdale and Bard, 1972) in a modification of the method of Dunn et al. (1989) and Bader et al. (1994). Cells were plated at a density of 1.5 × 10⁵ cells/cm2 and cultured in serum-free HybridoMed DIF 1000 medium (Biochrom AG) containing 0.1 μg/ml human glucagon (Calbiochem-Novabiochem, Bad Soden, Germany), 0.7 μg/ml dexamethasone (Sigma Chemie, Deisenhofen, Germany), and 50 μg/ml gentamicin. Thin layers of collagen were prepared by wetting the surfaces and pipetted off dispensable collagen. This technique proved to be useful to prevent DNA damage of cells isolated afterward for the comet assay and to yield RNA with little protein contamination. The culture medium was replaced with fresh medium every day.
Clinical characteristics of lobectomy donors, cell viability after isolation, and performed assays
Treatment of Cells. Human hepatocytes were treated with test components on the 4th or 5th day in culture. HepG2 cells were treated when they were 60% confluent (∼8 × 10⁴ cells/cm2) at passages 5 to 10. For the treatment, 1000× stock solutions were made in DMSO for B[a]P (Sigma Chemie), 3-methylcholanthrene (3-MC) (ICN Pharmaceuticals, Frankfurt, Germany), and PhIP (Toronto Research Chemicals Inc., North York, ON, Canada). DMSO concentration never exceeded 0.1%. DMN (Sigma Chemie) is water-soluble and was therefore diluted in phosphate-buffered saline (PBS). Cells were exposed to the test compounds or solvent control (0.1% DMSO) for 24 h, except for 3-MC, which was added to the medium 6 h before the addition of PhIP. As a positive control in the comet assay, ethylmethane sulfonate, a direct mutagen (i.e., it does not need to be activated by liver enzymes) was used.
Comet Assay. Single-cell gel electrophoresis (comet assay) was performed as described by (Singh et al., 1988). It is a sensitive method to visualize single strand breaks in nuclear DNA of single cells. For comet assay, cells were cultured in 24-wells plates. After treatment, cells were washed with 300 μl of PBS (pH 7.4), with 10 min of incubation at 37°C, once for HepG2 and twice for human hepatocytes. Cells were detached by incubation with 50 μl of trypsin (0.25%) per well for 5 min, at 37°C. To decollate the cells, we added 300 μl of medium containing 15% fetal calf serum and pipetted three to four times. Then, cells were lysed for 2 h and transferred to fully frosted microscope slides (Menzel, Bonn, Germany). After electrophoresis under alkaline conditions (pH 13), DNA was stained with ethidium bromide, and the slides were evaluated under a fluorescence microscope (Zeiss Axiomat, Carl Zeiss GmbH, Jena, Germany) with the image analysis system Comet Assay II (Perceptive Instruments Ltd., Suffolk, UK). The strength of comet formation is expressed as “tail moment,” which is defined as product of tail length and tail intensity. Only cultures with a viability higher than 80% (determined by trypan blue exclusion) were used for further analysis. Single cultures of human hepatocytes displayed comet formation in untreated cells; these cultures were not used for comet assay.
Enzyme Assays. 7-Ethoxyresorufin O-deethylation (EROD) and 7-ethoxycoumarin O-deethylation (ECOD) were measured as previously described (Wiebkin et al., 1985; Donato et al., 1993). Assays were carried out in 24-well plates in a volume of 300 μl/well. For EROD, cell cultures were incubated with 10 μM 7-ethoxyresorufin and 10 μM dicumarol (Sigma Chemie, Taufkirchen, Germany) and for ECOD with 10 μM 7-ethoxycoumarin (ICN Pharmaceuticals, Frankfurt, Germany), for 1 h at 37°C. For analysis, conjugates were cleaved using 15 Fishman units of β-glucuronidase and 120 Roy units of arylsulfatase (Roche Diagnostics, Mannheim, Germany) in 0.1 M sodium acetate buffer (pH 4.5), at 37°C. After 2 h, the reaction was stopped with 1.6 M glycine buffer (pH 10.3). Formation of resorufin and coumarin was quantified by fluorometry in 96-well plates with a fluorescence plate reader (FLI; Bio-Tek, Neufahrn, Germany). Fluorescence was determined at λEx = 530 nm and λEm = 580 nm for resorufin and at λEx = 360 nm and λEm = 460 nm for coumarin.
RNA Isolation and Reverse Transcription. Total cellular RNA was isolated using Trizol reagent (Invitrogen, Karlsruhe, Germany) according to the manufacturer's protocol. This method yielded an average of 40 μg of total RNA from 106 cells. First-strand cDNA synthesis was performed in a total volume of 20 μl, where 5 μg of total RNA and 1 ng of luciferase mRNA (Promega, Madison, WI) were reverse-transcribed using 200 units of Superscript II RNase H- reverse transcriptase (Invitrogen, Karlsruhe, Germany), 5 pmol of oligo(dT)18 primer, and 40 units of RNase inhibitor (RNasin; Promega Mannheim, Germany).
Construction of DNA Standards. Gene-specific primers were designed using primer3 software (http://www-genome.wi.mit.edu/cgi-bin/primer/primer3_www.cgi) or taken over from former publications (Table 2) and were purchased from Sigma-ARK (Darmstadt, Germany). To exclude amplification of genomic DNA, primer pairs were designed to be intron-spanning, except for NAT1, which is coded by a single exon (Blum et al., 1990). With these primers, PCR was performed and PCR products were cloned into pCR IITOPO cloning vector (Invitrogen, Groningen, The Netherlands) according to the manufacturer's protocol. After purification with Mini Prep (QIAGEN, Hilden, Germany), the plasmid was linearized with restriction enzyme BamHI to avoid an inhibition of PCR efficiency by supercoiled structure of the plasmid. The concentration of the standard was determined by spectrophotometric absorbance at 260 nm, and DNA sequence of the PCR insert was verified by automated sequencing (MWG-Biotech AG, Ebersberg, Germany). The number of plasmid molecules was calculated on the basis of their molecular weight (number of base pairs × 635 g/mol) (Sambrook and Russel, 2001).
List of PCR primers
Conventional RT-PCR. PCR was done with primers for constitutively expressed genes (Table 2) such as GAPD, HMBS [hydroxymethylbilane synthase, former PBGD (porphobilinogen deaminase)], and HPRT (hypoxanthine phosphoribosyltransferase), as well as genes reported to be uniformly expressed in human adult and fetal tissues, ATP synthase (ATP5O) and elongation factor 1 alpha (EF1A1) (Warrington et al., 2000). Appropriate cDNA dilutions were empirically determined for each gene to ensure that the PCR did not reach saturation after 30 cycles. For visual comparison, PCR products were stained with ethidium bromide after gel electrophoresis in a 1.5% (w/v) agarose gel. Finally, GAPD was chosen for the normalization because of its frequent use as control in other RT-PCR studies.
Quantitative Real-Time RT-PCR. Quantification of cDNA was performed in the LightCycler (Roche Diagnostics) using the DNA Master SYBR Green I kit (Roche Diagnostics). The PCR reaction was done in a volume of 20 μl, containing 2 μl of SYBR Green I, 10 pmol of each primer, and 0.2 μl of TaqStart Antibody (BD Biosciences Clontech, Heidelberg, Germany). The final Mg2+ concentration was 3 mM for all PCR reactions except CYP2C9 and CYP2D6, where 5 mM and 4 mM were used, respectively. The PCR parameters were 95°C for 1 min, 1 cycle; 95°C for 1 s, specific annealing temperature (Table 2) for 8 s, 72°C for 14 to 18 s (depending on product length), 50 cycles. Specificity of the PCR conditions was verified for each gene, verifying the specific length of the PCR product by gel electrophoresis, and by the specific melting point of the product in the LightCycler. For each gene a standard curve was generated with 10-fold serial dilutions of the DNA standards ranging from 108 to 101 copies per PCR reaction. For quantification of the cDNAs, PCR was performed with 4 μl of the cDNA probe (1:5 dilution), 106 copies of the respective DNA standard, and water as negative control. Quantitative analysis of the data were done employing LightCycler analysis software (version 3.5; Roche). The cDNA probes were quantified using the standard curve previously generated, taking into account that one double-stranded plasmid refers to two single-stranded cDNAs. To calculate the final concentration of mRNA copies per cell, it was assumed that, on average, one cell contains 40 pg of total RNA and that 18% of the mRNA is transcribed into cDNA, which was the average efficiency for the reverse transcription reaction of luciferase mRNA in our experiments (Rodriguez-Antona et al., 2000).
Results
Comparison of Cell Morphology. Morphology and function are closely related characteristics. To point out the morphological differences between primary human hepatocytes and the hepatoma cell line HepG2, micrographs of both cell types are shown in Fig. 1. Primary hepatocytes display the typical cubic cell shape and often contain two nuclei (Fig. 1A). HepG2 cells have an epithelial-like morphology (Fig. 1B) and contain one nucleus with a chromosome number ranging from 48 to 54 chromosomes per cell (Natarajan and Darroudi, 1991).

Morphological comparison of human hepatocytes and hepatoma cell line HepG2.
Phase-contrast micrographs (100× magnitude) show primary hepatocytes in sandwich culture on the 3rd day in culture (A) and HepG2 at passage 5 (B). Primary hepatocytes display the typical cubic cell shape, and HepG2 cells show rather an epithelial-like morphology.
Comet Assay. After 24 h of treatment, promutagens B[a]P, PhIP, and DMN caused DNA damage in human hepatocytes. However, in HepG2, only B[a]P caused DNA damage, and PhIP and DMN failed to do so at the applied concentrations (Fig. 2). Thus, primary hepatocytes are shown to be more sensitive toward treatment with these promutagens. However, HepG2 pretreated with CYP1A inducer 3-MC became sensitive to PhIP and HepG2 over-expressing CYP2E1 (E47) became sensitive to DMN.

Genotoxic effects of promutagens on primary human hepatocytes and HepG2.
Comet formation in human hepatocytes (dark bars) and HepG2 (light bars) after 24 h of treatment with 0.1% DMSO (negative control), promutagens (B[a]P, PhIP, and DMN), and 0.5 μl/ml ethyl methane sulfonate (positive control). Additionally, HepG2 cells were treated with 2 μM 3-MC alone or, in combination with PhIP and transformed HepG2 lines C34 (with empty expression vector) and E47 (with CYP2E1 expression vector) (Bai and Cederbaum, 2001), were treated with 50 mM DMN. Data show mean and standard deviation from three independent hepatocyte cultures and three different HepG2 passages, respectively. Comet formation was induced in primary hepatocytes with all promutagens. However, HepG2 only showed genotoxic effects with B[a]P. Genotoxic susceptibility for PhIP could be increased in HepG2 by pretreatment with 3-MC. In contrast to C34 cells, E47 cells were sensitive toward DMN.
Enzyme Assays. EROD was strongly induced by B[a]P and by 3-MC in both cell types (Fig. 3A). In human hepatocytes, higher values were observed. ECOD was strongly induced in primary hepatocytes but was barely detectable in HepG2 (Fig. 3B). For both activities a maximum was observed at 10 μM B[a]P. EROD activity rapidly decreased at B[a]P concentrations higher than 10 μM. Both cell types were treated with DMN (up to 50 mM) and PhIP (up to 100 μM), but no significant enzyme activity changes could be detected (results not shown).

Enzyme activity in primary human hepatocytes and HepG2.
Enzyme activity (1 μU = 1 pmol/min) in human hepatocytes and HepG2 measured in culture medium. Cells were treated for 24 h with benzo[a]pyrene (0–100 μM) and, for EROD, additionally with 2 μM 3-MC. Data show mean and standard deviation of EROD (A) and ECOD (B) from three independent hepatocyte cultures and three different HepG2 passages, respectively. Both activities had their maximum at 10 μM benzo[a]pyrene, although with significantly lower activities in HepG2.
Expression of Housekeeping Genes and Genes of Drug Metabolism. To find an appropriate gene for normalization, expression of five housekeeping genes was tested by RT-PCR in HepG2 and primary hepatocytes. All genes appeared to be expressed to a similar level in both cell types (Fig. 4). Expression of genes coding for drug-metabolizing enzymes was quantified by real-time RT-PCR. Transcripts of all examined genes could be detected in both cell types; only CYP3A4 was not detectable in HepG2 (Table 3). Two genes were clearly expressed higher in HepG2, NQO1 and SULT1A1. In general, we found the expression of phase I enzymes to be much higher in human hepatocytes compared with that of HepG2, which is consistent with the measured enzyme activities (Fig. 3). GAPD, which was used as internal control for real-time PCR, was expressed slightly higher in HepG2 than in human hepatocytes.

Expression of five housekeeping genes in primary human hepatocytes and HepG2.
Expression of five housekeeping genes in HepG2 (lane A) and human hepatocytes (lane B) was examined by RT-PCR. PCR was done with cDNAs pooled from three different cell culture samples, respectively. Both cell types show similar expression levels, shown by intensity of bands and an agarose gel stained with ethidium bromide.
Approximate number of mRNA copies per cell a in human hepatocytes and HepG2 cells
Modulation of Gene Expression by Promutagens, 3-MC, or Transformation. Regulation of expression of drug-metabolizing enzymes by test promutagens was checked by real-time RT-PCR. For B[a]P, a concentration of 10 μM was chosen because this concentration showed the strongest induction in the enzyme assays (Fig. 3). Figure 5 shows gene induction after treatment with B[a]P. Additionally, the induction of single genes by 3-MC and by transformation with CYP2E1 expression vector (E47 cells) is shown (Fig. 5). As expected, CYP1A1 and CYP1A2 were strongly induced by 3-MC in both cell types, and E47 cells expressed CYP2E1 approximately 1000 times higher than did C34 cells or normal HepG2. As shown by comet assay, the so induced HepG2 cells were more sensitive toward PhIP and DMN (Fig. 2). Treatment with 50 mM DMN and 50 μM PhIP did not change the expression of the examined genes to a significant degree (data not shown). Figure 6 shows time- and concentration dependent induction of CYP1A1, CYP1A2, and NAT1 in HepG2 cells by B[a]P. The induction curve of NAT1 differs from that of CYP1A1 and CYP1A2, but NAT induction also occurs soon after B[a]P addition (Fig. 3B).
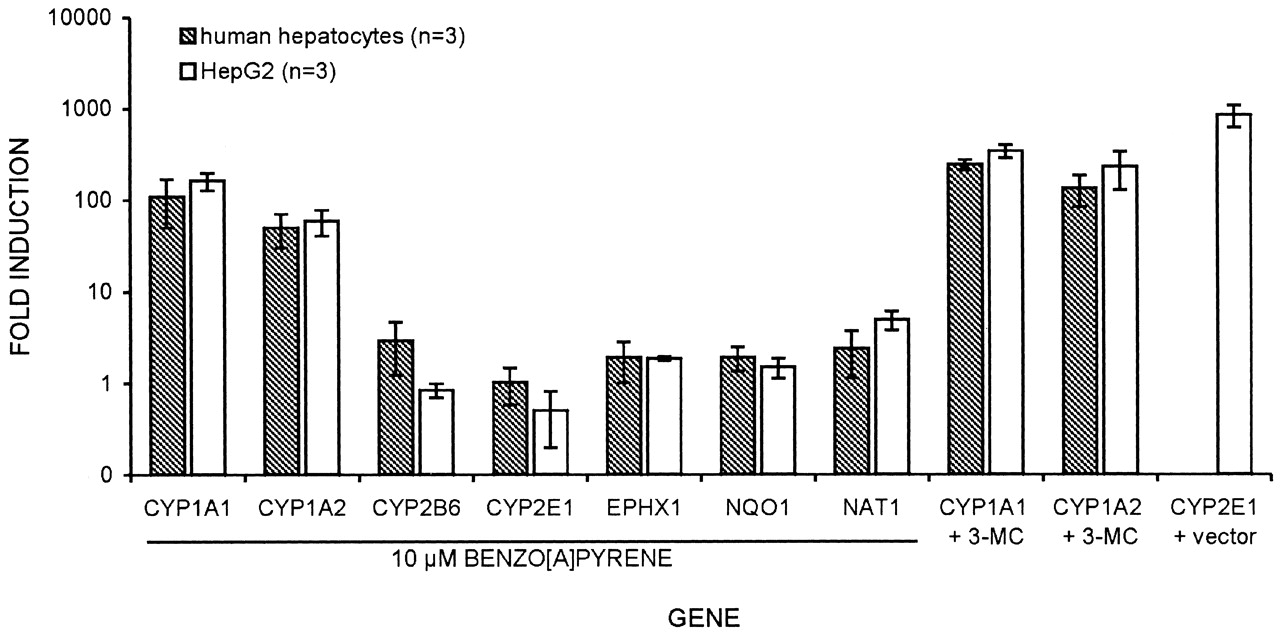
Regulation of gene expression in primary human hepatocytes and HepG2.
Relative changes in gene expression in human hepatocytes and HepG2 shown as fold induction (logarithmic y-axis). Genes are shown that were regulated significantly (>1.5-fold, <0.67-fold) in one of the cell types after treatment with 10 μM benzo[a]pyrene. Induction of CYP1A1 and CYP1A2 is shown after treatment with 2 μM 3-methylcholantene (3-MC). Increase of CYP2E1 expression in HepG2, transformed with CYP2E1 expression vector (cell line E47), is shown relative to expression of HepG2 with empty vector (cell line C34) (Bai and Cederbaum, 2001). Data show mean and standard deviation from three independent hepatocyte cultures and three different HepG2 passages, respectively. Similar gene regulation was observed for both culture models.

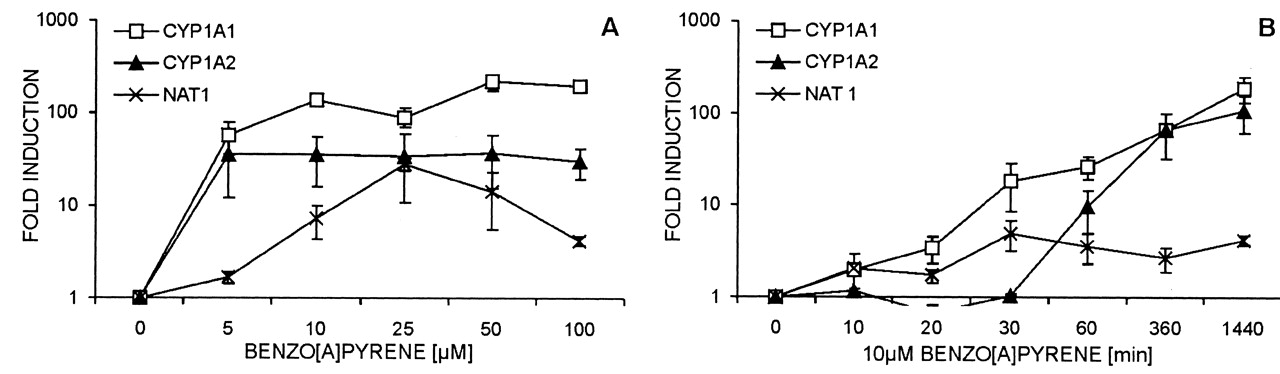
Time- and concentration-dependent induction of CYP1A1, CYP1A2 and NAT1 by benzo[a]pyrene.
Relative changes in expression of genes CYP1A1, CYP1A2, and NAT1 in HepG2 are shown as fold induction (logarithmic y-axis). HepG2 cells were treated with benzo[a]pyrene in different concentrations (A) and with different treatment times (B). Data represent mean values and standard deviation from three different passages of HepG2 cells. Induction of NAT1 was found to be lower than that of CYP1A genes. The main expression increase of CYP1A1 and NAT1 began as early as 30 min after application of benzo[a]pyrene.
Discussion
This is the first report that describes the successful performance of the comet assay with human hepatocytes in sandwich culture. This was made possible by the use of thin collagen layers which facilitated the later isolation procedure and permitted the use of trypsin instead of collagenase for isolation. It also appears to be important to do the comet assay at the right moment of cultivation time. Early after isolation (1–2 days), as well as in older cultures (more than 10 days), DNA damage was a common feature.
Here, all three promutagens caused DNA damage in human hepatocytes, but in HepG2, only B[a]P did so. We suppose that the reason for this is the low expression of specific phase I enzymes, necessary for the activation of DMN and PhIP. This theory is encouraged by our finding that only HepG2 cells with artificially increased expression of specific cytochromes P450 showed genotoxic response toward this promutagen (Fig. 2). It was reported before that 24 h of treatment with 90 mM DMN induces DNA damage in HepG2 in the comet assay (Uhl et al., 1999). In our experiments this concentration was toxic for HepG2 cells. Instead of DMSO, we used PBS as solvent for DMN.
After treatment with promutagens, the activity of phase I enzymes was assessed by EROD and ECOD. EROD mainly reflects the activity of isozymes CYP1A2 and CYP1A1 in human (Doostdar et al., 2000), and ECOD primarily reflects the activity of CYP2B6 followed by CYP2E1 and CYP1A2 (Wrighton and Stevens, 1992; Yamazaki et al., 1996). In both human hepatocytes and HepG2, EROD was strongly induced by B[a]P. Significant ECOD induction was only observed in human hepatocytes (Fig. 3B), which correlates with the low expression measured for the corresponding genes (CYP2B6, CYP2E1, and CYP1A2) (Table 3).
Whereas EROD activity decreased after a maximum of 10 μM B[a]P, after major induction at 5 μM, B[a]P mRNA expression of CYP1A1 and CYP1A2 remained at a high level or further increased until 50 μM B[a]P. These data suggest an autoregulatory mechanism that inhibits the translation or function of CYP1A1 and CYP1A2 via a post-transcriptional pathway. The rapid decay of CYP1A1 mRNA with a half-life of 2.4 h (Lekas et al., 2000) probably contributes to this mechanism, such that only a small part of transcript mRNA will be translated into protein. An autoregulatory loop for CYP1A1 was observed before in HepG2 (Jorgensen and Autrup, 1996) and in breast cancer cells (Lee and Safe, 2001).
In this study we used real-time RT-PCR for the quantification of gene expression because it is currently the most sensitive method for the quantification of low-abundant mRNAs and is highly specific (depending on primer selection) and reproducible for a broad range of template concentrations. Even changes in the expression of low expressed genes (like CYP1A2 in HepG2) could be detected exactly and were reproducible (Fig. 6). For our experiments, GAPD was a suitable control gene because it was expressed uniformly and at similar levels in human hepatocytes and HepG2 (Table 3), and it was not regulated by solvents or drugs.
In human hepatocytes we detected mRNA levels similar that reported previously for human liver samples (Andersen et al., 1998; Rodriguez-Antona et al., 2000). However, big differences were revealed in the expression of drug-metabolizing enzymes between human hepatocytes and HepG2. Expression of P450s in HepG2 was found to be extremely low compared with expression in primary human hepatocytes. These results are in accordance with results reported by Rodriguez-Antona et al. (2002), who suggested a low ratio of LAP/LIP expression in HepG2 as a possible reason. Both, LAP and LIP are transcribed from the C/EBP-β gene (Descombes and Schibler, 1991) and function as P450 activator and P450 inhibitor, respectively. Jover et al. (2001) also described the expression of P450s to be lower in HepG2 and found that liver-specific transcription factors (hepatocyte nuclear factors and C/EBP-α) are expressed to a lower level in HepG2.
The most abundant isozyme of all P450s in human liver, namely CYP3A4, is also recognized to be the most important isoform in drug metabolism. In HepG2 we could not detect CYP3A4 mRNA (Table 3). A shortage of this important phase I enzyme strongly limits the use of HepG2 for the prediction of drug metabolism. We also included the closely related CYP3A7 in our experiments to see if it might substitute for CYP3A4. In human, CYP3A7 is expressed from early in gestation until the perinatal period, when there is a switch in expression to CYP3A4 (Schuetz et al., 1994). As a matter of fact, in HepG2, CYP3A7 mRNA was detectable and, additionally, CYP1A1 was more strongly expressed than CYP1A2. Both phenomena had been described for fetal liver (Hines and Mc-Carver, 2002); in this regard, HepG2 rather resembles the fetal state of the liver.
Contrary to genes of phase I enzymes, SULT1A1 and especially NQO1, which belongs to phase II of drug metabolism, were expressed significantly higher in HepG2 (Table 3). NQO1 in general is expressed higher in tumor compared to normal tissue (Riley and Workman, 1992). In addition to the low expression of phase I enzymes, the high expression of phase II coding genes observed in HepG2 might have a protective effect against promutagens. In mutation studies, this phenomenon might lead to false negative results. Nevertheless, we could show that the regulation of the examined genes in HepG2 is similar to those of primary hepatocytes. Therefore, HepG2 might be a useful tool for the study of gene regulation in human liver cells.
To our knowledge this is the first report that NAT1 and, to a minor extent, NQO1 expression is up-regulated by B[a]P treatment (Fig. 5). The fact that NAT induction occurred as early as 10 min after B[a]P application (Fig. 3B) suggests a direct induction by B[a]P itself and not by its metabolites. In our experiments neither PhIP nor DMN was found to modulate expression of drug-metabolizing enzymes significantly.
Overall, it can be concluded that, to date, human hepatocytes are the most suitable in vitro model for biotransformation in human liver and are of great importance for toxicological and pharmaceutical studies. Our results show that in contrast to HepG2 cells, primary hepatocytes are a valuable in vitro model to identify compounds that are potentially toxic to humans. A disadvantage of human hepatocytes is the shortage of available human liver material. Additionally, primary hepatocytes do not proliferate and lose their metabolic activity after some weeks. This may be overcome by the generation of differentiated hepatocytes from adult or embryonic stem cells or immortalization of differentiated hepatocytes. Another promising approach is the cryopreservation of human hepatocytes. The HepG2 cell line is easy to handle and provides a reproducible human system. However, HepG2 cells are less suitable to predict metabolism in adult human liver cells, because its expression of drug-metabolizing enzymes is distinct from the in vivo situation.
Acknowledgments
We thank Bernd Frericks for the clarification of the patients from whom hepatic tissue was taken, Andrea Hanika and Christina Reimer for the isolation of the hepatocytes (Medical School Hanover, Hanover, Germany), Katja Müller and Manfred Wirth for the friendly support with the use of the LightCycler system (GBF, Braunschweig, Germany), and Bernd Görlitz (Fraunhofer-Institute for Toxicology and Aerosol Research, Hanover, Germany) for permission to evaluate the comet assay in his laboratories.
Footnotes
-
↵1 Abbreviations used are: B[a]P, benzo[a]pyrene; PhIP, 2-amino-1-methyl-6-phenylimidazo[4,5-b]pyridine; DMN, dimethylnitrosamine; RT-PCR, reverse transcription-polymerase chain reaction; DMSO, dimethyl sulfoxide; 3-MC, 3-methylcholanthrene; PBS, phosphate-buffered saline; EROD, 7-ethoxyresorufin O-deethylation; ECOD, 7-ethoxycoumarin O-deethylation; NAT, N-acetyltransferase; HMBS, hydroxymethylbilane synthase; HPRT, hypoxanthine phosphoribosyltransferase; ATP5O, ATP synthase; EF1A1, elongation factor 1 alpha; NQO1, NADP-quinone reductase 1; SULT, sulfotransferase; GAPD, glyceraldehyde-3-phosphate dehydrogenase; LAP, liver-enriched activator protein; LIP, liver-enriched inhibitor protein; C/EBP, CCAAT/enhancer-binding protein.
-
This work was supported by the European Union, HEPADNA Contract QLRT-1999-00810 and by a fellowship from the Dr. Hilmer-Stiftung for S.W.
- Received February 26, 2003.
- Accepted April 24, 2003.
- The American Society for Pharmacology and Experimental Therapeutics


