


Abstract
Seven dog cytochromes P450 (P450s) were heterologously expressed in baculovirus-Sf21 insect cells. Of all enzymes examined, CYP1A1 exhibited high 7-ethoxyresorufin O-deethylase activity (low Km enzyme, 1 μM). CYP2B11 and CYP3A12 effectively catalyzed the N1-demethylation and C3-hydroxylation of diazepam (and its derivatives), whereas CYP3A12 and CYP2D15 catalyzed exclusively the N- and O-demethylation, respectively, of dextromethorphan. However, no saturation velocity curves for the N-demethylation of dextromethorphan (up to 500 μM) were achieved, suggesting a high Km for CYP3A12. In contrast to CYP3A12, the CYP2D15-dependent O-demethylation of dextromethorphan was a low Km process (Km = 0.7 μM), similar to that in dog liver microsomes (Km = 2.3 μM). CYP2D15 was also capable of metabolizing bufuralol (1′-hydroxylation), with a Km of 3.9 μM, consistent with that obtained with dog liver microsomes. CYP3A12 was shown to primarily oxidize testosterone at 16α-, 2α/2β-, and 6β-positions. Selectivity of CYP3A12 was observed toward testosterone 6β-(Km = 83 μM) and 2α/2β-hydroxylations (Km = 154 μM). However, the 16α-hydroxylation of testosterone was catalyzed by CYP2C21 also (Km = 6.4 μM for CYP2C21). Therefore, the 6β- and 16α-hydroxylation of testosterone can potentially be employed as markers of CYP3A12 and CYP2C21 (at low concentration), respectively. CYP2C21 was also capable of catalyzing diclofenac 4′-hydroxylation, although some activity was detected with CYP2B11. Surprisingly, none of the P450s selectively metabolized (S)-mephenytoin 4′-hydroxylation. The results described herein are a first step toward the systematic evaluation of a panel of dog P450s and the development of dog P450 isoenzyme-selective marker substrates, as well as providing useful information on prediction and extrapolation of the results from in vitro to in vivo and from dog to human.
Dog is an important, widely used species within the pharmaceutical industry for assessing the metabolism, pharmacokinetics, safety, and efficacy of drugs and drug candidates in discovery and development. In comparison to rat and human P450s,1 however, relatively little is known about specific dog P450 enzymes. To date, nine dog P450 genes, CYP1A1 (Uchida et al., 1990), CYP1A2 (Uchida et al., 1990), CYP2B11 (Graves et al., 1990), CYP2C21 (Uchida et al., 1990), CYP2C41 (Blaisdell et al., 1998), CYP2D15 (Sakamoto et al., 1995), CYP2E1 (Lankford et al., 2000), CYP3A12 (Ciaccio et al., 1991), and CYP3A26 (Fraser et al., 1997), have been isolated and sequenced. Some of these P450 proteins have been heterologously expressed using a variety of vector systems, and only a limited number of studies have been carried out to assess their metabolic competency. The induction of dog P450s has also been reported. For example, phenobarbital and rifampicin induce CYP2B11 and CYP3A12, respectively (Duignan et al., 1988; Ciaccio and Halpert, 1989; Klekotka and Halpert, 1995; Nishibe et al., 1998). Likewise, CYP1A1/2 expression is increased after treatment with polychlorinated biphenyls and β-naphthoflavone (Ohta et al., 1990). These studies indicate that the responses of the dog P450s to these conventional inducers are generally similar to those of rat and human.
cDNA-directed expression of individual P450s, in different expression systems, has been shown to be very valuable in P450 research. However, many systems have yielded low to moderate expression levels in eukaryotic cells (Oeda et al., 1985; Zuber et al., 1986; Battula et al., 1987; Doehmer et al., 1988) or high levels of truncated, modified cDNA of P450s in prokaryotic cells (Gillam et al., 1993). The baculovirus has distinct advantages for the high-level production of active proteins from full-length P450 genes and has been successfully used to express many P450s from different species (Gonzalez et al., 1991; Buters et al., 1995; Grogan et al., 1995; Crespi and Penman, 1997). In a baculovirus system, activity of the expressed P450 requires the support of oxidoreductase (OR). P450 and OR can be expressed using a single virus containing both genes, or by coinfection with two independent viruses containing separate P450 and OR genes (Buters et al., 1995; Grogan et al., 1995).
Given the utility of the baculovirus system, and the need for recombinant dog P450s to support drug metabolism studies, we sought to heterologously express seven beagle dog P450s. Each protein was characterized using a number of P450 substrates, and a full kinetic analysis was performed in each case.
Materials and Methods
Materials. Chemicals were obtained from the following sources: diclofenac, cortisone, flufenamic acid, dextromethorphan, dextrorphan, propranolol, 4′-OH-butyranilide, phenytoin, testosterone, diazepam (DZ), temazepam (TMZ), nordiazepam (NDZ), oxazepam (OX), levallorphan, and NADPH from Sigma-Aldrich (St Louis, MO); bufuralol, 1′-OH-bufuralol, (S)-mephenytoin, 4-OH-diclofenac, 3-methoxymorphinan, and 4′-OH-mephenytoin from Ultrafine Ltd. (Manchester, UK); and 6β-, 16α-, 16β-, 2α-, 2β-, and 15β-OH-testosterone, and 6β-OH-progesterone from Steraloids (Wilton, NH). 7-Ethoxyresorufin, resorufin, and pooled liver microsomes from 10 male beagle dog donors were purchased from BD Gentest (Woburn, MA). Baculovirus shuttle vector, pBlueBac4, Bac-N-Blue transfection kit, fetal bovine serum, Grace's and Sf-900 II SFM (serum-free medium) insect cell media, and Sf21 insect cells (Spodoptera frugiperda Sf21) were obtained from Invitrogen (Carlsbad, CA).
Construction of Recombinant Baculovirus. The cDNAs for seven dog P450s were obtained by amplification from mRNA recovered from primary cultures of male beagle dog primary hepatocytes (Laboratory Animal Resources, Merck Research Laboratories, West Point, PA). To enhance expression of the different P450s, the cultures were treated separately with phenobarbital (1 mM), 3-methylcholanthrene (25 μM), or rifampicin (25 μM) for 48 h. Total RNA was isolated from the hepatocytes using an RNeasy Miniprep Kit (QIAGEN, Valencia, CA), and cDNA was produced by reverse transcription using avian myeloblastosis virus reverse transcriptase (Roche Diagnostics, Indianapolis, IN) and oligo(dT) (Invitrogen). The incubations were carried out for 1 h at 37°C followed by PCR amplification of the target cDNA using Taq polymerase (Invitrogen) with the respective forward and reverse PCR primers. Each forward primer was designed to incorporate a Kozak sequence (CCACC) 5′ to the initiator ATG.
The PCR products were cloned into pCR2.1 (Invitrogen), and the DNA sequence was confirmed by sequencing, using the Big Dye Terminators cycle sequencing kit, and analyzed on an ABI Prism 310 Genetic Analyzer according to the manufacturer's recommended protocols (Applied Biosystems, Foster City, CA). GenBank accession numbers for the cDNA sequences are: M92447 (CYP2B11), AF049909 (CYP2C21), AF016248 (CYP2C41), X54915 (CYP3A12), AF547269 (CYP3A26), AB004268 (CYP2D15), and L77459 (CYP1A1).
Expression of Recombinant P450s in Sf21 Cells. The entire coding region of each cDNA was excised from the vectors and was inserted into the baculovirus expression shuttle vector pBlueBac4.5 (Invitrogen), using standard molecular biology techniques. This shuttle vector contains the polyhedrin late promoter that is used to drive protein expression in the Sf21 insect cells (Shou et al., 2001). Recombinant virus was constructed with the Bac-N-Blue transfection kit (Invitrogen) in Sf21 cells, according to the manufacturer's instruction, and isolated using Blue-Gal for color selection of recombinant virus. After two runs of plaque purification, the virus was then amplified into a high-titer stock for protein expression and kept at 4°C in the form of culture supernatant. Viral titers were measured by plaque assay as described in a protocol of Invitrogen. Sf21 insect cells were grown at 27°C in Grace's medium containing 10% fetal bovine serum or Sf-900 II SFM to a density of 1 to ∼2 × 10⁶ cells/ml (400 ml in total) in 1-liter spinner flasks (Bellco Glass, Inc., Vineland, NJ) with enlarged blades at 90 rpm. Cells were infected at approximately 1.0 MOI (multiplicity of infection) of virus encoding the P450 of interest and 0.1 MOI of virus encoding P450-OR. Then, 1 μg of hemin per ml of medium in the form of a hemin-albumin complex was added. After 72 h, cells were harvested by centrifugation and resuspended with 20% glycerol in 0.1 M KPi (potassium phosphate buffer). Total P450 content was measured by the CO-difference spectrum. Microsomes were prepared as described below, and the resulting protein concentration was determined with bicinchoninic acid according to the manufacturer's directions (Pierce Chemical, Rockford, IL).
Bioreactors. A 2- or 5-liter Bench-Top Fermenter (B. Braun Biotech Inc., Allentown, PA) was employed to scale-up the production of dog P450s. Internal pH control was bypassed and handled by a separate controller maintaining the pH (6.1–6.3). Oxygen and nitrogen gas were ventilated into cell suspension by bubbling and controlled at 60% content. Temperature was maintained at 27°C and stirring speed was 90 rpm unless otherwise specified. Cell densities of nearly 2 × 10⁶ viable cells/ml with a doubling time of 20 to 24 h were routinely achieved in Sf-900 II SFM and prolonged the stationary phase up to 4 to 5 days at high cell viability.
Microsomal Preparation from Sf21 Cells Expressing Individual P450s. Microsomes were prepared by two speed centrifugations (9,000 and 115,000g) and were reconstituted in a buffer (pH = 7.4) containing 0.25 M sucrose, 1 mM EDTA, 0.5 mM dithiothreitol, 1.15% KCl, and 0.1 M potassium phosphate (KPi). Content of individual P450s and activity of coexpressed P450-OR in Sf21 microsomal preparations were measured by CO-difference spectrum and cytochrome c reduction assay. Microsomes were stored at -70°C until used.
Enzyme Activity and Kinetics. 7-Ethoxyresorufin, testosterone, DZ, TMZ, NDZ, diclofenac, (S)-mephenytoin, bufuralol, and dextromethorphan assays were performed in a final volume of either 0.2-ml (96-well plate) or 1-ml mixtures (test tube). In all cases, the reaction mixture contained 0.1 M potassium phosphate (pH 7.4), MgCl2 (10 μM), and a varying amount of recombinant P450 or dog liver microsomal protein. Reactions were initiated with the addition of NADPH (1 mM), allowed to proceed for 10 or 20 min at 37°C, and terminated with either methanol or acetonitrile (2–3 volumes) containing the appropriate internal standard. Samples were spun for 10 min at 3000 rpm to precipitate protein, and the supernatant was separated and diluted for HPLC or LC/MS-MS analysis (Table 1). For 7-ethoxyresorufin O-deethylation, the resorufin formed was detected by fluorescence (λex, 550 nm and λem, 586 nm) (Burke et al., 1977).
LC/MS-MS procedures for the identification and quantitation of metabolites after incubation of the substrates with various cDNA-expressed dog P450 proteins
To obtain estimates of Km and Vmax, reaction rates were measured under linear conditions using a number of substrate concentrations: testosterone (1.9-490 μM), 7-ethoxyresorufin (0.02–142 μM), diclofenac (0.4–1000 μM), (S)-mephenytoin (1.9-490 μM), bufuralol (0.5–500 μM), dextromethorphan (0.03–500 μM), DZ (1.5–300 μM), TMZ (1.5–300 μM), and NDZ (1.5–300 μM). Sample preparation for individual incubations was described elsewhere. Rates for the formation of metabolite in each assay were quantitated with respect to internal standards and normalized by calibration curves of the metabolite standard versus internal standard. Data were used to fit either Michaelis-Menten kinetics (eq. 1) or the Hill equation (eq. 2), with a nonlinear regression for the determination of Km and Vmax.
HPLC and LC/MS-MS. HPLC was performed on a Hewlett-Packard (Palo Alto, CA) model 1100 liquid chromatograph. Separation of the metabolites formed in the metabolism of dextromethorphan was accomplished using a Zorbax SB-C18 eluted with a 20-min linear gradient (20–40% acetonitrile in water containing 0.05% acetic acid) at a flow rate of 1 ml/min. Metabolites formed from testosterone, DZ, TMZ, NDZ, bufuralol, dextromethorphan, (S)-mephenytoin, or diclofenac were analyzed with LC/MS-MS (Table 1) and quantitated, respectively, according to appropriate calibration curves of authentic metabolite standards.
Kinetic Analysis.Km and Vmax were calculated by fitting data into either Michaelis-Menten (υ = Vmax [S]/(Km + [S]); eq. 1) or Hill equations (υ = Vmax [S]n/(Km + [S]n); eq. 2), using a nonlinear regression of SigmaPlot 7.1 (SPSS Science, Chicago, IL).
Results
Protein Expression. Full-length cDNAs for seven dog P450 isoforms, representing three gene families, were cloned into the baculovirus shuttle vector (pBlueBac4.5). Recombinant baculovirus was constructed with the Bac-N-Blue transfection kit (Invitrogen) in Sf21 cells. The separate viruses were plaque-purified and amplified to a high-titer stock for use in expression. Each P450 was expressed in Sf21 insect cells in the presence of hemin. The MOIs of the viruses (P450 versus OR) were optimized as a ratio of 5 to 10:1 to support maximally the P450-catalyzed reactions as previously reported (Shou et al., 1998). MOI exceeding 5:1 reduced the yield of P450 expression and hampered catalytic activities. The coexpression of each P450 with OR was systematically examined using the CO-difference spectrum and the assays for the substrates developed for individual P450s (Table 2). On the other hand, MOI less than 20:1 resulted in greater expression levels of a P450 but poor catalytic activities due to a lack of adequate OR activity. Three days after infection, maximal expression levels of each P450 (usually 100–300 pmol/106 cells) were achieved and measured by CO-difference spectrum. Expressed P450s showed a typical CO-reduced difference spectrum with a maximum wavelength occurring at approximately 450 nm. OR levels in a coexpression system with each of the P450s were measured by a cytochrome c reduction assay. Activity of OR was determined by the rate of formation of reduced cytochrome c and calculated by a linear curve of product formed versus incubation time. To adequately support a P450-catalyzed reaction, an OR activity of 0.5 μmol/min/mg microsomal protein and above was accepted. Sf21 microsomal preparations were isolated by two centrifugation steps (9,000g and 110,000g) and used for catalytic function analysis.
Marker assays for seven dog P450s
Substrate Specificity. In the initial screening of the dog enzymes for substrate specificity, known marker substrates for human P450s were selected (Table 2). As indicated in Fig. 1, at least three dog P450s (CYP2B11, CYP2C21, and CYP3A12) exhibited significant testosterone hydroxylase activities, resulting in at least four detectable regio- and stereoselective hydroxylated products. CYP1A1, CYP2C41, CYP2D15, and CYP3A26 had low but measurable activities. CYP3A12 catalyzed testosterone 2α/2β-, 6β-, and 16α-hydroxylations as its major activities but, to a lesser extent, formed two minor 7α-OH- and 16β-OH-testosterones. No significant activities toward testosterone 6β-hydroxylation were observed for enzymes other than CYP3A12. Since a separation of 2α-OH- and 2β-OH-testosterones was not achievable on LC/MS-MS, the additive amount for the two metabolites was quantitated and therefore found to be most abundant. CYP2C21 catalyzed testosterone hydroxylation almost exclusively at the 16α-position, leading to a major 16α-OH-testosterone metabolite. The activity was comparable to that of CYP3A12. CYP2B11 also had, but to a lesser extent, turnover of the testosterone molecule, forming at least four metabolites, particularly 16α-OH-testosterone. DLMs generated all forms of the hydroxylated testosterones detected in the recombinant forms of the dog P450s. The most abundant metabolites in DLMs were 2α/2β-OH-, 16α-OH-, and 6β-OH-testosterones, with a metabolite profile similar in appearance to that of CYP3A12.

Metabolism of testosterone in the presence of DLMs and seven recombinant dog P450 isoforms.
Incubation mixture (duplicate) contained 0.1 μM for each recombinant enzyme or 1.25 μM total P450 for DLMs, 100 μM testosterone, and 1 mM NADPH, and was incubated in a water bath at 37°C for 15 min. The hydroxylated products (at least four hydroxylated testosterones) were formed and analyzed by LC/MS-MS as described in Table 1, and specific activity of each enzyme for the product formation was expressed as nanomoles of product per minute per nanomole of P450 protein.
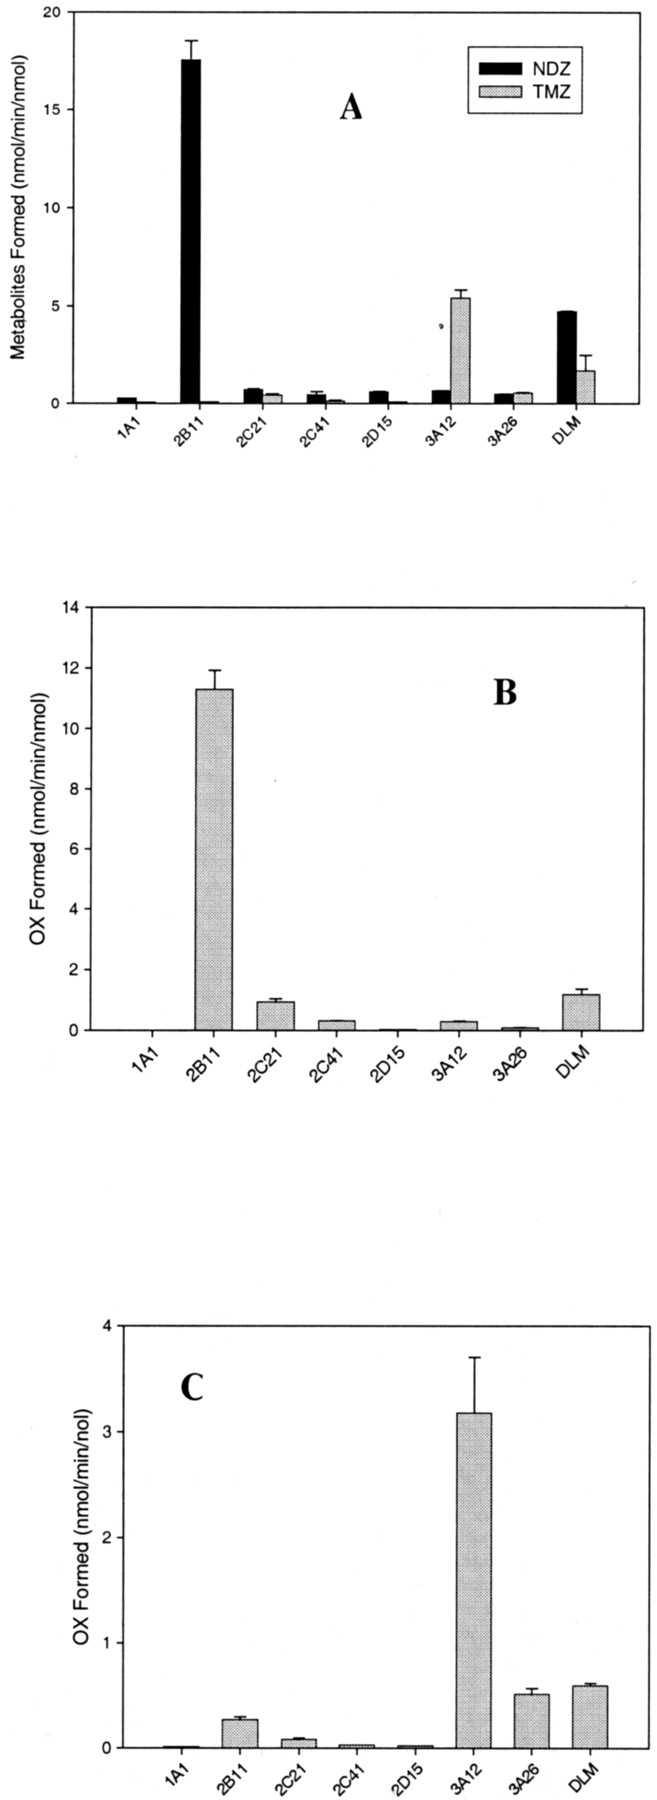
In the metabolism of DZ and its derivatives, CYP3A12 and CYP2B11 were found to be the most active isoforms (Fig. 2, A–C). CYP3A12 preferentially metabolized the C3-hydroxylation of DZ (or NDZ), forming TMZ (or OX). Conversely, CYP2B11 catalyzed almost exclusively the N1-demethylation of DZ (or TMZ), forming NDZ (or OX). Other enzymes (CYP1A1, CYP2C21, CYP2C41, CYP2D15 and CYP3A26) were either poorly active or essentially inactive. DLMs, when DZ, TMZ, or NDZ was used as a substrate, displayed both N1-demethylase and C3-hydroxylase activities, and activity of DLMs for N1-demethylation of DZ was 3-fold greater than that for C3-hydroxylation. This suggests that CYP3A12 and CYP2B11 might play an essential role in the metabolism of DZ.

Metabolism of DZ (A, 100 μM), TMZ (B, 100 μM), and NDZ (C, 100 μM) in the presence of DLMs and seven recombinant dog P450 isoforms.
Incubation mixture (triplicate) contained 0.1 μM for each recombinant enzyme or 1.25 μM total P450 for DLMs, 100 μM substrate, each, and 1 mM NADPH, and was incubated in a water bath at 37°C for 15 min. The products (NDZ and TMZ from DZ, and OX from either TMZ or NDZ) were separated and analyzed by LC/MS-MS as described in Table 1, and specific activity of each enzyme for the product(s) formed was expressed as nanomoles of product per minute per nanomole of P450 protein.
In human liver, dextromethorphan O-demethylation and N-demethylation have been considered probes for CYP2D6 and CYP3A4, respectively. In this study, metabolic patterns of dextromethorphan demethylation for dog CYP2D15 and CYP3A12 were found to be similar to human CYP2D6 and CYP3A4. CYP2D15 was exclusively selective toward the formation of dextrorphan, a product of dextromethorphan O-demethylation (Fig. 3A), and exhibited an activity 7-fold greater than that of any other P450s. Similarly, CYP3A12 was preferentially selective toward the formation of 3-methoxymorphinan, a product of dextromethorphan N-demethylation (Fig. 3A), with an activity 8-fold greater than that of any other P450s. All other enzymes were either less active or inactive in the formation of the two metabolites. In addition, CYP1A1 and CYP3A26 exhibited selectivity in the formation of dextrorphan and 3-methoxymorphinan, respectively, although their activities were much lower than those of CYP2D15 and CYP3A12. DLMs were found to form the two metabolites with comparable activity levels.

Oxidations of some P450 marker substrates by seven recombinant dog P450 isoforms and DLMs: dextromethorphan (50 μM) O-demethylation (dextrorphan) and N-demethylation (3-methoxymorphinan) (A), bufuralol 1′-hydroxylation (B; 3.9 μM), 7-ethoxyresorufin O-deethylation (C; 22 μM), diclofenac 4′-hydroxylation(D; 22 μM), and (S)-mephenytoin 4′-hydroxylation (E; 66 μM).
Incubation mixture (duplicate) contained 0.1 μM for each recombinant enzyme or 1.25 μM total P450 for DLM substrate, each (concentrations as indicated above), and 1 mM NADPH, and was incubated in a water bath at 37°C for 15 min. The products formed were separated and analyzed by LC/MS-MS as described in Table 1 except for 7-ethoxyresorufin O-deethylation, which was measured by fluorescence (see the text). Specific activities of each enzyme for the products formed were expressed as nanomoles of product per minute per nanomole of P450 protein.
Bufuralol 1′-hydroxylation, a marker for human CYP2D6, was also investigated with the comparison of seven dog P450s and DLMs. The specific activities of the enzymes for bufuralol 1′-hydroxylation are shown in Fig. 3B. CYP2D15 exhibited the most activity toward the formation of 1′-OH-bufuralol when compared with the other P450s (8-fold greater than the second most active isoform, CYP2C21). DLMs were also active in the formation of 1′-OH-bufuralol. Thus, CYP2D15 appeared to be a key enzyme for bufuralol 1′-hydroxylation in DLMs.
7-Ethoxyresorufin undergoes O-deethylation to form resorufin, a fluorescent compound, for the detection of metabolic product. Human CYP1A has been shown to catalyze the reaction selectively. The selectivity has been confirmed with dog CYP1A1, which displayed the highest activity (10-fold greater than any other enzymes) in the formation of resorufin (Fig. 3C). In addition, DLMs were competent in 7-ethoxyresorufin catalysis and, therefore, suggest that dog CYP1A1 plays a role in the O-deethylation of 7-ethoxyresorufin in dog liver.
Diclofenac 4′-hydroxylation represents a marker for human CYP2C9. In the incubation of diclofenac with all the individual enzymes tested, CYP2C21 had the highest activity and was 5-fold greater in activity than CYP2B11 and 15-fold greater in activity than the other enzymes (Fig. 3D). We also evaluated the ability of the enzymes to catalyze (S)-mephenytoin 4′-hydroxylation, a marker for human CYP2C19. However, most enzymes either were less active or failed to metabolize the substrate with regard to that of DLMs (Fig. 3E).
Kinetic Properties.Table 3 shows all the kinetic parameters (Km and Vmax) of the seven dog P450s for the substrates studied. All kinetic values were determined by curve fitting using nonlinear regression. Testosterone was metabolized by multiple enzymes (Fig. 1), mainly CYP3A12 (2α/2β-, 16β-, 6β-, and 16α-hydroxylation), CYP2B11 (16α-hydroxylation), and CYP2C21 (16α-hydroxylation). Their Km and Vmax values are listed in Table 3. The three enzymes exhibited different kinetic properties with regard to regio- and stereo-selectivity of the reactions. CYP3A12 had Km values for the above metabolites in a range of 69 to 154 μM, although Vmax (2.2-42 nmol/min/nmol) varied extensively. Km values for CYP3A12 were close to those of DLMs except for 16α-hydroxylation and 2α/2β- hydroxylation, for which DLMs were 5-fold and 2-fold less than CYP3A12, respectively (Table 3). This was due probably to a contribution by CYP2C21 (Km = 6.4 μM and Vmax = 17.3 nmol/min/nmol) to 16α-hydroxylation in DLMs. In overall observations, CYP3A12 appeared to be the main contributor to 2α/2β- and 6β-hydroxylation in DLMs, whereas CYP2C21 plays a major role in 16α-hydroxylation of testosterone.
Km and Vmax values characterizing the metabolism of various P450 substrates in the presence of dog liver microsomes and recombinant dog P450 proteins
In the metabolism of DZ or NDZ, the C3-hydroxylation was catalyzed selectively by CYP3A12. The velocity curves showed sigmoidicity (n ≥ 1.5), suggestive of allosteric effect of the substrates on the enzymes. The Hill equation was employed (eq. 2) to determine Km and Vmax. Km and Vmax values for the oxidation of DZ to TMZ were 41 μM and 12.2 nmol/min/nmol for CYP3A12 (n = 1.6), and 6.4 μM and 6.3 nmol/min/nmol for DLMs (n = 1.5). In the C3-hydroxylation of NDZ to OX, the Km and Vmax values were 192 μM and 1.7 nmol/min/nmol for DLMs (n = 1.5), and 115.4 μM and 10.8 nmol/min/nmol for CYP3A12 (n = 2.3), respectively. With respect to CYP3A12, CYP2B11-catalyzed N1-demethylation of DZ (or TMZ) conformed to typical Michaelis-Menten kinetics (hyperbolic saturation curve). Km and Vmax values for DZ N1-demethylation (NDZ formation) were 5.4 μM and 35.9 nmol/min/nmol for CYP2B11, and 6.4 μM and 6.3 nmol/min/nmol for DLMs, respectively. Km and Vmax for TMZ N1-demethylation (OX formation) were 75.8 μM and 2.7 nmol/min/nmol for DLMs, and 39.6 μM and 18.7 nmol/min/nmol for CYP2B11. In contrast, the Km of DLMs for C3-hydroxylation of DZ was 24-fold greater than that for N1-demethylation, but Vmax values were similar. Clearly, Km values for both reactions of DZ in DLMs were representative of those in CYP3A12 and CYP2B11, respectively.
Km and Vmax values of CYP1A1 for 7-ethoxyresorufin O-deethylation were determined to be 1.0 μM and 3.4 nmol/min/nmol, respectively (Table 3). However, the metabolism of 7-ethoxyresorufin in DLMs indicated the presence of two enzymes, resulting in two pairs of Km and Vmax values by an Eadie-Hofstee plot (Table 3). Km and Vmax for the low-Km enzyme were 0.8 μM and 1.9 nmol/min/nmol, similar to those of CYP1A1. This suggested that a high-Km enzyme was present in DLMs and also responsible for the metabolism of 7-ethoxyresorufin. Other P450s were found to have negligible activities toward the reaction. Thus, CYP1A1 was believed to be the main contributor to the formation of resorufin at lower substrate concentrations in DLMs due to its selectivity and low Km.
CYP2D15 appeared to be the sole enzyme responsible for bufuralol 1′-hydroxylation. The kinetic nature of CYP2D15 was assessed to have a Km (3.9 μM) and Vmax (6.7 nmol/min/nmol) that were similar to those observed in DLMs (3.5 μM and 3.5 nmol/min/nmol). Dextromethorphan O-demethylation is catalyzed solely by CYP3A12 to form 3-methoxymorphinan. At the present concentration (up to 500 μM), saturation velocity curves for the product formation were not achieved (first order kinetics), and therefore, Km and Vmax for CYP3A12 and DLMs were not obtained. This suggested that Km of CYP3A12 for the reaction was very large or not measurable within 500 μM (solubility was limited at 500 μM and above). On the other hand, dextromethorphan N-demethylation was catalyzed exclusively by CYP2D15 to form dextrorphan. Km and Vmax for CYP2D15 were 0.72 μM and 2.6 nmol/min/nmol and for DLMs were 2.3 μM and 4.3 nmol/min/nmol, respectively.
Diclofenac was metabolized predominantly by CYP2C21, and its Km (94 μM) and Vmax (2.7 nmol/min/nmol) were determined. The Km value was similar to that of DLMs (110 μM). CYP2B11 was less capable of metabolizing diclofenac, with respect to CYP2C21, and had both low Km (5.3 μM) and Vmax (0.5 nmol/min/nmol) values (Table 3). Other enzymes were negligible in diclofenac 4′-hydroxylation. Kinetic analysis for another CYP2C substrate, (S)-mephenytoin, was also conducted, and interestingly, none of the enzyme activities, when compared with activity of DLMs, was indicative of the activity found in DLMs. Km and Vmax for DLMs were 60 μM and 2.3 nmol/min/nmol, respectively.
Discussion
Baculovirus-directed expression can easily and reproducibly produce large quantities of full-length, unmodified cDNA-directed expression and catalytically active P450s (Gonzalez et al., 1991; Buters et al.,1995), and has established itself as a powerful and versatile tool for the expression of a variety of heterologous proteins (Crespi and Penman, 1997). The system is based on constructing recombinant baculovirus by replacing the polyhedrin gene with P450 cDNA and using these viruses as vectors for the infection of insect cells. Placing cDNAs of interest under control of the ployhedrin promoter has allowed production at relatively high levels of a large number of useful, biologically active proteins in insect cell cultures. In contrast to rat and human P450s, dog P450s have been studied less extensively with respect to their substrate specificities. However, during the various stages of drug discovery and development, the dog is often used to model drug metabolism and pharmacokinetics in humans. Therefore, there is a need for heterologously expressed dog P450s and a better understanding of their catalytic competency. The available dog P450s allow definition of their substrate specificities. This can serve as a useful fingerprint for the identity and relative contribution of individual P450 forms to the metabolism of a given drug in dog liver or other tissues containing multiple P450s (Eguchi et al., 1996). Accordingly, knowledge of the catalytic activity and substrate specificity of dog P450 enzymes is needed to verify the utility and/or limitation of the dog as a predictive model for drug metabolism and pharmacokinetics in humans.
We next determined the catalytic activities of the recombinant dog P450s toward several xenobiotics that are known to be characteristic substrates of human P450s. An attempt was made to understand whether or not the substrate specificities of dog P450s had patterns similar to those of human. CYP1A1 was isolated in dog liver (Uchida et al., 1990) and was inducible by polychlorinated biphenyl and β-naphthoflavone (Ohta et al., 1990). The present study has shown that CYP1A1 was capable of catalyzing 7-ethoxyresorufin and had Km and Vmax values comparable to those (low-Km enzyme) of DLMs. Since properties of 7-ethoxyresorufin as a substrate of CYP1A2 has not been evaluated, there is no guarantee that CYP1A1 is the sole enzyme responsible for the substrate's metabolism in dog liver, but because of its comparable low Km value, it must play a crucial role in DLMs-catalyzed O-deethylation of 7-ethoxyresorufin at low concentration. Similar substrate specificity between dog and human CYP1A could be due to highly conserved primary structures (sequence similarity = 81% for both CYP1A1 and CYP1A2; Table 4).
Reported Km and Vmax values for various human P450 substrates
Dog CYP2D15, an ortholog of human CYP2D6, has been isolated in liver, the major site of expression (Sakamoto et al., 1995), and expressed in the baculovirus (Roussel et al., 1998). To further characterize and compare CYP2D15 activities to its human counterpart, bufuralol and dextromethorphan were chosen as model substrates. With reference to other dog P450s, CYP2D15 was highly selective toward dextromethorphan O-demethylation. The Km value of CYP2D15 for bufuralol was consistent with, and the value for dextromethorphan was 3-fold less than those in DLMs (Table 3). The activity of dextromethorphan O-demethylase in DLMs was also observed similarly in the previous report (Chauret et al., 1997). The kinetic parameters for CYP2D15 were also reasonably comparable to those for CYP2D6 and HLMs (Table 5), although the values reported in the literature were largely varied. It is anticipated that bufuralol 1′-hydroxylation and dextromethorphan O-demethylation can be used as marker reactions specific to CYP2D15 in dog liver.
Protein sequence homologies between dog and human P450s
CYP2C21 selectively catalyzed testosterone on the 16α-position to form 16α-OH-testosterone, consistent with the reported result (Uchida et al., 1990). This activity was also shown by CYP3A12 and CYP2B11. However, the selectivity could be differentiated from their Vmax/Km (0.03 for CYP3A12, 1.0 for CYP2B11, and 2.7 for CYP2C21). Thus, 16α-hydroxylation of testosterone at low concentration (<10 μM) may be attributed mainly to CYP2C21 and CYP2B11 in dog liver. CYP2C21 also had a large capacity in catalyzing diclofenac 4′-hydroxylation, and its Vmax had a value 5-fold greater than that for CYP2B11. Its Km was similar to that of DLMs but 17-fold higher than that of CYP2B11. Thus, diclofenac 4′-hydroxylation can be attributed to both CYP2C21 and CYP2B11 in DLMs. CYP2C21 for diclofenac hydroxylation may be representative of human CYP2C9, although its Km (94 μM) was 6-fold higher than that of CYP2C9 (Tables 3 and 4). Sequence homology between the two enzymes was conserved by 69% (Table 5). Interestingly, neither of the dog CYP2C21 and CYP2C41 enzymes behaved as human CYP2C19 in 4′-hydroxylation catalysis of (S)-mephenytoin; however, (S)-mephenytoin was metabolized extensively by DLMs. This indicates that there may be another isoform, outside the range of the seven P450s studied here, present in DLMs that is responsible for the metabolism of (S)-mephenytoin.
CYP3A12 and CYP3A26 were first identified by Ciaccio et al. (1991) and Fraser et al. (1997). CYP3A12 was a phenobarbital- and rifampicin-inducible enzyme (Ciaccio and Halpert 1989; Nishibe et al., 1998). Substrate specificity characteristics of CYP3A forms in rat and human are comprised of testosterone 6β-hydroxylation, diazepam 3-hydroxylation and dextromethorphan N-demethylation (Bertilsson et al., 1990; Hanioka et al., 1990; Hooper et al., 1992; Andersson et al., 1994; Yang et al., 1998). The same experimental approaches were utilized to probe the dog CYP3A. Testosterone has been a molecule on which multiple sites can be metabolized to generate P450-selective products. Our study suggested that the 6β-position, known to be catalyzed by the CYP3A subfamily, was one of the predominant pathways of testosterone metabolism in DLMs. Hence, testosterone 6β-hydroxylation can be used as a marker of CYP3A12 in DLMs. The 2α/2β- and 16α-positions were also major sites for metabolism by 3A12. DLMs, in the metabolism of testosterone, showed a metabolic pattern consistent with those of CYP3A12 (Table 3). The kinetic features were also comparable to those observed with CYP3A4 and HLMs, except for Vmax values, which were greater in CYP3A12 and DLMs than in CYP3A4 and HLMs. In addition, CYP3A12 was selective toward C3-hydroxylation of DZ and NDZ. Its kinetic properties were comparable to those observed in DLMs, indicating that CYP3A12 plays a major role in the C3-hydroxylation of DZ and NDZ in dog liver. Similarly, CYP3A12 exclusively catalyzed dextromethorphan N-demethylation to form 3-methoxymorphinan. However, no saturation velocity curve (up to 500 μM) was achieved, suggesting that the Km for CYP3A12 and DLMs would be very large. These observations were also seen in CYP3A4 and HLMs (Table 4). The similarity in enzyme kinetics between dog CYP3A12 and human CYP3A4 could be ascribed to the highly conserved homology in their primary structures (79%).
CYP2B11 was shown to mediate a 16α-hydroxylation of testosterone. However, both CYP2C21 and CYP3A12 shared its regioselectivity. This is consistent with results previously reported (Duignan et al., 1988; Shiraga et al., 1994), which demonstrated that P450 DPB-2 (a form of CYP2C) and DPB-3 (P450 2B11) exhibited high catalytic activities in 16α-hydroxylation of testosterone and progesterone, a major route of oxidative hepatic metabolism of steroids in dog. The catalytic activity of CYP2B11 was responsive to the treatment of phenobarbital both in vitro and in vivo (Nishibe and Hirata, 1993; Shiraga et al., 1994). Most noticeably, CYP2B11 selectively catalyzed N1-demethylation of DZ and TMZ, differing in C3-hydroxylation of DZ and NDZ catalyzed by CYP3A12. Its low Km and high Vmax provide an index of CYP2B11-mediated elimination of DZ in dog. Thus, N1-demethylation of DZ and TMZ would be ideal markers of CYP2B11 in dog liver. Androstenedione 16β-hydroxylation and benzyloxyresorufin O-dealkylation have also been reported to be selective to CYP2B11-enriched dog liver treated with phenobarbital (Duignan et al., 1988; Halpert, 1995; Nishibe et al., 1998). It is concluded that the selectivity of CYP2B11 for these substrates is highly analogous to those of rat and human CYP2B (78% homology) and may be shared with CYP2C (≥50% homology). Therefore, these assays can prove to be a valuable means to probe the presence of CYP2B11 in a tissue containing a pool of multiple P450s.
There is a substantial amount of effort in the area of drug metabolism toward predicting in vivo pharmacokinetic characteristics and extrapolation from animal to human by using in vitro data. Kinetic properties (Km and Vmax) of an enzyme can be used to predict which enzymes may be involved primarily in drug clearance. If drug elimination relies largely on hepatic metabolism or on a particular P450, CLint (Vmax/Km) is regarded as a measure of the enzyme activity within the liver. This CLint can be used for quantitative interpretation and prediction of drug clearance not only in liver (CLH) but also for in vivo pharmacokinetics (i.e., well stirred model or parallel-tube model) (Wilkinson, 1987; Lin and Pearson, 2002). Similar kinetic properties of hepatic enzymes for a drug can also be linked between species for extrapolation because the drug behaves in a similar metabolic manner (i.e., allometric interspecies scaling). Therefore, changes in hepatic CLint are manifest differently in the whole-body pharmacokinetics of a drug, leading to changes in total clearance (CLtotal), half-life (t1/2), and/or oral bioavailability (F).
In conclusion, defining the substrate specificity of individual dog P450s will help elucidate differences in species metabolism and will also assist in establishing predictive in vivo drug interaction models. We have characterized major dog P450s with regard to their specificity to nine substrates and have shown kinetic properties of the major enzymes for the different marker reactions. Generally, CYP3A12, CYP2B11, CYP2D15, CYP2C21, and CYP1A1 had reaction phenotypes similar to those of corresponding rat and human P450s, although kinetic natures of some of the enzymes had a wide range of variance. These isoform-selective reactions can be employed to assess the presence of individual P450 activities in dog tissues, to evaluate drug candidates as inhibitors and inducers of P450s in the metabolism of in vivo and in vitro probe substrates, and to predict drug-drug interactions from dog to human.
Acknowledgments
We thank Drs. Paul Pearson and Tom Baillie for valuable thoughts and discussion.
Footnotes
-
↵1 Abbreviations used are: P450, cytochrome P450; OR, cytochrome P450 oxidoreductase; DZ, diazepam; TMZ, temazepam; NDZ, nordazepam; OX, oxazepam; PCR, polymerase chain reaction; SFM, serum-free medium; Sf21, Spodoptera frugiperda insect cells; MOI, multiplicity of infection; HPLC, high-performance liquid chromatography; LC/MS-MS, liquid chromatography-tandem mass spectrometry; DLM, dog liver microsome; HLM, human liver microsome.
- Received April 2, 2003.
- Accepted May 15, 2003.
- The American Society for Pharmacology and Experimental Therapeutics


