


Abstract
P-glycoprotein (P-gp) and CYP3A have considerable overlap in inducers in vitro. Characterizing P-gp induction in vivo and potential coregulation with CYP3A are important goals for predicting drug interactions. This study examined P-gp expression in mouse tissues and potential coinduction with CYP3A following oral treatment with 1 of 7 prototypical inducing agents for 5 days. P-gp expression in brain or liver was not induced by any treatment as determined by Western blot, whereas dexamethasone, pregnenolone-16α-carbonitrile (PCN), St. John's wort (SJW), and rifampin induced hepatic CYP3A expression. In intestine, rifampin and SJW induced P-gp expression 3.7- and 1.6-fold and CYP3A 3.5- and 2.4-fold, respectively, whereas dexamethasone and PCN induced CYP3A only. These observations suggest that P-gp in mouse small intestine is inducible by some, but not all, CYP3A inducers, whereas P-gp expression in liver or brain is not readily induced. Intriguingly, rifampin and SJW, both activators of the human pregnane X receptor (PXR), induced CYP3A in both liver and intestine but induced P-gp only in intestine, whereas PCN, an activator of murine PXR, did not induce P-gp in any tissue. Rifampin disposition was evaluated, and hepatic exposure to rifampin was comparable to intestine; in contrast, brain concentrations were low. Overall, these observations demonstrate that P-gp induction in vivo is tissue-specific; furthermore, there is a disconnect between P-gp induction and CYP3A induction that is tissue- and inducer-dependent, suggesting that PXR activation alone is insufficient for P-gp induction in vivo. Tissue-specific factors and inducer pharmacokinetic/pharmacodynamic properties may underlie these observations.
Transport proteins can substantially affect drug disposition and pharmacologic effect. Of transporters characterized to date, P-glycoprotein (P-gp) is one of the most important for human therapeutics, based on tissue distribution and the large number of clinically relevant P-gp substrates and modulators (Matheny et al., 2001). Located on the apical membrane of polarized cells in various tissues, P-gp serves to limit substrate absorption into the systemic circulation (e.g., intestine), attenuate access to sites of action (e.g., central nervous system and leukocytes), or mediate elimination from the body (e.g., liver and kidney) (Matheny et al., 2001). For many therapeutic compounds, metabolism by CYP3A and efflux by P-gp seem to play complementary roles in detoxification and elimination, as these two proteins have considerable overlap in substrates and modulators (Wacher et al., 1995; Schuetz et al., 1996a), and functional interplay between metabolism and transport has recently been demonstrated (Cummins et al., 2003; Johnson et al., 2003).
Attenuation of P-gp function, either by genetic manipulation or through use of pharmacologic inhibitors, results in substantial changes in the pharmacokinetics and pharmacodynamics of various substrates (Schinkel et al., 1996; Chen and Pollack, 1999). The importance of P-gp up-regulation in mediating drug interactions also has been recognized; induction of P-gp and/or CYP3A is implicated in reducing systemic concentrations of cyclosporine (Dresser et al., 2003), digoxin (Greiner et al., 1999; Durr et al., 2000), fexofenadine (Dresser et al., 2003), and tacrolimus (Hebert et al., 1999).
Numerous therapeutic agents can induce P-gp expression in cultured cells (Schuetz et al., 1996a; Huang et al., 2001); however, the relevance of these observations to P-gp induction in vivo is not entirely clear. Various factors associated with cell culture, including changes in cellular differentiation, lack of hormones and other cell signaling factors, and absence of host-inducer interactions (e.g., inducer pharmacokinetics and metabolite formation) may lead to different phenomena in vitro compared with in vivo. Given the importance of P-gp and CYP3A in xenobiotic disposition and detoxification, characterizing the induction of P-gp and potential coinduction of CYP3A following inducer treatment in vivo is of considerable importance.
Regulation of P-gp expression is complex and remains incompletely understood, although substantial advances have been made in recent years to understand the mechanisms governing P-gp and CYP3A induction. The human MDR1 promoter region contains a number of putative recognition sites for transcription factors, including activator protein-1, stimulating protein-1, nuclear factor-Y, and CCAAT-enhancer binding protein-β (Labialle et al., 2002). Other processes also may be involved in P-gp up-regulation; for example, increased stability of P-gp mRNA has been demonstrated in regenerating rat liver tumors (Lee et al., 1998). In rodents, two genes, mdr1a and mdr1b, seem to serve the same role as the single human MDR1 gene. Administration of cyclohexamide to rats produced marked increases in the mRNA transcripts of both genes, but apparently by different mechanisms, with mdr1a induction via increased transcription and mdr1b induction through post-transcriptional (e.g., mRNA stabilization) events (Lee, 2001).
The pregnane X receptor (PXR, also termed SXR in humans) is a nuclear receptor that seems to mediate a general protective response against certain xenobiotic challenges via activation of several important detoxification/elimination pathways (Synold et al., 2001; Maglich et al., 2002). Recent studies in cell culture demonstrated that PXR activation is a shared mechanism mediating induction of both P-gp and CYP3A by xenobiotics (Moore et al., 2000a; Geick et al., 2001; Synold et al., 2001). Considerable evidence suggests that PXR is the key mediator of CYP3A induction by xenobiotics in vivo, and there is a strong correlation between PXR activation in vitro and CYP3A induction capability in vivo (Moore et al., 2000b). The relationship between PXR activation in vitro and P-gp induction in vivo is not as well defined. Although in vitro experiments implicate PXR as a mediator of P-gp induction and provide important insight into the molecular mechanisms involved in P-gp regulation, the systems used are a considerable simplification of the situation in vivo, and a necessary progression is to evaluate the relevance of this mechanism in the in vivo setting.
The objective of this study was to characterize P-gp expression and induction in vivo in tissues that play an important role in substrate access to sites of action and/or elimination from the body following pretreatment of mice with prototypical inducers. Tissue specificity of P-gp induction was evaluated by determining P-gp expression in mouse brain, liver, and intestine, and potential coinduction of CYP3A and P-gp was evaluated in liver and intestine.
Materials and Methods
Chemicals. Dexamethasone, nifedipine, pregnenolone-16α-carbonitrile (PCN), and dimethyl sulfoxide (DMSO) were purchased from Sigma-Aldrich (St. Louis, MO). Rifampin and tamoxifen citrate were purchased from Spectrum Chemical (Gardena, CA). Nelfinavir (Viracept tablets) was supplied by Agouron Pharmaceuticals, Inc. (San Diego, CA). St. John's wort extract [Kira tablets (LI 160 formulation)] was supplied by Lichtwer Pharma UK Ltd. (Marlow, UK). Other reagents were purchased from Sigma-Aldrich unless otherwise specified.
Animals. Male FVB mice (25-35 g at the time of experiments) were purchased from Taconic Farms (Germantown, NY). Mice were housed in a temperature- and humidity-controlled room on a 12-h light/dark cycle. Water and food (standard laboratory chow) were provided ad libitum throughout the experiment. The experimental protocol was approved by the Institutional Animal Care and Use Committee of the University of North Carolina at Chapel Hill. Animals were treated in accordance with the Guide for the Care and Use of Laboratory Animals (Institute of Laboratory Animal Resources, Commission on Life Sciences, National Research Council, Washington, DC, 1996).
Treatments. Mice (n = 6 per group) were treated for 5 days with 1 of 7 prototypical P-gp inducers or corresponding vehicle control (0.01 ml/g). Inducing agents were selected based on clinical relevance and previous data from in vitro or in vivo studies demonstrating PXR activation (Table 1) and/or P-gp induction potential. The treatments were dexamethasone (10 mg/kg), PCN (150 mg/kg), tamoxifen (35 mg/kg), or corn oil (vehicle control); nelfinavir (225 mg/kg), nifedipine (50 mg/kg), St. John's wort extract (1000 and 1250 mg/kg), or water (vehicle control); and rifampin (250 mg/kg) or DMSO (50%, vehicle control) by once- or twice-daily (nelfinavir and St. John's wort, 1250 mg/kg) oral gavage. The oral route was selected to mimic typical use of these agents with the exception of PCN, which is not used therapeutically in humans. Although it is possible that systemic concentrations were too low following oral administration to elicit P-gp induction in tissues other than the gastrointestinal tract, this is unlikely because all of the agents used (except PCN) are administered orally in clinical practice, and most have moderate-to-high oral bioavailability (Table 1).
Analysis of P-gp and CYP3A Expression. Approximately 24 h after the last treatment dose, mice were sacrificed, and brain (minus cerebellum), liver, and small intestine were harvested. This time point was selected to allow time for maximal induction to evolve following the final dose, since protein induction is assumed to be the result of multiple steps in most instances (e.g., transcriptional activation, protein synthesis, and post-translational processing). For small intestine, approximately the first 4 inches (duodenum and first section of jejunum) were excised and perfused with ∼10 ml of ice-cold saline to remove food contents. The segment was cut lengthwise (4°C), and the intestinal lining was removed by scraping. Tissues were placed immediately in cryotubes, snap-frozen in liquid nitrogen, and stored at -80°C until analysis.
In preparation for Western blot analysis, tissues were homogenized on ice in 15 volumes of Tris-HCl buffer (0.01 M, pH 7.4) containing protease inhibitors leupeptin (10 μg/ml), pepstatin A (1 μg/ml), and phenylmethylsulfonyl fluoride (50 μg/ml) using a Tissue-Tearor homogenizer (30,000 rpm, 30-45 s; BioSpec Products, Inc., Bartlesville, OK). The homogenate was centrifuged at 4,000g for 10 min (4°C), the pellet was discarded, and the supernatant was centrifuged at 100,000g for 30 min (4°C). The resulting pellet was suspended in 7.5 volumes of Tris-HCl buffer with protease inhibitors by brief homogenization (30,000 rpm, ∼20 s) and stored at -80°C until analysis. Protein concentrations were determined in triplicate using bicinchoninic acid protein assay (Pierce, Rockford, IL) with bovine serum albumin as the standard.
Samples were normalized to equal protein concentrations, loaded (7-15 μg/lane, depending on tissue) onto 4 to 12% NuPAGE Bis-Tris precast gels (Invitrogen, Carlsbad, CA), electrophoresed at 170 V for 1.5 h, and transferred onto polyvinylidene difluoride membranes at 30 V for 1 h. Blots were blocked for nonspecific binding by overnight incubation (4°C) on a rotator in Tris-buffered saline buffer containing 0.03% Tween 20 and 5% dry milk. P-gp and actin were detected simultaneously with the anti-P-gp antibody Ab-1 (1:2000; Calbiochem, San Diego, CA) and anti-actin antibody (1:20,000; Chemicon International, Temecula, CA) by overnight incubation (4°C) on a rotator followed by horseradish peroxidase-linked anti-rabbit IgG (1:5000; Amersham Biosciences UK, Ltd., Little Chalfont, Buckinghamshire, UK) or anti-mouse IgG (1:20,000; Amersham Biosciences UK Ltd.) for 1 h (25°C). Following development, blots were stripped with Restore Western blot stripping buffer (Pierce) for 30 min (25°C). CYP3A expression in liver and intestine was detected with rabbit polyclonal anti-rat CYP3A1/2 antibody (1:5000; Xeno-Tech, Lenexa, KA) for 1 h (25°C) followed by horseradish peroxidase-linked anti-rabbit IgG (1:7500) for 1 h (25°C). All blots were developed using West Dura substrate (Pierce), and bands were detected by chemiluminescence on a VersaDoc Imaging System (model 1000; Bio-Rad, Hercules CA). Band intensity was quantified by densitometric analysis with Quantity One software (version 4.3; Bio-Rad). In some blots, membranes prepared from the human leukemic cell line K562, grown in doxorubicin (1 μM), were used as a positive control for P-gp and negative control for CYP3A expression. These cells were a generous gift from Dr. Lanier Ayscue (Department of Pathology and Laboratory Medicine, University of North Carolina at Chapel Hill).
Disposition of Rifampin. In a separate experiment, rifampin concentrations were determined in plasma and target tissues (intestine, liver, and brain). A preliminary experiment was performed to determine the time of maximal concentration (Cmax) in plasma following oral administration, which was approximately 2 h. Mice were administered rifampin (250 mg/kg) by oral gavage and sacrificed by decapitation at 2 and 24 h following a single dose or chronic administration (once daily for 5 days, n = 4 per time point). Trunk blood, brain (minus cerebellum), liver, and the first 3 inches of small intestine were harvested. Blood was centrifuged (10,000g for 5 min), and plasma was obtained. Plasma and tissues were placed immediately in cryotubes, snapfrozen in liquid nitrogen, and stored at -80°C until analysis. During processing, blood and plasma were kept in the dark or in light-impermeable microfuge tubes due to rifampin light sensitivity.
Quantitation of Rifampin. Rifampin concentrations in plasma and tissues were determined by capillary high-performance liquid chromatography with a single-quadruple mass spectrometer and electrospray ionization source (1100 Series; Agilent Technologies, Palo Alto, CA). Briefly, tissues were homogenized in 5 volumes of saline containing ascorbic acid (200 μg/ml). Internal standard [flunitrazepam (5 μl, 10 μg/ml)] was added to plasma (20 μl) or tissue homogenate (40 μl), and analytes were extracted into chloroform (500 μl). The organic phase was removed and evaporated under a nitrogen stream; the residue was reconstituted with acetonitrile (100 μl) and centrifuged (14,000g for 5 min). The supernatant (1 μl) was injected onto the column. Mass detection was performed in positive ion mode using mass scanning (to detect potential rifampin metabolites) or selected ion monitoring for rifampin (m/z 823.1) and flunitrazepam (m/z 314.2). The mobile phase consisted of acetonitrile/ammonium acetate (32:68 v/v, 30 mM, pH 4.0) delivered at a flow rate of 300 μl/min, and chromatographic separation was achieved on a Luna C8 column (Phenomenex, Torrance, CA; 100 mm × 2 mm, 4-μm particle size) at 30°C. Retention times for rifampin and flunitrazepam were 5.3 and 7.4 min, respectively. Chemstate software (version A.09.03; Agilent Technologies) was used for data acquisition and processing. Rifampin concentrations in brain tissue were corrected for contamination from blood, assuming a blood volume of 13 μl/g brain tissue (Dagenais et al., 2000).
Calibration curves were linear in the range of 0.2 to 50 μg/ml (or micrograms per gram of tissue; r2 > 0.999). Samples with rifampin concentrations exceeding this range were diluted as necessary. The limit of quantitation was ≤0.2 μg/ml (or micrograms per gram) for all matrices. Precisions in the range of 3.2 to 8.7% (CV) and 3.5 to 7.5% and accuracies in the range of -4.6 to 1.3% and -5.2 to 0.8% were obtained in intra- and interday validation studies, respectively, for all matrices.
Data Analysis. P-gp, CYP3A, and actin bands were identified based on apparent molecular weight and use of positive and negative control samples. Densitometric intensity was determined for each P-gp and CYP3A band. Potential P-gp and CYP3A induction was evaluated for each treatment by taking the average densitometric intensity of the bands from the active treatment group divided by the control treatment average (n = 6 per group, all determined from a single blot). Actin densitometric intensity was determined for each sample to verify equal total protein loading but was not used for normalization of P-gp or CYP3A densitometric intensities. Validation tests were performed by Western blot using serial dilutions of a sample known to have induced CYP3A and P-gp expression (mouse intestine homogenate following rifampin treatment) to verify linearity of the densitometric signal relative to input amount. Approximate linearity (r2 = 0.98) was present over a wide (e.g., 8-fold) range of dilutions (data not shown), which encompassed the range of induction observed (e.g., <4-fold). Statistical significance was determined using Student's t test comparing active treatment to the corresponding vehicle control, with p < 0.05 set as the criterion for statistical significance.
Results
P-gp was detected as a ∼170-kDa band in Western blots of brain, liver, and intestinal homogenates. CYP3A was detected as a single band in liver, and typically a double band in intestine, at the expected molecular weight (∼55 kDa). These bands may represent more than one mouse CYP3A isoform; previous work has shown that the PCN- and rifampin-inducible isoforms in mouse liver are Cyp3a11 and Cyp3a13 (based on mRNA analysis), with Cyp3a11 predominating due to expression that is several fold higher (Yanagimoto et al., 1997). Similar to human CYP3A4, Cyp3a11 induction in mice is PXR-mediated (Staudinger et al., 2001); thus, it is likely that Cyp3a11 is a major isoform contributing to the CYP3A protein signal detected in the present experiments. CYP3A expression was not detectable in brain tissue by Western blot (data not shown).
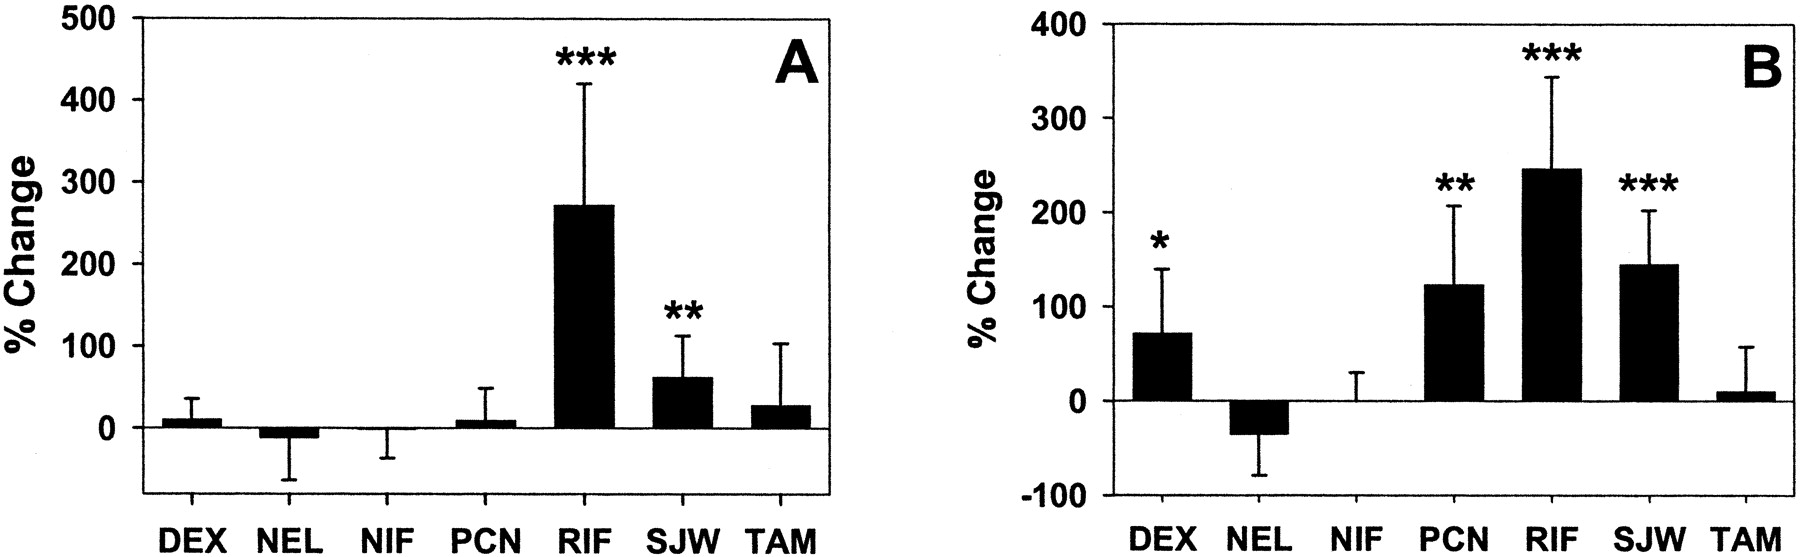
P-gp expression in brain (Fig. 1) and liver (Fig. 2A) was not induced by any of the treatments examined. In contrast, compared with corresponding control treatments, dexamethasone, PCN, rifampin, and St. John's wort induced hepatic CYP3A expression 8.9 ± 2.3, 2.5 ± 0.8, 3.5 ± 1.1, and 2.3 ± 0.7-fold, respectively (p < 0.05; Fig. 2B). Of note, rifampin seemed to increase total protein content of mouse liver (∼20% higher per gram of tissue based on protein concentration determination). These samples were diluted ∼20% prior to Western blot analysis to compensate for the higher total protein content. As a consequence, expression of hepatic actin was ∼20% lower in livers from rifampin-pretreated mice (data not shown). P-gp expression in mouse liver was not increased by rifampin treatment with or without correction for the lower actin densitometric signal.

P-gp expression in mouse brain following inducer treatment. Mice were treated for 5 days with prototypical P-gp inducers or vehicle control, and P-gp expression in brain homogenate was determined by densitometric analysis of Western blots. Data are expressed as percentage of change relative to vehicle treatment (mean percentage of change ± S.D. of ratio). DEX, dexamethasone; NEL, nelfinavir; NIF, nifedipine; RIF, rifampin; SJW, St. John's wort; TAM, tamoxifen.

P-gp (A) and CYP3A (B) expression in mouse liver following inducer treatment. Mice were treated for 5 days with prototypical P-gp inducers or vehicle control, and P-gp expression in liver homogenate was determined by densitometric analysis of Western blots. Data are expressed as percentage of change relative to vehicle treatment (mean percentage of change ± S.D. of ratio). **, p < 0.01 and ***, p < 0.001 (treatment versus vehicle).
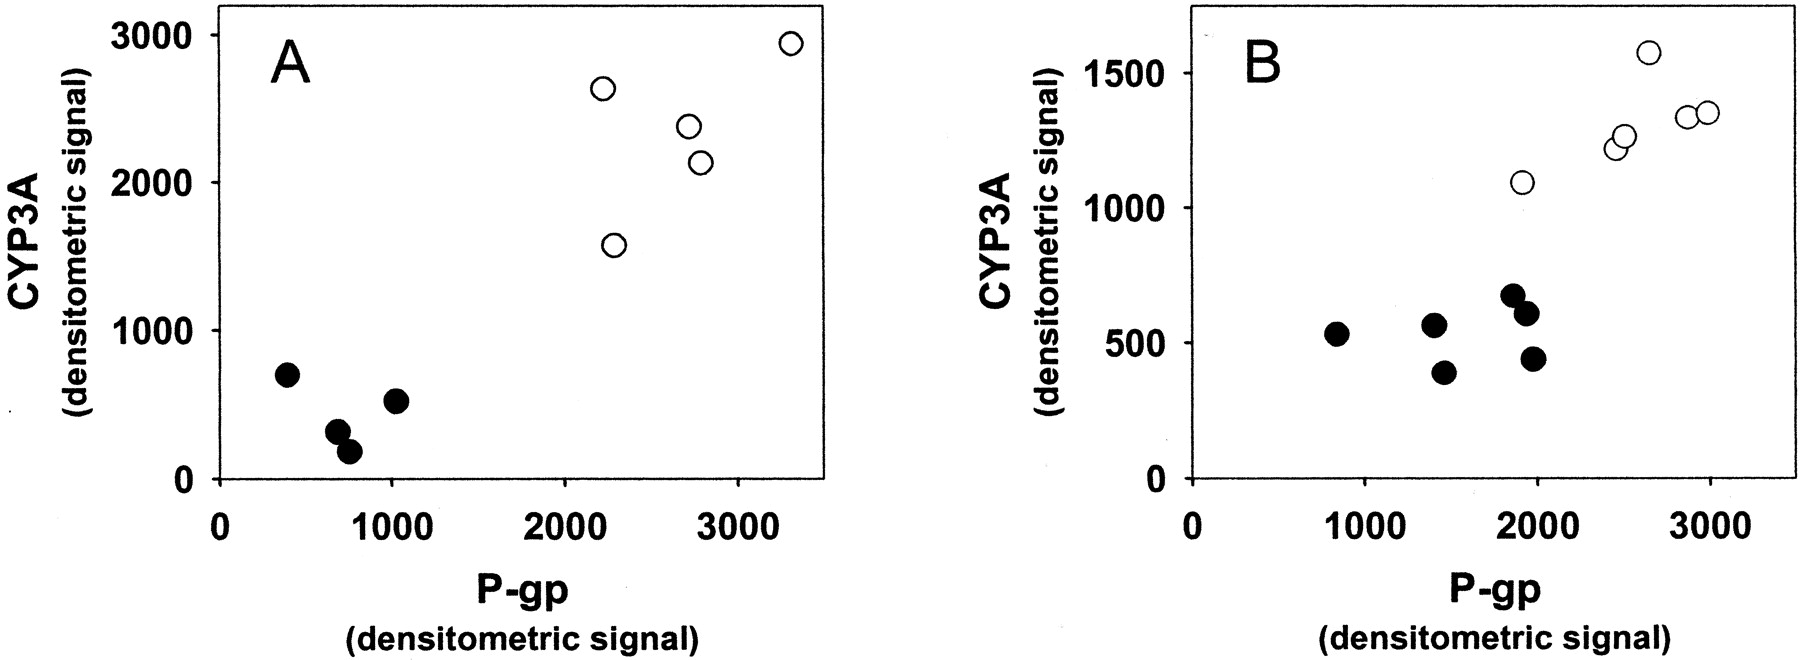
In small intestine, P-gp expression was induced 3.7 ± 1.5 and 1.6 ± 0.5-fold, and CYP3A 3.5 ± 1.0 and 2.4 ± 0.6-fold, by rifampin and St. John's wort, respectively (p < 0.05; Fig. 3, A and B). The comparison of P-gp versus CYP3A densitometric intensity from individual mice treated with rifampin, St. John's wort, or corresponding vehicle is shown in Fig. 4. These data demonstrate the coordinate induction of CYP3A and P-gp by both agents in mouse intestine. In contrast to rifampin and St. John's wort, dexamethasone and PCN did not alter intestinal P-gp expression (Fig. 3A), despite induction of intestinal CYP3A (1.7 ± 0.7 and 2.2 ± 0.8-fold, respectively; p < 0.05). Representative Western blots from brain, liver, and intestinal tissue following treatment with rifampin or vehicle are shown in Fig. 5, highlighting the tissue specificity of P-gp induction and coordinate regulation of P-gp and CYP3A in intestine, but not in liver, following rifampin treatment.
P-gp (A) and CYP3A (B) expression in mouse small intestine following inducer treatment. Mice were treated for 5 days with prototypical P-gp inducers or vehicle control, and P-gp expression in small intestinal lining homogenate was determined by densitometric analysis of Western blots. Data are expressed as percentage of change relative to vehicle treatment (mean percentage of change ± S.D. of ratio). *, p < 0.05; **, p < 0.01; and ***, p < 0.001 (treatment versus vehicle).

P-gp and CYP3A expression in small intestine. Shown is the expression of P-gp and CYP3A in individual mice as determined by Western blot of small intestinal lining homogenate after treatment with (A) rifampin (250 mg/kg/day; ○), (B) St. John's wort (1000 mg/kg/day; ○), or corresponding vehicle control (•).

Representative Western blots from rifampin/vehicle treatment. Mice were treated for 5 days with rifampin (250 mg/kg/day) or vehicle (50% DMSO) by oral gavage. Shown are Western blots of brain (A), liver (B), or small intestine (C) samples from individual mice. R, rifampin; V, vehicle; C, control (untreated brain); K, K562 grown in doxorubicin (positive control for P-gp).
Since the induction of intestinal P-gp and CYP3A was modest following St. John's wort at 1000 mg/kg/day, and the dose necessary to elicit P-gp induction in mice was previously unknown, a second St. John's wort treatment was undertaken to assess whether a higher dose (1250 mg/kg twice daily) would produce substantial induction. At the higher dose, intestinal P-gp and CYP3A were induced 3.1 ± 1.0 and 3.7 ± 1.3-fold, respectively (p < 0.05), consistent with a positive dose-response relationship over the range studied.
As previously stated, intestinal P-gp expression was sensitive to induction, but P-gp expression in brain or liver was not induced by any agent examined. Since P-gp induction is presumed to be concentration-dependent, these observations could result from differences in organ exposure to the inducing agent. Rifampin was 1 of 2 effective inducers of P-gp expression in small intestine; therefore, a separate experiment was performed to determine the concentrations of rifampin in target tissues and to assess the potential role of inducer disposition on tissue-specific P-gp induction. Following single-dose oral administration (250 mg/kg), rifampin concentrations were ∼1.7-fold higher in intestinal tissue compared with liver at the time of the Cmax in plasma (2 h). In contrast, at 24 h postdose, liver concentrations exceeded those in intestinal tissue by ∼4.8-fold, and concentrations in both tissues exceeded that in plasma. A similar pattern was observed following chronic daily rifampin administration (Table 2). These data also confirmed that substantial rifampin was still present 24 h after a dose in liver and intestine. No rifampin metabolites were detected in plasma or tissue samples. Concentrations of rifampin in brain were low (Table 2); the maximum observed concentration in brain (10.5 ± 1.4 μg/g, day 5, 2-h time point) was only 7.3 and 2.7% of corresponding concentrations in liver and intestine, respectively. Thus, compared with liver, intestinal exposure to rifampin following oral administration is greater during drug absorption, but in the postabsorption phase (and presumably after achievement of distributional equilibrium), hepatic concentrations exceed those in both intestinal tissue and plasma.
Rifampin concentrations in plasma and target tissues
Mice (n = 4 per time point) were treated with 250 mg/kg rifampin by oral gavage with a single dose (day 1) or with chronic daily administration (day 5). Rifampin concentrations in plasma and tissues (mean ± S.D.) were determined by high-performance liquid chromatography/mass spectometry.
Discussion
Induction of drug metabolism is a central mechanism underlying many drug interactions and potentially can limit therapeutic efficacy or enhance toxicity. CYP3A is one of the most important inducible metabolic pathways, as ∼50% of marketed drugs are CYP3A4 substrates in humans (Pelkonen et al., 1998). Recently, the importance of transporter modulation in drug interactions has been recognized (Matheny et al., 2001). P-gp has a broad substrate specificity that overlaps considerably with CYP3A (Wacher et al., 1995). Thus, for some compounds, metabolism by CYP3A and efflux by P-gp may act in concert to decrease bioavailability and increase clearance (Cummins et al., 2003; Johnson et al., 2003). In addition to overlap in substrates, Schuetz et al. (1996a) described considerable overlap in agents capable of inducing CYP3A and P-gp expression in cell culture. Potential coordinate regulation of the two proteins has been observed (Schuetz et al., 1996a; Durr et al., 2000; Dresser et al., 2003). The present study documents this phenomenon in mouse liver and intestine following chronic treatment with a range of putative inducing agents. Furthermore, the potential for induction of P-gp in the central nervous system (CNS) following inducer treatment was evaluated, providing a comprehensive assessment of the tissue specificity of P-gp induction in organs important to substrate disposition and pharmacologic effect.
P-gp regulation and potential induction in the brain has not been well characterized previously. In the current study, brain P-gp expression was not altered substantially following treatment with any of the seven agents examined. It is noteworthy that PXR, one mediator of P-gp induction, is not expressed in brain (Kliewer et al., 1998). This could explain, at least in part, the observed lack of P-gp induction in brain tissue by agents that activate PXR (Table 1) and raises the question of whether P-gp expressed in the CNS is inducible to any extent; however, the absence of PXR in brain tissue does not preclude alternative induction mechanisms. Previously, this laboratory has shown modest (∼50%) induction of P-gp expression in mouse brain following chronic rifampin administration (Zong and Pollack, 2003); however, the strain of mouse (CF-1) and route of rifampin administration (i.p.) used differed from the current study. It is possible that a higher rifampin dose may have elicited brain P-gp induction in the present study; unfortunately, attempts to administer doses >250 mg/kg chronically were toxic to the mice. Chronic morphine or dexamethasone treatment induced rat brain P-gp expression ∼2- and ∼1.5-fold, respectively (Aquilante et al., 2000), although in the current and previous (Zong and Pollack, 2003) studies of mice, significant brain P-gp induction was not observed by either agent. Other agents that did not alter rodent brain P-gp expression include phenobarbital, phenytoin (Seegers et al., 2002), cisplatin (Demeule et al., 1999), and cyclosporine (Jette et al., 1996).
The ability of therapeutic agents to induce P-gp in the CNS remains unclear, although these data suggest that P-gp expression in brain is not readily induced. Access of the inducing agent to the CNS may play a role in these observations. For agents that are P-gp substrates, the expression of P-gp in the blood-brain barrier may prevent sufficient accumulation of the inducing agent inside the capillary endothelial cells, presumably the site of action for inductive effects (Lin, 2003). This mechanism could explain the lack of P-gp induction in brain by tamoxifen, dexamethasone, and rifampin, which are known or putative P-gp substrates (Schuetz et al., 1996b), and is supported by the observation that brain concentrations of rifampin were very low compared with other tissues and plasma (Table 2).
In liver, a disconnect between CYP3A and P-gp regulation was observed, since dexamethasone, PCN, rifampin, and St. John's wort all elicited robust induction of hepatic CYP3A, yet no agent was associated with hepatic P-gp induction. The observation of CYP3A induction in liver clearly demonstrates that pharmacologically active concentrations were achieved for these agents in liver. In vitro, all four agents activate mouse and/or human PXR (Table 1). In cultured human hepatocytes, coordinate induction of MDR1 and CYP3A4 mRNA has been demonstrated following treatment with PXR activators (Maglich et al., 2002). Similarly, in mice, hepatic expression of mdr1a, mdr1b, and Cyp3a11 mRNA was coordinately induced following treatment with PCN; this induction was PXR-dependent (Maglich et al., 2002). Thus, the present observations are somewhat surprising, although not without precedent.
Salphati and Benet (1998) examined potential coregulation of P-gp and CYP3A in rat liver following CYP3A inducer treatments. Dexamethasone, PCN, and triacetyloleandomycin induced CYP3A, but no agent induced hepatic P-gp based on mRNA analysis. Similarly, Huang et al. (2001) observed induction of CYP3A, but not P-gp, in rat liver following oral nelfinavir treatment. Brady et al. (2002) evaluated expression of mdr1a and mdr1b mRNA in rat tissues following pretreatment with microsomal enzyme inducers from six different pharmacologic classes, including PXR activators. No single pharmacologic class consistently induced mdr1a or mdr1b in rat liver.
The present data demonstrate independent regulation of mouse hepatic CYP3A and P-gp expression, despite the existence of a common regulatory mechanism (PXR) in liver (Kliewer et al., 1998). It is possible that other regulatory factors may be involved in enhancing the hepatic CYP3A response or repressing the P-gp response. For example, hepatocyte nuclear factor 4α has been shown to enhance CYP3A induction mediated by PXR activation (Tirona et al., 2003). The role of hepatocyte nuclear factor 4α in mediating P-gp induction is presently unknown.
In contrast to liver, coordinate induction of CYP3A and P-gp was observed in small intestine following rifampin or St. John's wort treatment. Activation of PXR may be responsible for these observations, since PXR is highly expressed in intestine (Kliewer et al., 1998). However, the lack of P-gp induction in intestine following PCN or dexamethasone, which activate mouse PXR and induced intestinal CYP3A, suggests that additional factors are involved in P-gp regulation in mouse intestine in vivo.
The induction of P-gp in small intestine by rifampin and St. John's wort is particularly intriguing considering the absence of P-gp induction by these agents in liver. Two general mechanisms may play a role in these observations. Intestine-specific induction may result from high regional concentrations of the inducing agent after oral administration. This mechanism could be important for agents with poor oral absorption or high first-pass loss, provided that (in light of the present results) the hepatic response to CYP3A induction occurs at lower concentrations or shorter duration of exposure compared with hepatic P-gp induction. Tissue concentrations of rifampin, a compound that induced intestinal but not hepatic P-gp expression, were evaluated following oral administration. Hepatic rifampin concentrations were moderately lower than intestinal concentrations at 2 h, although by 24 h postdose, liver concentrations were 1.8- to 4.8-fold higher than corresponding intestinal tissue concentrations, suggesting that the overall rifampin exposure (e.g., over a 24-h interval) in intestine and liver may be comparable. The Cmax in plasma (∼160 μg/ml) was ∼10-fold higher than the Cmax in humans following therapeutic doses (Rifadin prescribing information; Aventis, Strasbourg, France, 1999), indicating that lack of P-gp induction by rifampin in tissues other than intestine was not due to low systemic exposure. Another possibility is that the intestine contains factors other than PXR that facilitate P-gp induction by rifampin or St. John's wort, or that the liver and brain express suppressor factor(s) preventing induction. This scenario seems plausible given the number of factors known to be involved in transporter regulation and recent demonstration of overlap in nuclear receptor (e.g., constitutive androstane receptor and PXR) control of transporter genes (Maglich et al., 2002).
Identifying preclinical animal models that behave similarly to humans in terms of metabolism and transporter induction is an important goal. The present study suggests that the mouse is a suitable model to study the pharmacokinetic/pharmacodynamic consequences of concomitant induction of CYP3A and P-gp in the intestine through use of either rifampin or St. John's wort pretreatment. Although higher doses (on a milligram per kilogram basis) were used compared with that in humans, there was good agreement in the magnitude of P-gp and CYP3A induction between mice and humans. Mouse small intestinal P-gp induction ranged from 1.6- to 3.7-fold, and induction of CYP3A ranged from 2.4- to 3.5-fold following St. John's wort or rifampin, respectively. In humans, rifampin induced human duodenal P-gp 3.5-fold and CYP3A 4.4-fold (Greiner et al., 1999). Similarly, administration of St. John's wort induced human intestinal P-gp 1.4-fold and CYP3A4 1.5-fold (Durr et al., 2000). In contrast to the mouse, St. John's wort administration induces rat intestinal P-gp but not CYP3A (Durr et al., 2000). Thus, the mouse behaves more similarly to humans following St. John's wort and presumably rifampin, which does not readily induce rat CYP3A (Salphati and Benet, 1998).
In conclusion, these data provide insight into the complexity of P-gp induction in vivo and suggest that activation of PXR alone is insufficient to induce P-gp expression in vivo in mouse liver and intestine (e.g., PCN and dexamethasone did not induce P-gp in any tissue examined), despite evidence that PXR activation in vitro induces P-gp and CYP3A. These results also demonstrate tissue specificity of P-gp induction and coinduction of intestinal CYP3A and P-gp by rifampin and St. John's wort. Finally, the mouse may be a useful preclinical model to study the pharmacokinetic/pharmacodynamic consequences of concomitant P-gp and CYP3A intestinal induction following pretreatment with rifampin or St. John's wort.
Footnotes
-
This study was supported by Grant GM61191 from the National Institutes of Health and an American Foundation for Pharmaceutical Education Fellowship (to C.J.M.) and was presented in part at the American Association of Pharmaceutical Scientists Annual Meeting, 2002 Nov 10-14 (Toronto, Ontario, Canada).
-
ABBREVIATIONS: P-gp, P-glycoprotein; PXR, pregnane X receptor; PCN, pregnenolone-16α-carbonitrile; DMSO, dimethyl sulfoxide; CNS, central nervous system.
- Received January 23, 2004.
- Accepted June 15, 2004.
- The American Society for Pharmacology and Experimental Therapeutics


