


Abstract
Sixty-one sets of clearance (CL) values in animal species were allometrically scaled for predicting human clearance. Unbound fractions (fu) of drug in plasma in rats and humans were obtained from the literature. A model was developed to predict human CL: CL = 33.35 ml/min × (a/Rfu)0.770, where Rfu is the fu ratio between rats and humans and a is the coefficient obtained from allometric scaling. The new model was compared with simple allometric scaling and the “rule of exponents” (ROE). Results indicated that the new model provided better predictability for human values of CL than did ROE. It is especially significant that for the first time the proposed model improves the prediction of CL for drugs illustrating large vertical allometry.
Allometric scaling is widely used in predicting human clearance (CL) based on animal data. Since prediction errors are commonly observed in the practical application of this approach, various modifications to allometric scaling have been proposed. These modifications include in vitro metabolic data (Lave et al., 1997), correction by either maximum life-span potential (MLP) or brain weight (BrW) (Mahmood and Balian, 1996b), the “rule of exponents” (ROE) (Mahmood and Balian, 1996a), and scaling unbound CL (Feng et al., 2000). Correction by in vitro metabolic data was successful in predicting human CL of 10 extensively metabolized drugs (Lave et al., 1997). Based on a data analysis of 16 drugs, however, Mahmood (2002) concluded that the use of in vitro data obtained from liver microsomes to predict hepatic CL in humans did not provide reliable predictions. In addition, in vitro metabolic corrections cannot be applied to compounds eliminated by excretion. Scaling unbound CL across animal species improved the prediction for certain compounds (Feng et al., 2000); however, it failed to predict well for a few compounds with large vertical allometry such as diazepam and valproate. Recently, Mahmood (2000) suggested that unbound CL cannot be predicted any better than total clearance. Corrections either with MLP or BrW have been shown to be inappropriate if they are used indiscriminately, which led to the idea of ROE. This rule provides selection criteria for use of MLP or BrW, based on the values of the exponents obtained from simple allometry (Mahmood and Balian, 1996a). Although ROE has been shown to improve the prediction significantly compared with simple allometry, this method is still not satisfactory in predicting large vertical allometry. More recent studies (Nagilla and Ward, 2004) found that the corrections using MLP or BrW or the rule of exponents in allometric scaling did not result in significant improvements in predictions of human CL. Furthermore, they proposed that the monkey liver blood flow approach was superior to the rule of exponents. This controversy is currently not resolved (Mahmood, 2005; Nagilla and Ward, 2005).
The coefficients (a) of the power function have been considered important in determining the magnitude of CL, because the exponents (b) have been shown to be relatively constant, with a typical value close to 0.75 (Boxenbaum, 1982). Based upon analysis of more than 60 drugs, we have observed that the water-octanol partition coefficient (log P) and the ratio of unbound fraction (fu) in plasma between rats and humans (Rfu) may provide simple rules for anticipating the occurrence of large vertical allometry. Based upon these findings, therefore, we attempted to develop a new model for predicting human CL.
Materials and Methods
A literature search was performed to obtain animal data for allometric scaling of systemic CL (CL used in this article refers to systemic CL) and fu ratio in rats and humans. Only data sets including at least three animal species were used for scaling. Coefficients and exponents were obtained by fitting body weight and CL, CL × MLP, or CL × BrW on a log-log scale according to the allometric equation: CL or CL × MLP or CL × BrW = a× Wb. CL in humans was calculated by using the coefficients and exponents obtained and human body weight reported, or by assuming 70 kg (if weight was not reported in the publication). MLP was calculated by using MLP = 10.839 · W0.636 · BrW–0.225 (Boxenbaum, 1982). The rule of exponents was applied as described by Mahmood and Balian (1996a): 1) if the exponent from simple allometry is between 0.55 and 0.70, simple allometry is applied; 2) if the exponent is between 0.70 and 1.0, CL × MLP approach is applied; 3) if the exponent is greater than 1.0, CL × BrW approach is applied; 4) if the exponent is less than 0.50, simple allometry is applied since none of the approaches could improve the prediction. Predictability was assessed by percentage error (PE), which is [(CLpred – CLobs)/CLobs] × 100% for over-prediction and, [(CLobs – CLpred)/CLpred] × 100% for under-prediction. A power model is proposed,  and transformed into
  where Pi is the variable for a, b, Rfu, or eClogP (exponential values of water-octanol-water partition coefficient, ClogP). The transformed model was screened by a backward step-wise procedure (P value entrance criterion at 0.1 and P value removal criteria at 0.2) to obtain parameters of statistical significance (Intercooled Stata 7.0, Stata Corporation, College Station, TX).
Results
The interest and rationale for developing a new allometric model equation was based on our previous findings that Rfu, combined with ClogP, could be used to formulate rules to predict qualitatively the occurrence of large vertical allometry in predicting human CL (Tang and Mayersohn, 2005, in press). The current study was undertaken to create and test a model in which parameters such as Rfu and ClogP, as well as coefficient a and exponent b from simple allometry, could potentially be useful to quantitatively predict human CL. ClogP was removed from the model since it did not add any statistical improvement. Coefficient a, exponent b, and Rfu were found to be statistically significant with P values of <0.001, <0.05, and <0.001, respectively. The model equation incorporating these three variables was:  The exponential value of b (0.71) is close to that of a (0.82) and Rfu (0.70). b is relatively constant and varies over a much narrower range (∼ 0.35–1.20) than a (0.31–200) or Rfu (0.33–20); therefore, b was not considered to be an important variable. Thus, a and Rfu were used as the only variables to redevelop the model, which resulted in the simplified eq. 4,
  which retained an R2 of 0.81, indicating that the three-variable model does not improve the prediction performance. Values for CL increase with a, indicating that the coefficient a from simple allometry is a primary determinant of CL. In contrast, CL decreases when Rfu increases due to the negative power of Rfu. This inverse relationship makes sense in that a higher value for fu in animals compared with humans may lead to an over-prediction of CL by simple allometry. The inverse functional relationship between fu and CL predicted in humans, therefore, may correct the over-predictions caused by significant differences in fu between animals and humans.
The exponents of a and Rfu have very similar absolute values. Changing –0.71 to –0.77 for the exponent of the fu ratio only slightly affects CL. For example, an Rfu of 10 raised to the power –0.71 is 0.19, whereas 10 raised to the power –0.77 is 0.17. Most fu ratios are smaller than 10; therefore, the equation was further simplified to  The term, a/Rfu, could be referred as an “fu-corrected a.” The predictability of CL estimations for eq. 5, as well as for simple allometry and ROE, are given in Table 1. The significant improvement in prediction performance by the proposed model, compared with ROE, could be judged from three perspectives.
Comparison of predictability of human clearance obtained from simple allometry, the new model equations, and the rule of exponents
The order of drugs is arranged according to the ascending values of exponent b obtained from simple allometry.
First, the average absolute values of percentage error by eq. 5, ROE, and simple allometry were 78%, 185%, and 323%, respectively. The significant improvement in prediction by the new model is apparent.
Second, using the new model (e.g., eq. 5), only six compounds had percentage errors over 200%, with 548% for diazepam and 200 to 300% for the other five. In contrast, 11 compounds using the ROE method had prediction percentage errors greater than 200%, with 2100% for GV150526A, 1626% for diazepam, 1485% for tamsulosin, and 200 to 1000% for the other eight compounds (Table 2). Therefore, the new model predicted the large vertical allometry with greater success compared with ROE.
A summary of outliers for predictions of human clearance (PEs greater than 200%) based on simple allometry, new model equation, and rule of exponents
Comparisons of the predictability of human CL from simple allometry with the new model (eq. 5) and ROE may be visualized in Fig. 1 and Fig. 2. The dashed line in the graphs represents a 200% error range. Simple allometry results in substantial over-prediction of human CL for many compounds (especially those with low CL). The ROE method considerably reduces that error, whereas it still retains a few large over-predictions and leads to biased under-predictions. The under-predictions by the ROE method are primarily the result of applying MLP or BrW corrections to compounds having allometric exponents greater than 0.70. In contrast, the new model equation proposed here results in more accurate predictions of human CL and a more random pattern of errors.
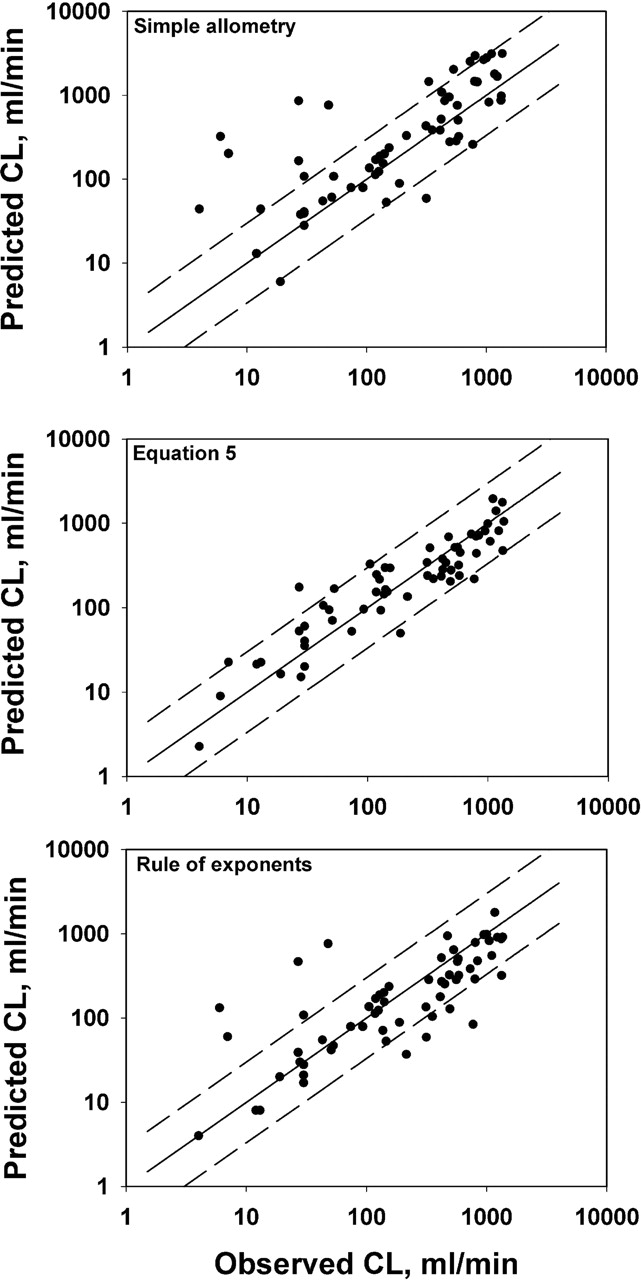
Predicted human clearance as a function of observed human clearance. Predicted values are based upon simple allometry (top), the new model equation derived here (eq. 5; middle) and the rule of exponents (bottom). The solid lines are the lines of identity and the dashed lines represent a range associated with 200% error.

Percentage error in prediction of human clearance as a function of observed human clearance. Percentage errors are from predictions based upon simple allometry (top), the new model eq. 5 (middle), and the rule of exponents (bottom). The inset plots are limited to 400% error, which encompasses most of the error range. The solid lines indicate 0% error. The dashed lines indicate the range associated with 200% error. Symbols: simple allometric slope values less than 0.7 (circle), less than 0.7–1.0 (triangle), or greater than 1.0 (rectangle).

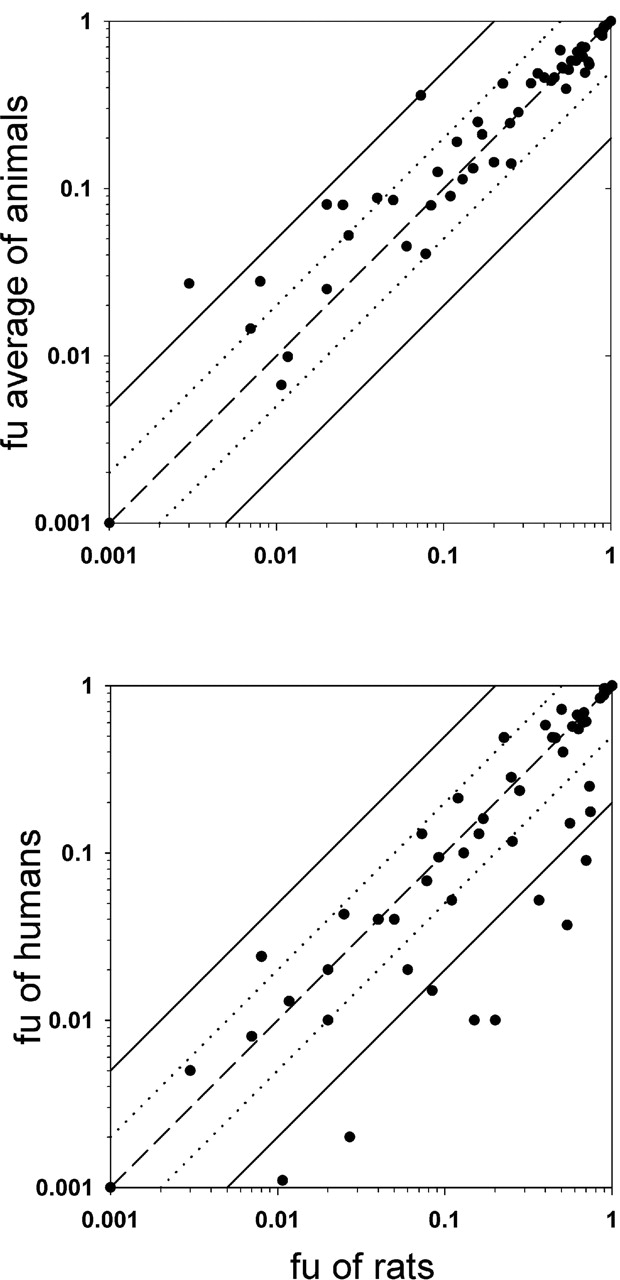
Unbound fraction of drug in plasma (fu) for the average in all animal species (top) and in humans (bottom) as a function of fu in rats for 61 compounds. The average fu values in animals are based on at least two animal species including rats. The solid lines indicate the lines of 5-fold or 0.2-fold. The dotted lines indicate the lines of 2-fold or 0.5-fold. The dashed lines indicate the lines of identity.
Discussion
The use of fu ratio between rats and humans, rather than between all animals and humans, was based on our observation that the fu in rats is representative of the average fu in animals (Fig.3). In contrast, many significant differences between fu in rats and fu in humans were observed (Fig. 3). One question could be raised concerning why scaling by the unbound CL approach did not provide stable and good predictability, because it appears that correcting CL by fu in each animal species would be more favorable than just considering only rats and humans. One possible explanation could be attributed to the serious error underlying data fitting to the power function (Smith, 1984) and the considerable measurement error of fu, especially for highly plasma-bound compounds. When three or more animal species are included for scaling unbound CL, the same number of fu variables with errors is also introduced into the data fitting, and may generate greater error in predicting human values than what is generated from the error noted in only one species, the rat, in the new proposed model. Here is an example to visualize this concept. Suppose three species, mouse (0.03 kg), rat (0.25 kg), and dog (15 kg), are used for allometric scaling of unbound CL. The final predicted CL in humans by allometry can be expressed as:  where A is a function of CL observed in each animal species and the body weight of animals (derivation under Appendix). The new model can be expressed as:
  where B is not equal to A, but is also a function of CL observed in each animal species and the body weight of animals. It is obvious that the correction of fu in each species incorporates more variance by introducing more fu variables compared with both simple allometry and the new model.
Certainly, the new model is empirical, just as are all of the other approaches. No solid physiological or biochemical basis could be offered at this time. The model proposed here does not consider many other potential types of useful information such as in vitro metabolic differences across species, which may account for deviations in predictions. Therefore, the empirical model that has been proposed should be expected, in practice, to result in errors in prediction, such as when a significant metabolic/elimination difference is seen across the species examined. Nevertheless, the new model was shown to be simple, reasonable, and more predictive than the currently available approaches. In particular, the new model significantly improves for the first time the prediction of the occurrence of large vertical allometry noted in humans.
In summary, a novel and simple model, incorporating a and the fu ratio between rats and humans, has been proposed and shown to provide a better predictability than the currently available allometric techniques in estimating values of CL in humans. Most important, it significantly improves the prediction of large vertical allometry.2
Appendix: Derivation of Equation 5
Part I: Derivation of the Function Relating Predicted PK Parameters in Humans (Ppredicted) to Animal Body Weights (W) and Observed Animal PK Parameters (Pi)
The log-log transformation of P = a · Wb gives  Let
Let  Then, eq. A1 can be simplified to
  Suppose n different animal species are used for allometric scaling. Therefore, there are n sets of (X, Y) data to fit using linear regression. Based on the method of least squares for linear regression, α and β can be calculated as
 Substituting Y = log P, X = log W into eqs. A3 and A4, and further substituting α and β into a = 10α, b = β, expressions of a and b are obtained as
 where
where 
 By assuming a human body weight of 70 kg, the predicted P in humans is obtained from
  where Ppredicted is the predicted PK parameter in humans and Pi is the measured PK parameter in an animal species,
 where W is the animal body weight.
Part II: Derivation of Equation 5 Based on Equation A9
Based on eq. A9, predicted human CL (CLpredicted) using simple allometry from a combination of animals such as the mouse (0.03 kg), rat (0.25 kg), and dog (15 kg) gives  Since
Since  scaling of unbound CL can be done by substituting CLu for CL, resulting in
  Therefore, CL predicted in humans by scaling unbound CL can be obtained,
  where A is the CL value predicted in humans using simple allometry and is equal to
  By substituting a from eq. A5, the new model equation (eq. 5 in text) is
  and can be expressed as
  That is,
  where
where 
Acknowledgments
We thank Dr. Harold Boxenbaum for useful suggestions in the development of the new model equations, and Drs. Stacey Tannenbaum (Novartis Pharmaceutical Co.) and Iftekkar Mahmood (U.S. Food and Drug Administration) for providing part of the allometric data used in the analyses.
Footnotes
-
↵2 The proposed model (eq. 5) was tested using one example of large vertical allometry (reboxetine), whose data were available to the authors during the revision of the manuscript. We predicted an Rfu greater than 5 for reboxetine. The data kindly provided by one of the reviewers (courtesy of Pfizer, Inc.) showed fu values of 0.17 and 0.02 in rats and humans, respectively, which translate to an Rfu of 8.5. Prediction of human CL based upon eq. 5 resulted in a PE of 104%, compared with 1395% and 804% based upon simple allometry and the ROE method, respectively.
-
This work was presented at the American Association of Pharmaceutical Scientists Annual Meeting, Salt Lake City, Utah, October 26, 2003.
-
Article, publication date, and citation information can be found at http://dmd.aspetjournals.org.
-
doi:10.1124/dmd.105.004143.
-
ABBREVIATIONS: CL, clearance; Rfu, ratio of unbound fraction in plasma between rats and humans; MLP, maximum life-span potential; BrW, brain weight; ROE, rule of exponents; PE, percentage error; GV150526A, sodium 4,6-dichloro-3-[(E)-3-(N-phenyl)propenamide]indole-2-carboxylate; PK, pharmacokinetic.
-
↵1 Current address: Bioanalytical Department, Wyeth Research, Pearl River, New York.
- Received February 9, 2005.
- Accepted June 2, 2005.
- The American Society for Pharmacology and Experimental Therapeutics


