


Abstract
In the 2012 Food and Drug Administration (FDA) draft guidance on drug-drug interactions (DDIs), a new molecular entity that inhibits P-glycoprotein (P-gp) may need a clinical DDI study with a P-gp substrate such as digoxin when the maximum concentration of inhibitor at steady state divided by IC50 ([I1]/IC50) is ≥0.1 or concentration of inhibitor based on highest approved dose dissolved in 250 ml divide by IC50 ([I2]/IC50) is ≥10. In this article, refined criteria are presented, determined by receiver operating characteristic analysis, using IC50 values generated by 23 laboratories. P-gp probe substrates were digoxin for polarized cell-lines and N-methyl quinidine or vinblastine for P-gp overexpressed vesicles. Inhibition of probe substrate transport was evaluated using 15 known P-gp inhibitors. Importantly, the criteria derived in this article take into account variability in IC50 values. Moreover, they are statistically derived based on the highest degree of accuracy in predicting true positive and true negative digoxin DDI results. The refined criteria of [I1]/IC50 ≥ 0.03 and [I2]/IC50 ≥ 45 and FDA criteria were applied to a test set of 101 in vitro-in vivo digoxin DDI pairs collated from the literature. The number of false negatives (none predicted but DDI observed) were similar, 10 and 12%, whereas the number of false positives (DDI predicted but not observed) substantially decreased from 51 to 40%, relative to the FDA criteria. On the basis of estimated overall variability in IC50 values, a theoretical 95% confidence interval calculation was developed for single laboratory IC50 values, translating into a range of [I1]/IC50 and [I2]/IC50 values. The extent by which this range falls above the criteria is a measure of risk associated with the decision, attributable to variability in IC50 values.
Introduction
Digoxin is a widely prescribed medicine to treat heart failure and atrial fibrillation (The Digitalis Investigation Group, 1997; Wyse et al., 2002). Digoxin has a narrow therapeutic range, and toxic effects may occur when plasma levels are elevated (e.g., ≥2 ng/ml). Plasma concentrations of digoxin have been shown to increase in the presence of concomitantly administered drugs such as quinidine, verapamil, or itraconazole (Muller and Fromm, 2011). Concomitant administration of drugs associated with P-glycoprotein (P-gp) inhibition act to increase intestinal absorption or decrease biliary and renal elimination of digoxin, resulting in elevated digoxin plasma levels (Benet et al., 1999; Greiner et al., 1999; Kusuhara and Sugiyama, 2002; Susanto and Benet, 2002; Chan et al., 2004). Many pharmaceutical companies currently perform an in vitro P-gp inhibition study to assess the risk of a clinically significant P-gp-mediated drug-drug interaction (DDI) between a candidate drug and digoxin. The decision to perform a clinical digoxin DDI study is based on decision criteria published in the Food and Drug Administration (FDA) draft guidance on DDIs. A clinical drug interaction study with digoxin is warranted if [I1]/IC50 ≥ 0.1 or [I2]/IC50 ≥ 10, where [I1] represents the maximum blood/plasma concentration of inhibitor at steady state, [I2] represents the concentration of inhibitor in the gastrointestinal tract based on highest approved dose dissolved in 250 ml, and IC50 represents the concentration of inhibitor resulting in 50% inhibition of in vitro P-gp mediated transport (http://www.fda.gov/Drugs/GuidanceComplianceRegulatoryInformation/Guidances/ucm064982.htm). This, however, does not take into account potential laboratory-to-laboratory or system-to-system variability in the IC50 measurement (Bentz et al., 2013).
The companion article (Bentz et al., 2013) evaluated and characterized the interaction of drugs with human P-gp in various cell lines and expression systems routinely employed across the pharmaceutical industry (Burton et al., 1993; Anderle et al., 1998; Gao et al., 2001; Hooiveld et al., 2002; Giacomini et al., 2010). A total of 23 laboratories determined IC50 values for 15 inhibitors where each laboratory used their in-house established experimental system (cell lines or P-gp overexpressing membrane vesicles). Substantial laboratory-to-laboratory variability was observed, indicating that the current universal decision criteria applied to a single laboratory IC50 value might not be optimal.
It was recently demonstrated that digoxin is not a P-gp specific probe substrate but is also a substrate of uptake transporters (Bentz et al., 2005; Kimoto et al., 2011; Taub et al., 2011). These uptake transporters may be present in the experimental systems used to measure IC50 values. Acharya et al. (2008) provided kinetic evidence of an apical and basolateral digoxin uptake transporter in Madin-Darby canine kidney (MDCK)II-multidrug resistance protein (MDR1) and Caco-2 cells (A. Lumen and J. Bentz, personal communication), whereas Taub et al. (2011) demonstrated active sodium-dependent digoxin uptake in a human embryonic kidney cell line. The in vitro IC50 values determined in the currently used cell lines with digoxin as a probe substrate may therefore not be entirely attributable to inhibition of P-gp, but may represent inhibition of both P-gp and an uptake transporter. The current FDA P-gp decision tree recommends digoxin as a probe substrate of P-gp and does not account for interaction of digoxin and inhibitors with other potential transporters. This should be kept in mind when extrapolating either in vitro “P-gp” inhibition data or in vivo digoxin clinical DDI data to other P-gp substrates.
This article describes the application of receiver operating characteristic (ROC) analysis as a statistical tool to generate improved decision criteria for assessment of a drug candidate’s propensity to increase digoxin clinical exposure. The ROC analysis was used to derive refined decision criteria that incorporated in vitro P-gp IC50 values determined by 23 laboratories, thereby accounting for IC50 variability. The refined ROC derived decision criteria were then assessed using a test set consisting of in vitro P-gp IC50 values and in vivo digoxin DDI data obtained from literature publications.
The primary objectives of the work herein were to (1) refine the current P-gp DDI decision tree criteria by using a large data set of P-gp IC50 values generated by 23 laboratories for 15 compounds for which clinical digoxin DDI data were available and (2) apply the ROC-derived criteria to a test set of 101 in vitro-in vivo pairs to characterize the rate of false negatives (FNs) and false positives (FPs) and to compare the FN and FP results to those generated for the FDA proposed criteria. Furthermore, because the decision criteria were developed specifically for digoxin and digoxin may not be a P-gp specific probe substrate, it is proposed herein that the “P-gp” decision tree be referred to as a “digoxin” decision tree.
Materials and Methods
Chemicals and Reagents.
Fifteen drugs for which in vivo interaction data with digoxin are available (amiodarone, carvedilol, diltiazem, felodipine, isradipine, mibefradil, nicardipine, nifedipine, nitrendipine, quinidine, ranolazine, sertraline, telmisartan, troglitazone, verapamil) were obtained from Sigma-Aldrich (St. Louis, MO). Other chemicals and reagents were obtained by each participating laboratory from local commercial sources. For details on the cell lines, cell culture procedures, membrane vesicles, bidirectional transport assays across polarized cell monolayers, and the vesicle uptake assays, the reader is referred to the companion article (Bentz et al., 2013).
P-gp Inhibition Experiments Using Polarized Cell Lines or Vesicles.
Bidirectional transport assays across polarized cell monolayers were conducted as described in Bentz et al. (2013). Briefly, basolateral-to-apical (B≥A) and apical-to basolateral (A≥B) transport of the P-gp probe substrate digoxin across polarized Caco-2, Lilly Laboratories Cells - Porcine Kidney Nr. 1 cells transfected with MDR1 cDNA (LLC-PK1)-MDR1, or MDCKII-MDR1 cell monolayers were assessed in the absence and presence of six increasing concentrations of the inhibitors listed above. A positive control inhibitor was included in each assay at a single concentration. Assay buffer containing digoxin and inhibitor (if applicable) was added to the donor compartment, and assay buffer containing inhibitor (if applicable) was added to the receiver compartment. Monolayers were then incubated at 37°C for 45 to 180 minutes, at which samples were taken from both donor and receiver compartments. Digoxin concentrations in each sample were determined by scintillation counting or liquid chromatography-tandem mass spectrometry. P-gp inhibition studies using membrane vesicles are also described in Bentz et al. (2013). Briefly, P-gp dependent uptake of either N-methylquinidine or vinblastine into P-gp overexpressing vesicles was assessed in the absence and presence of seven increasing concentrations of the inhibitors listed above. The reaction mixtures without ATP or in the presence of AMP-PNP (nonhydrolyzable analog of ATP) were used as a negative ATP control (no ATP-dependent transport activity). The reaction mixtures were incubated at 37°C for 2 to 3 minutes. The reaction was then stopped by addition of ice-cold sucrose buffer, and vesicles were collected onto a filter plate. The substrate concentration in each sample was determined by either scintillation counting or liquid chromatography-tandem mass spectrometry. Digoxin was not used as a P-gp probe substrate in vesicles because of a low signal-to-background ratio potentially attributable to binding of digoxin to the extracellular domain of the Na+/K+-ATPase (the pharmacological target for digoxin) in P-gp overexpressing membrane vesicles.
IC50 Calculations.
Only IC50 values obtained with probe substrate transport in the B-to-A direction across polarized cell monolayers or into P-gp overexpressing membrane vesicles were used in the ROC analysis. The IC50 values were fitted with the logistic equation using a two parameter fit with lower and upper bounds constrained to no inhibition and complete inhibition, respectively (Lyles et al., 2008; Bentz et al., 2013): (1)where A([I1]) is the transport activity measured when the inhibitor concentration is [I1]; A(∞) is remaining transport activity when P-gp is completely inhibited by the positive control inhibitor, e.g., GF120918 (N-(4-(2-(6,7-dimethoxy-3,4-dihydroisoquinolin-2(1H)-yl)ethyl)phenyl)-5-methoxy-9-oxo-9,10-dihydroacridine-4-carboxamide hydrochloride) or, in membrane vesicles, represents uptake activity in the absence of ATP or presence of AMP-PNP; A(0) is the transport activity measured in absence of inhibitor (the negative control); IC50 is the inhibitor concentration at which [A(0)-A(∞)]/2; β is slope factor or Hill coefficient.
Establishment of Decision Criteria by ROC Analysis.
The objective is to establish [I1]/IC50 and [I2]/IC50 binary classification or decision criteria to predict a binary outcome of the clinical digoxin pharmacokinetic (PK) ratio [area under the curve (AUC) or Cmax ratio] in the presence and absence of inhibitor. The optimal discrimination criteria corresponds to the lowest classification error, i.e., the lowest combined probability of false positive and false negative predictions. A positive clinical outcome occurs when the PK ratio is 1.25 or greater and a negative outcome occurs when the PK ratio is <1.25. A positive prediction (a clinical digoxin DDI will occur) is made when [I1]/IC50 ≥ c1 or [I2]/IC50 ≥ c2, where c1 and c2 represent the discrimination criteria for [I1]/IC50 and [I2]/IC50. The prediction obtained from the [I1]/IC50 and [I2]/IC50 discrimination criteria can then be compared with the true in vivo outcome and a 2 × 2 table constructed to estimate the accuracy of the prediction and select the optimal values of c1 and c2 as shown in Table 1.
Receiver operating characteristic definition
The TP, FP, FN, and TN are the number of true positives, false positives, false negatives, and true negatives, respectively. The total number of positive predictions (P) and the total number of negative predictions (N) are also listed in Table 1. The true positive rate (TPR) is defined as TP/P, and the false positive rate (FPR) is defined as FP/N. The TP and FP are then calculated for a wide range of possible combinations of c1 and c2, with c1 ranging from 0.0001 to 0.1 and c2 from 1 to 1000. The value for the combination of c1 and c2 is then selected based on the highest accuracy (TP+TN)/(P+N) achieved. A ROC curve can then be drawn by plotting the TPR (sensitivity) against the FPR (1-specificity) (Fig. 1). A ROC curve with a higher AUC′ value (area under the ROC curve) is preferred over a curve with a lower value, an AUC′ value of 1 representing perfect predictability, and a value of 0.5 indicates no predictability. Therefore the AUC′ value is also a measure of discrimination or the likelihood that the criteria ([I1]/IC50 ≥ c1 or [I2]/IC50 ≥ c2) correctly classifies the DDI as being clinically significant.

Receiver operating characteristic curve incorporating all company data. The sensitivity on the x-axis represents the TPR, whereas 1-specificity on the y-axis represents the FPR, where the specificity is the TNR.
This ROC analysis was performed using IC50 values from each of the four experimental systems (Caco-2, LLC-PK1-MDR1, MDCKII-MDR1, and P-gp overexpressing vesicles) combined. The IC50 values can be found in Supplemental Table 4.
The ROC derived criteria of ([I1]/IC50 ≥ c1 and [I2]/IC50 ≥ c2) were optimized together based on the highest degree of accuracy in predicting TP and TN to obtain new criteria. All analysis was conducted in SAS V9.2 (SAS Institute Inc., Cary, NC).
Assembling Digoxin DDI Set to Test the Decision Criteria: The Test Set.
The refined ROC derived decision criteria were tested with an assembled test set consisting of in vitro P-gp IC50 values and in vivo digoxin DDI data obtained from literature publications. This P-gp inhibitor test set was distinct from the 15 inhibitors used to generate the refined ROC decision criteria described above. Clinical digoxin DDI studies and in vitro IC50 values for perpetrators were collected by searching the Drug Interaction Database (University of Washington) and PubMed. Perpetrators with both clinical digoxin DDI and IC50 values were collated and paired. If more than two in vitro IC50 values were reported, the lowest and highest values were selected to avoid overpopulating the database with a single perpetrator. Among the in vitro perpetrators, 22 had two IC50 values and 25 had only one value. The AUC and Cmax ratios were extracted from 70 clinical DDI studies. In total, 101 pairs of [I1]/IC50 and [I2]/IC50 versus clinical AUC or Cmax ratios were created to form the data set.
95% Confidence Interval Determination for Single IC50 Values.
Typically, a single laboratory will determine an IC50 value for a drug candidate using a single experimental system. In all likelihood, if that IC50 was measured in several different laboratories, substantially different IC50 values might be generated. Therefore the authors have developed a 95% confidence interval calculations for individual IC50 values to determine the range of plausible IC50 values based on the variance in IC50 values observed in the companion article (Bentz et al., 2013).
The estimate of an IC50 value does not follow a normal distribution. However, an approximate 95% confidence interval for the true population IC50 can be determined by first considering the natural logarithm (ln) of the estimated IC50. The S.D. of ln IC50 is then approximated by the total variance found in the IC50 values in the companion article and the 95% confidence interval for the ln IC50 of a new drug candidate determined in a single laboratory can be defined as:
 (2)
(2)The S.D. of ln IC50 (S.D.[ln IC50]) is the square root of the total variance based on all IC50 values reported in the companion article (Bentz et al., 2013), which is 1.08. This value represents the S.D. of the typical variability seen in generating IC50 values regardless of the protocol, system, or laboratory.
The 95% confidence intervals were calculated for several individual compounds from the test set to determine the range of plausible IC50 values. For example, the ln IC50 for maraviroc is 5.21 [ln(183)] and the S.D. of ln IC50 is 1.08. To obtain the 95% confidence interval for the IC50 of maraviroc, the antilog of the upper and lower limits are determined. The 95% confidence interval for the population of IC50 values for maraviroc is expressed as exp3.09 to exp7.32. The mean IC50 for maraviroc is likely to range from 22 to 1521. This interval gives a wide range of possible values for the IC50 because of the large variability in IC50 measurements. This range in IC50 values can then be used to calculate the range of possible [I1]/IC50 and [I2]/IC50 values. The extent by which this range falls above the decision criteria is a measure of risk associated with the decision attributable to IC50 variability. The risk is expressed as a P value (see below) and describes the probability that the decision criteria would be exceeded and a DDI study indicated if the IC50 was measured in any other laboratory or system.
Determination of p Value.
The p value describes the risk or probability (p), that for a given IC50 value determined in a single laboratory, the cutoff criteria may be exceeded based on consideration of the range in possible IC50 values. This risk is equal to the fraction of the confidence interval range of lnIC50 values resulting in (I1 or I2)/IC50 above the cutoff criteria (normal cumulative distribution) and can be calculated using the following formula in R version 2.15.2 (statistical software package):

where “cutoff” is the (I1 or I2)/(IC50) cutoff derived either by the ROC method or the original FDA value, the I1, I2, and IC50 are the values for the inhibitor of interest, and 1.08 is the overall S.D. for lnIC50 described above. The value returned is the cumulative probability and will be between 0 (low risk) and 1 (high risk).
A value for p can similarly be calculated in Microsoft Excel using the statistical “NORMDIST” function, which returns the normal cumulative distribution for a parameter X, using a specified mean and S.D.. As an example, consider the I1 of 1.7 µM for maraviroc and the ROC cutoff for I1/IC50 of 0.03, such that the ln(I1/cutoff) for maraviroc equals 4.037. This value equals the lnIC50 at which the I1/IC50 cutoff criterion for maraviroc is reached. This is the parameter X for which to calculate the cumulative probability (normal cumulative distribution) that the I1/IC50 value for maravoric determined in a single laboratory falls above the decision criterion, when taking into account the possible range in maraviroc IC50 values attributable to overall IC50 variability. So the mean in the NORMDIST function is the lnIC50 for maraviroc (5.21) and the S.D. equals 1.08. Finally, 1 should be entered as the last value in the formula to return the cumulative distribution. The formula should appear as such: ‘=NORMDIST(4.037,5.21,1.08,1).’ This calculation returns a value of 0.14 for p. In general, a P value less than 0.3 could be considered to indicate low risk and greater than 0.7 to indicate high risk of a transporter-mediated DDI when incorporating variability in a single laboratory IC50 measurement.
Results
Clinical Digoxin Data for the Receiver Operating Characteristic Training Set.
Table 2 shows a summary of human digoxin pharmacokinetic DDI data collected from the literature for the 15 drugs used to investigate in vitro P-gp IC50 variability. The clinical digoxin DDI studies considered were those in which digoxin was dosed orally on multiple days alone and in the presence of the concomitant drug. Studies in which digoxin was administered intravenously and case studies were excluded. For some perpetrators, several clinical digoxin DDI data sets were available because studies were conducted by different investigators. All clinical study results were incorporated in our analysis. For the ROC analysis, the authors chose the PK parameter (AUC or Cmax) that exhibited the greater increase in digoxin exposure in the presence of the perpetrator; this is denoted as the combined PK ratio. Several perpetrator drugs such as carvedilol, diltiazem, and felodopine resulted in both positive and negative digoxin drug interactions, i.e., changes in digoxin plasma exposure were less than or greater than the clinical threshold value of 1.25.
Clinical digoxin DDI studies
Receiver Operating Characteristic Analysis.
The purpose of this analysis is to determine the optimal discrimination threshold for [I1]/IC50 or [I2]/IC50 that corresponds to the lowest classification error, where the classification error is the combined probability of false positive and false negative predictions of the digoxin DDI and greatest accuracy, the highest number of TP and TN. The [I1] represents the total maximum systemic concentration of the inhibitor at steady state, and [I2] is the concentration achieved when the highest approved dose is dissolved in 250 ml. Use of the unbound concentration for I1 did not add any further discriminatory power toward TP, FN, FP, and FN. The largest and most robust data set of IC50 values were used in this analysis, i.e., those values obtained from inhibition of probe substrate transport in the B≥A direction and fitted using the logistic equation for cell-based studies and uptake for P-gp over-expressing vesicles (values found in Supplemental Table 1). The data set consists of 293 IC50 values generated for 15 inhibitors by 23 pharmaceutical laboratories and includes cell-based and vesicle-based values. The ROC analysis determined the combined criteria for [I1]/IC50 and [I2]/IC50 as 0.03 and 45, respectively, which resulted in the lowest classification error and greatest accuracy. The accuracy was 74%. The percent FPs and FNs were 26 and 27%, respectively.
For the reader’s interest, separate ROC analyses were also performed for each of the individual systems: Caco-2, MDCKII-MDR1, LLC-PK1-MDR1, and P-gp overexpressing vesicles and several individual laboratories that obtained 13 or more IC50 values (Supplemental Figs. 1, A–D, and 2, A–C; Supplemental Table 2).
Application of ROC-Derived and FDA Criteria to a Digoxin DDI Test Set.
The digoxin DDI data were collected using the University of Washington Metabolism & Transport Drug Interaction Database and PubMed. The clinical digoxin DDI studies selected were based on oral administration and included single and multiple dose digoxin regimens and single and multiple dose inhibitor administrations, while intravenous digoxin administration studies and case study reports were excluded. A total of 101 pairs of in vitro P-gp IC50 values and associated in vivo digoxin PK changes were created as described in the Materials and Methods. This set includes 47 unique perpetrators, while the 15 inhibitors from the training set were excluded. The 101 pairs are listed in Supplemental Table 3. Digoxin is the main in vitro probe substrate with several studies utilizing calcein AM. Cook et al. (2010) demonstrated an in vitro correlation between digoxin and calcein AM. These data were then used to generate the TPR, TNR, FPR, and FNR using both the ROC derived and the FDA proposed criteria (Table 3). The accuracy for the ROC and FDA criteria was 73 and 69%, respectively. The FPR was 40 and 51% for the ROC and FDA criteria, respectively. The ROC and FDA cut-off values resulted in a FNR of 12 and 10%, respectively. The FNR and FPR in the training set are different from the test set because the training set consists of multiple, highly variable in vitro IC50 values for each of the 15 perpetrator compounds. For most perpetrator drugs in the test set only one IC50 value could be found in the scientific literature.
Application of in vitro criteria to a test set of in vitro IC50 values paired with clinical DDI data
Digoxin DDI data set contains 101 pairs of in vitro IC50 data and clinical DDI data.
As shown in Table 4, the compounds that triggered a FN by both the ROC and FDA criteria are conivaptan, cimetidine, and talinolol (2 separate studies). AZD5672 (N-(1-{(3R)-3-(3,5-difluorophenyl)-3-[4-methanesulfonylphenyl]propyl}piperidin-4-yl)-N-ethyl-2-[4-methanesulfonylphenyl]acetamide) and flecainide were FN by the ROC criteria only and ambrisentan by the FDA criteria only. The ROC and FDA criteria resulted in a common set of 12 compounds triggering a FP result, while the FDA criteria resulted in an additional six FP [sparfloxacin, maraviroc, rofecoxib, levofloxacin, aliskiren (two separate studies), and dabigatran etexilate]. For omeprazole and pantoprazole, two clinical digoxin studies for each were reported in which the ROC criteria predicted FP for both cases, while the FDA predicted correctly one of the two cases (see Supplemental Table 3). For both ritonavir and talinolol, each had one clinical digoxin DDI evaluation indicating no drug interaction, while the other studies demonstrated a clinical drug interaction with PK change greater than 25% (see Supplemental Table 3). ROC derived criteria for the individual systems (Caco-2, MDCKII-MDR1, and P-gp overexpressing vesicles) were also applied to the 101 digoxin in vitro and in vivo test set; however, as expected, the ROC derived criteria when all in vitro systems data were incorporated performed better (see Supplemental Table 4).
False negative and false positive compounds using FDA and ROC criteria values
IC50 Variability-Based Risk Score (p) for [I1]/IC50 and [I2]/IC50 Based on Single Laboratory IC50 Measurements.
For the inhibitors in the test set, little is known about their laboratory-to-laboratory IC50 variability, and this will typically be the case for the IC50 value of a drug candidate as well. The authors suggest that more confidence in a single IC50-based risk assessment could be obtained by assigning a risk score to the single laboratory [I1]/IC50 and [I2]/IC50 values, which is the probability that for a given IC50 value determined in a single laboratory, the cutoff criteria may be exceeded based on consideration of the range in possible IC50 values. This risk score can be generated based on the variance model utilizing all in vitro systems IC50 values in the training set, generated by the 23 laboratories for the 15 inhibitors (see Materials and Methods). The p values calculated for several FN and TN compounds identified by ROC-derived criteria are shown in Table 5. Conivaptan (ROC FN based on single IC50 value) showed a high p value of 0.69 for [I1]/IC50 and a low p value of 0.11 for [I2]/IC50 associated with not performing a clinical digoxin DDI, which would indicate a clinical digoxin DDI study is warranted based on IC50 variability. For sparfloxacin, maraviroc, and aliskiren, both [I1]/IC50 and [I2]/IC50 showed low p values associated with not performing a clinical interaction study even when taking into account IC50 variability, consistent with the clinical observation. For flecainide, the p value was 0.4 and 0.46 for [I1]/IC50 and [I2]/IC50, respectively, which is higher than that for sparfloxacin, maraviroc, and aliskiren. In reality, flecainide does show a clinically significant PK change of 1.36. Montelukast showed a high [I1]/IC50 risk of 0.89 that would likely trigger a clinical digoxin DDI study based on risk associated with IC50 variability, but in reality no clinical interaction is observed. Although not 100% predictive, the risk score does provide additional information to support decisions on whether to run a clinical digoxin study, because the inherent variability in the IC50 values is taken into account. Moreover, the decision to conduct the clinical digoxin DDI study depends on the level of risk an organization is willing to assume and is one that ultimately the individual company should make. In using the risk score, a value less than 0.3 is considered a low risk and a value greater than 0.7 indicates a high risk of a transporter-mediated DDI.
Risk score p for [I1]/IC50 and [I2]/IC50
PK change represents either AUC or Cmax ratio of digoxin in the absence and presence of inhibitor, value is the higher of the two PK parameters.
Digoxin Decision Tree.
In Fig. 2, the digoxin decision tree provides a suggested pathway for the evaluation of the potential for a new chemical entity (NCE) to alter digoxin disposition attributable to inhibition of drug transporters. The recommended in vitro test system is either a polarized cell line such as Caco-2, MDCKII-MDR1, LLC-PK1-MDR1, or P-gp overexpressing membrane vesicles. A unidirectional transport assay of digoxin in the B>A direction (polarized cell lines) or uptake of N-methylquinidine or vinblastine (vesicles) is recommended. As noted in Bentz et al. (2013), no single system outperforms the other based on our IC50 variability analysis. If no alteration in transport is observed with increasing concentrations of the NCE then the NCE is not likely to interact with digoxin and no further studies are needed. However, if increasing concentrations of the NCE result in the inhibition of probe substrate transport, then the generation of an IC50 value is recommended. If the [I1]/IC50 or [I2]/IC50 are less than the indicated criteria, a clinical digoxin assessment may not be required, depending on drug class and therapeutic area. However, if the [I1]/IC50 or [I2]/IC50 are equal or greater than the criteria, a clinical evaluation of the potential for the NCE to alter the pharmacokinetics of digoxin is recommended.
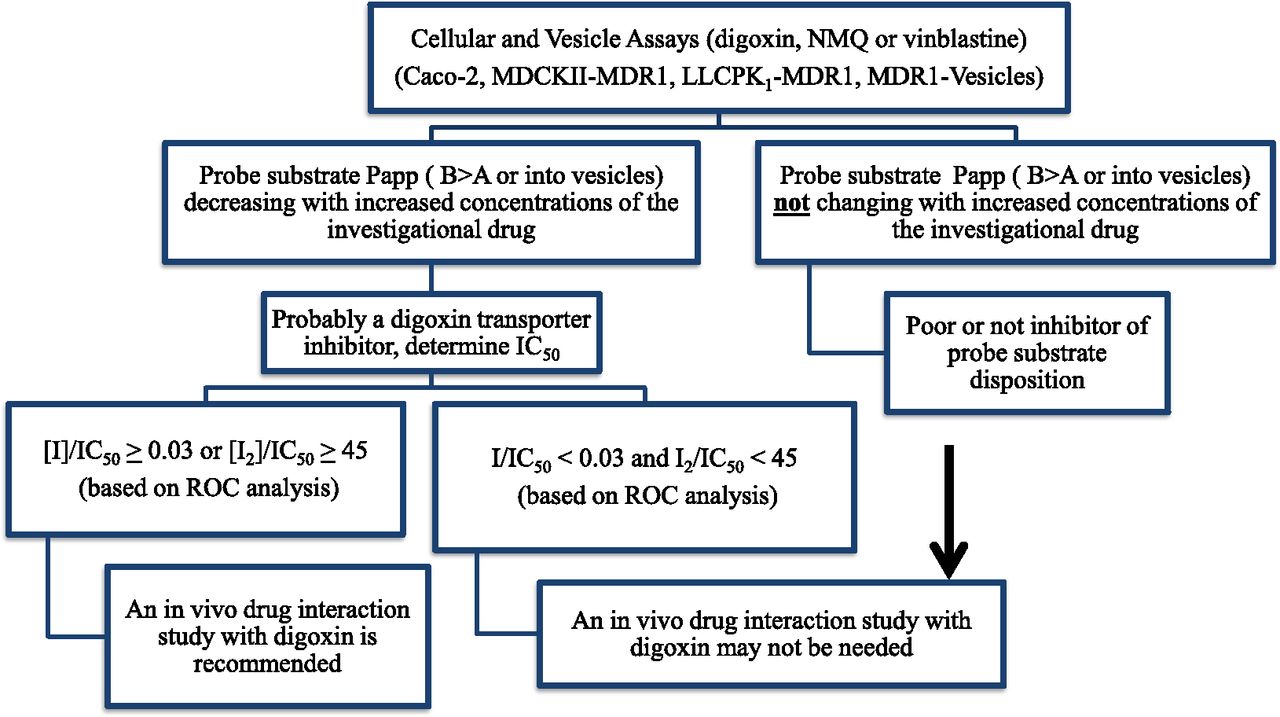
Digoxin DDI decision tree.
Discussion
This article refines the current FDA draft guidance criteria for prediction of digoxin DDIs by applying ROC analysis to IC50 data generated for 15 perpetrators in one of four experimental systems by 23 laboratories. The refined ROC derived criteria are [I1]/IC50 ≥ 0.03 and [I2]/IC50 ≥ 45. These new values were tested against 101 clinical digoxin DDI pairs that were devoid of the 15 perpetrators used to generate the training set. We found that the new criteria resulted in fewer FP and higher accuracy, whereas the FNR remained at a similar level (12%) compared with the current FDA criteria (10%). Furthermore, a risk score was developed for single laboratory [I1]/IC50 and [I2]/IC50 values to incorporate IC50 variability in the DDI risk assessment.
The current FDA draft guidance criteria for risk assessment of a clinical digoxin PK interaction through P-gp inhibition are based on single P-gp IC50 values without regard to experimental system or transport inhibition equation. Because of the lack of repetitive data in the literature, it has not yet been possible to consider potential variability in IC50 values and the effect of that variability on the decision criteria. The companion article demonstrates that the variability in P-gp IC50 values is high, which indicates that a universal decision criteria based on a relatively small set of single IC50 values generated by different laboratories using different experimental systems and transport inhibition equations may not be ideal for each individual laboratory. The FDA universal criteria are based on minimizing the FNR to ensure patient safety without consideration of interlaboratory variability.
This article accounts for variability by applying ROC analysis that incorporates P-gp IC50 values generated by 23 laboratories for 15 perpetrator drugs. Because an IC50 value is required for the ROC analysis, only drugs that inhibited probe substrate transport in vitro were used, which included those associated with positive as well as negative digoxin clinical DDIs. Despite the relatively high rate of FP and FN in the training set (∼25%), the ROC-derived criteria performed well when applied to a test set of 101 pairs of [I1]/IC50 and [I2]/IC50 values versus clinical digoxin AUC or Cmax ratios.
Agarwal et al. (2012) assembled a data set of 11 compounds approved between 2003 and 2010. The authors observed that the decision criteria in the current FDA guidance was highly accurate in predicting the TP (100%, 5 of 5) and FN (0%, 0 of 5), with TN at 67% (4 of 6) and FP at 33% (2 of 6) in this small data set. In the current analysis, the authors have assembled a larger data set of 101 clinical digoxin DDI pairs [the 11 drugs used in Agarwal et al. (2012) are included] for a broader, more comprehensive evaluation of the FDA and ROC-derived criteria.
Similar to the training set, the test set contained drugs that inhibited digoxin transport where an IC50 value was reported. The literature data set consisted of one or two single laboratory IC50 values generated using one of various experimental systems and transport inhibition equations. The predictions based on the FDA and ROC-derived criteria were similar, except the ROC-derived criteria performed slightly better than the FDA criteria with respect to accuracy (73 versus 69%) and exhibited fewer FP (40 versus 51%) attributable to the larger [I2]/IC50 threshold of 45 (compared with 10 for the FDA criteria). The FDA criteria predicted six FP that were classified correctly by the ROC criteria (Table 4). Both sets of cutoff values performed similarly with respect to generation of FN (12% for ROC and 10% for FDA), in which the FDA and ROC criteria classified talinolol, cimetidine, and conivaptan as FN, while ambrisentan was FN by FDA criteria and flecainide and AZD5672 were FN by the ROC criteria. The FNR is of greatest concern to regulatory authorities and sponsors who seek to limit unexpected digoxin toxicities. The ROC-derived criteria, although a universal criteria, incorporated IC50 variability and was derived statistically to identify the best combined [I1]/IC50 and [I2]/IC50 criteria to achieve the greatest accuracy and minimize FNR and FPR. It is noted that the investigations herein did not compare the ROC-derived criteria to the newly endorsed European Medicine Agency guidance because it is based only on an [I2]/IC50 criterion whereas the ROC criteria is based on [I1]/IC50 and [I2]/IC50.
The authors also propose an additional test for individual laboratories to incorporate variability in their single IC50 value by assigning a theoretical variability based on the variance in IC50 values observed in the training set. A risk score can be calculated to indicate the probability that [I1]/IC50 and [I2]/IC50 values will fall above the decision criteria when variability is incorporated into the single laboratory determined IC50 value. This risk score p ranges from 0 to 1. The higher the value of p, the greater the risk of a FN.
Alternatively, a laboratory may prefer to generate their own ROC-derived criteria by choice (Cook et al., 2010) or may observe that their system generates IC50 values outside the range reported in our companion article (Bentz et al., 2013). Cook et al. (2010) generated IC50 values for 26 inhibitors in Caco-2 polarized cell monolayers. As part of the current work, the authors generated ROC-based decision criteria from the Cook et al. 2010 dataset for comparison with the universal ROC-derived criteria (Supplemental Table 1). The decision criteria based on the data in Cook et al. (2010) are in line with the universal decision criteria. Thus, if a laboratory prefers to generate their own decision criteria by ROC analysis, at least 25 inhibitors should be included.
Recently, several laboratories have published in vitro data indicating that, in commonly used cell lines such as MDCKII-MDR1 cells, primary isolated hepatocytes, or HEK293 cells, digoxin is recognized and transported by transporters other than P-gp (Bentz et al., 2005; Kimoto et al., 2011; Taub et al., 2011). It has been demonstrated that in MDCKII-MDR1 cells, digoxin transport involves uptake transporters as well as P-gp, and therefore the IC50 measured using this cell line is not necessarily specific for P-gp. Because the in vivo disposition of digoxin may involve uptake and efflux transporters, inhibition of such transporters can theoretically contribute to elevated digoxin exposures.
Currently, the only formulation of digoxin commercially available is a tablet (Lanoxin) that has a bioavailability of 70%. There are several comedications that increase digoxin exposure greater than twofold such as valspodar (Kovarik et al., 1999), dronedarone [MULTAQ (dronedarone), 2009], quinidine (Rameis, 1985), amiodarone (Robinson et al., 1989), and cyclosporine (Dorian et al., 1988), which is much greater than the theoretical increase in digoxin exposure if only intestinal P-gp was inhibited (∼42% increase based on digoxin bioavailability increasing from 70 to 100%). It is likely that inhibition of digoxin uptake in or efflux from the liver or kidney is also a possible contributor to certain DDIs. Also, many of the FP (Table 4) were administered orally and on multiple days in which in vivo induction may occur, negating the inhibitory effect on digoxin transport. This potential scenario can be anticipated by investigating the induction potential of concomitant medications if decision criteria are exceeded. Interestingly, the European Medicine Agency Committee for Human Medicinal Products has recommended digoxin as a probe substrate for P-gp-mediated renal DDIs only and another probe substrate, dabigatran etexilate, for intestinal P-gp-mediated DDIs (http://www.ema.europa.eu/docs/en_GB/document_library/Scientific_guideline/2012/07/WC500129606.pdf).
Because digoxin is not a specific probe substrate for P-gp, in vitro or in vivo, effects on digoxin transport in vitro, or on digoxin exposure in vivo, cannot necessarily be attributed solely to P-gp inhibition. As such, the authors propose a digoxin-specific DDI tree to guide digoxin DDI risk assessment. Although the authors do not discount the idea that digoxin may serve as a useful probe substrate to investigate P-gp-related DDIs, caution must be exercised in extrapolating observations with digoxin toward other P-gp substrates that may not have similar properties to digoxin. As a note, IC50 values obtained using vesicles with N-methylquinidine and vinblastine as probe substrates, instead of digoxin, were included in the derivation of the ROC criteria and are an acceptable system to use for prediction of clinical digoxin DDI risk.
In conclusion, decision criteria to predict the potential of a new chemical entity to increase digoxin exposure have been proposed that are based on ROC statistical analysis. The proposed refined criteria incorporate the variability determined for inhibition of digoxin transport in the presence of 15 inhibitors generated by 23 laboratories. The refined criteria of [I1]/IC50 = 0.03 and [I2]/IC50 = 45 increased the accuracy and decreased the false positive rate while maintaining a low false negative rate (12%) when tested against a data set of in vitro IC50 and clinical digoxin DDI data obtained from the literature. Additionally, a risk score calculation was developed to indicate the probability that [I1]/IC50 and [I2]/IC50 values will fall above the decision criteria when theoretical variability is incorporated into a single laboratory determined IC50 value. This will further facilitate the decision whether to conduct a clinical digoxin DDI study. The authors also propose that the decision criteria be specific for digoxin and advocate a digoxin-specific decision tree to guide the necessity of a clinical digoxin DDI study.
Acknowledgments
All generated IC50 values were compiled and hosted on a web platform created by the University of Washington Drug Interaction Database (DIDB) program (www.druginteractioninfo.org). In vitro and in vivo digoxin literature data were extracted from the DIDB. The authors thank the following individuals for their expert assistance with the experiments: Marie Brännström and Karima Ben Tabah (AstraZeneca R&D Mölndal); Lawrence Gan (Biogen-Idec); Lalitha Podila (Boehringer Ingelheim Pharmaceuticals); John Herbst, Janet Kolb, and Anthony Marino (Bristol-Myers Squibb); Daria Barwinska (Eli Lilly and Co); Aarti Shah (GlaxoSmithKline); Emile G. Plise (Genentech, Inc); Natalya Alexander (Novartis Institutes for BioMedical Research, East Hanover, NJ); Eric Reyner, Samantha Sevidal, Mark West, and Andrea Clouser-Roche (Pfizer, Inc.); and Jocelyn Yabut (Merck & Co).
Authorship Contributions
Participated in research design: Ellens, Deng, Bentz, Taub, Herédi-Szabó, Neuhoff, Palm, Balimane, Zhang, Jamei, Hanna, Bednarczyk, Chu, Forsgard, Funk, Guo, Hillgren, Li, Pak, Perloff, Rajaraman, Salphati, Taur, Weitz, Wortelboer, Xia, Xiao, Yamagata, Lee.
Conducted experiments: Deng, Coleman, Ragueneau-Majlessi, Chung.
Performed data analysis: Ellens, Deng, Coleman, Bentz, O’Connor, Lee.
Wrote or contributed to the writing of the manuscript: Ellens, Coleman, Taub, Neuhoff, Lee.
Footnotes
- Received December 14, 2012.
- Accepted April 19, 2013.
↵1 Current affiliation: Novartis Institute for BioMedical Research, Cambridge, Massachusetts. Disclaimer: The manuscript reflects the views of the authors and should not be construed to represent FDA's views or policies. Lei Zhang has no conflict of interest to report.
Work at Optivia was supported by Small Business Innovation Research Grants from the National Institutes of Health National Institute of General Medical Sciences [Grants R43GM086970-01 and R43RR031474-01].
↵
 This article has supplemental material available at dmd.aspetjournals.org.

Abbreviations
- A
- apical
- AUC
- area under the curve
- AUC′
- area under the ROC curve
- B
- basolateral
- Cmax
- maximum concentration
- DDI
- drug-drug interaction
- FDA
- Food and Drug Administration
- FN
- false negatives
- FP
- false positives
- FPR
- false positive rate
- GF120918
- Elacridar
- [I1]
- maximum concentration of inhibitor at steady state
- [I2]
- concentration of inhibitor in the gastrointestinal tract based on highest approved dose dissolved by 250 ml
- LLC-PK1-MDR1
- Lilly Laboratories Cells - Porcine Kidney Nr. 1 cells transfected with MDR1 cDNA
- MDCK
- Madin-Darby canine kidney
- MDR1
- multidrug resistance protein
- N
- negative prediction
- NCE
- new chemical entity
- P
- positive predictions
- p
- risk score
- P-gp
- P-glycoprotein
- PK
- pharmacokinetic
- ROC
- receiver operating characteristic
- TN
- true negatives
- TP
- true positives
- TPR
- true positive rate
- U.S. Government work not protected by U.S. copyright


