


Abstract
The disposition and biotransformation of 14C-radiolabeled mavoglurant were investigated in four healthy male subjects after a single oral dose of 200 mg. Blood, plasma, urine, and feces collected over 7 days were analyzed for total radioactivity, mavoglurant was quantified in plasma by liquid chromatography coupled to tandem mass spectrometry (LC-MS/MS), and metabolite profiles were generated in plasma and excreta by high-performance liquid chromatography (HPLC) and radioactivity detection. The chemical structures of mavoglurant metabolites were characterized by LC-MS/MS, wet-chemical and enzymatic methods, NMR spectroscopy, and comparison with reference compounds. Mavoglurant was safe and well tolerated in this study population. Mavoglurant absorption was ≥50% of dose reaching mean plasma Cmax values of 140 ng/ml (mavoglurant) and 855 ng-eq/ml (total radioactivity) at 2.5 and 3.6 hours, respectively. Thereafter, mavoglurant and total radioactivity concentrations declined with mean apparent half-lives of 12 and 18 hours, respectively. The elimination of mavoglurant occurred predominantly by oxidative metabolism involving primarily 1) oxidation of the tolyl-methyl group to a benzyl-alcohol metabolite (M7) and subsequently to a benzoic acid metabolite (M6), and 2) oxidation of the phenyl-ring leading to a hydroxylated metabolite (M3). The subjects were mainly exposed to mavoglurant and seven main metabolites, which combined accounted for 60% of 14C-AUC0–72 h (area under the concentration-time curve from time 0 to infinity). The primary steps of mavoglurant metabolism observed in vivo could partially be reproduced in vitro in incubations with human liver microsomes and recombinant cytochrome P450 enzymes. After 7 days, the mean balance of total radioactivity excretion was almost complete (95.3% of dose) with 36.7% recovered in urine and 58.6% in feces.
Introduction
Mavoglurant (AFQ056) is a noncompetitive antagonist at the metabotropic glutamate receptor 5 (mGluR5) and is currently under clinical development for the treatment of Parkinson disease–associated levodopa-induced dyskinesia (PD-LID). Levodopa has been used for many years as an effective treatment of Parkinson disease (PD) and still remains the gold standard of care (Hauser, 2009). However, its clinical use is hampered by the high incidence of dyskinesia, which affects approximately 40% of patients with PD after 4 to 6 years of treatment with levodopa (Ahlskog and Muenter, 2001). A dysregulation of both dopamine and glutamatergic transmission has been proposed to contribute to the development of PD-LID (Chase and Oh, 2000). Because an inhibition of mGluR5 was shown to alleviate dyskinetic symptoms and reverse movement disorders in rat models of PD (Mela et al., 2007; Rylander et al., 2009), the noncompetitive mGluR5 antagonist mavoglurant is expected to exhibit antidyskinetic effects as it has already been demonstrated in two monkey studies (Morin et al., 2010; Grégoire et al., 2011). Most importantly, in two recent patient studies mavoglurant was shown to be effective in the treatment of moderate to severe PD-LID (Berg et al., 2011). Another indication of mavoglurant is the treatment of fragile X syndrome, which is caused by expansion of a CGG trinucleotide repeat in the 5′ untranslated region of the fragile X mental retardation 1 (FMR1) gene. The fragile X syndrome is associated with intellectual disability and behavioral problems in children as well as adults (Levenga et al., 2011). In a recent study, it was shown that therapeutic blockage of mGLuR5 by mavoglurant can improve the behavioral symptoms in male adults with fragile X and that this improvement is predicted by full methylation at the fragile X mental retardation 1 promoter (Jacquemont et al., 2011). Therefore, mavoglurant has the potential to provide a novel therapeutic approach for both aforementioned indications and, as a result, a good understanding of the absorption, distribution, metabolism, and excretion (ADME) properties of the drug is necessary for successful clinical development and safe treatment of patients.
We present the results of an ADME study in healthy male subjects after a single oral dose of 200 mg 14C-radiolabeled mavoglurant. In addition to this human ADME study, the in vitro metabolism of [14C]mavoglurant was investigated in incubations with human liver microsomes and various recombinant cytochrome P450 (P450) enzymes.
Materials and Methods
Study Drug.
[14C]Mavoglurant [IUPAC name: (3aR,4S,7aR)-4-hydroxy-4-(3-[14C]methylphenyl)ethynyl-octahydro-indole-1-carboxylic acid methyl ester] with a specific radioactivity of 16.1 kBq/mg (0.435 µCi/mg) and a radiochemical purity of >99% was synthesized by the Isotope Laboratory of Novartis (Basel, Switzerland). For the in vitro experiments, [14C]mavoglurant with a specific radioactivity of 5.62 MBq/mg (152 µCi/mg) and a radiochemical purity of >96% was used. The chemical structure of the compound and the position of the radiolabel are shown in Fig. 1.
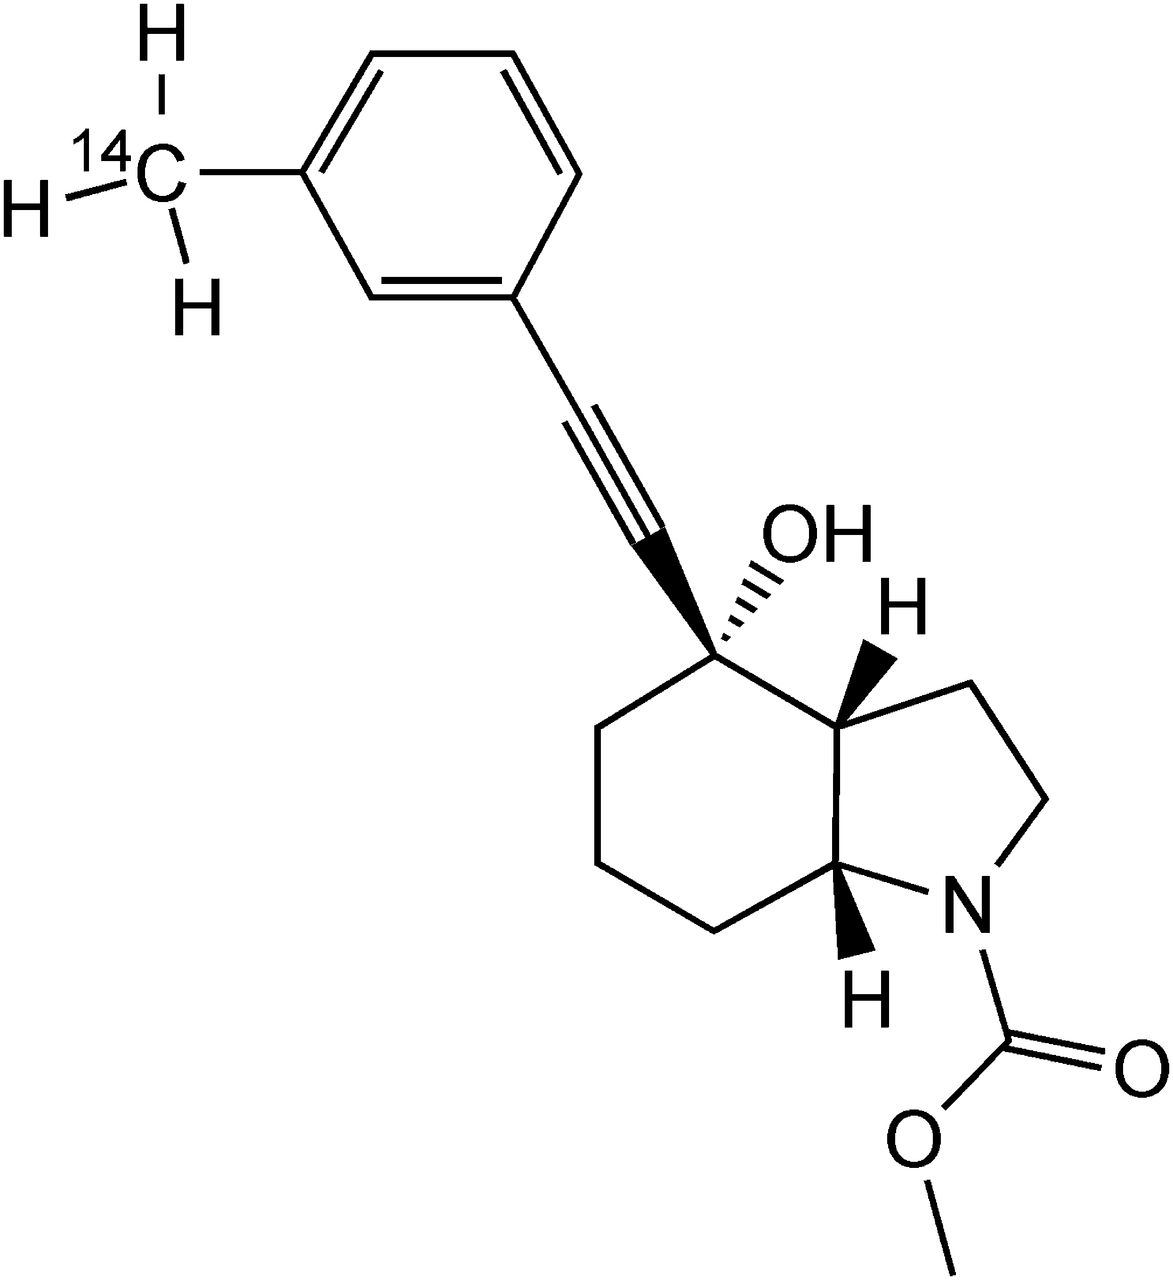
Chemical structure of [14C]mavoglurant.
Chemicals and Standards.
Authentic standards of the metabolites M1, M2, M3, M6, M7, M14, M15, M16, M30, M31, nonradiolabeled mavoglurant, and [13CD3]mavoglurant (used as internal standard for the quantitation of mavoglurant in plasma) were all synthesized at Novartis (for the chemical structures, see Fig. 8). All other chemicals and solvents were of analytic grade and were obtained from commercial sources.
Study Design and Subjects.
Four healthy male subjects participated in this open label, single oral dose ADME study. The study subjects were nonsmokers, had no history of alcohol or drug abuse, and were of good health as determined by past medical history, physical examination and vital signs, and electrocardiogram and laboratory data. None of the subjects used other prescription drugs, over-the-counter drugs, or herbal medications from 4 weeks before dosing through the study completion. Each subject received a single oral dose of 200 mg of [14C]mavoglurant in two gelatin capsules of 100 mg [14C]mavoglurant each (total dose: 1.61 MBq, 43.5 μCi), which were taken consecutively together with one glass (240 ml) of water. Before dosing, the subjects fasted for at least 10 hours and continued to fast until 4 hours after dosing. After dosing, the subjects were kept domiciled for 8 days to conduct pharmacokinetics (PK) and safety assessments.
The clinical part of the study was performed at Covance Clinical Research Unit AG (Allschwil, Switzerland) in accordance with good clinical practice guidelines and the Declaration of Helsinki (1964 and subsequent revisions). Radiation dosimetry calculations were performed according to the rules of the International Commission on Radiologic Protection (ICRP, 1991) and Swiss legal regulations. The prospective whole-body radiation dose was calculated to be less than 1.0 mSv. The study protocol and the radiosafety assessment were approved by the local ethics committee of Basel, Switzerland, and the Swiss Federal Office of Public Health (Radioprotection Division, Bern, Switzerland), respectively. Each subject provided written informed consent before entering the study.
Sample Collection and Aliquoting.
Blood samples of 10 ml were collected (or 30 ml when indicated by an asterisk) into EDTA-containing vacuum tubes by either direct venipuncture or an indwelling cannula inserted in a forearm vein at predose (0*), 0.5*, 1*, 1.5, 2*, 3, 4*, 6, 8*, 12*, 24*, 36, 48*, 72*, 96, 120, 144, and 168 hours post-dose: From the predose blood sample the hematocrit value was determined individually for all subjects. From all blood samples, three aliquots of 0.3 ml each were removed for radioactivity determination in blood (n = 3 for average calculation). These aliquots were frozen immediately and stored at ≤−20°C until analysis. The remaining whole blood (29 and 9 ml) was centrifuged to obtain plasma (e.g., at 2000g, 4°C for 10 minutes). All tubes containing the blood pellet resulting from centrifugation were frozen, stored at ≤−20°C and shipped frozen to Novartis. From each plasma sample, three separate aliquots of 0.3 ml each were removed for radioactivity determination. The aliquots were frozen immediately and stored at ≤−20°C until analysis. In addition, from each plasma sample one separate aliquot of 0.6 ml was removed, frozen immediately, and stored at −70°C until shipment to Novartis, for the PK determination of mavoglurant. The remaining plasma (either 12 or 2 ml depending on the time point) was stored at ≤−20°C for analysis of metabolites. All urine was collected in fractions of 0–6, 6–12, and 12–24 hours, and thereafter in 24-hour fractions up to 168 hours after the dose. During the collection periods, the urine was refrigerated at 4–8°C. All feces portions were collected separately in prenumbered polypropylene containers up to 168 hours after the dose. Each feces portion was diluted with 2–3 volumes of water and homogenized. The weights of undiluted and diluted feces samples were recorded. Urine and feces samples were stored at <−20°C until analysis. Aliquots of blood, plasma, urine, and feces were assayed for radioactivity by liquid scintillation counting. These analyses were performed by Harlan Ltd. (Itingen, Switzerland).
Liquid Scintillation Counting.
Homogeneous samples (100–300 µl) of plasma, urine, or extracts thereof were measured directly in 20 ml antistatic polyethylene vials (Packard BioScience, Groningen, the Netherlands) containing 15 ml of Rialuma liquid scintillation cocktail (Lumac-LSC B.V., Groningen, the Netherlands). Inhomogeneous samples (feces, pellets obtained after centrifugation) were solubilized in a mixture of 0.5–5.0 ml of Soluene-350 (PerkinElmer, Waltham, MA)/isopropanol (1:1, v/v). After complete dissolution, 0.5 ml of the mixture was neutralized with 100 µl of a 10% aqueous solution of formic acid and mixed with 15 ml of IrgaSafe-Plus liquid scintillation cocktail (Zinsser Analytic Maidenhead, Berkshire, UK) for liquid scintillation counting. The samples were assayed for 14C-radioactivity in a liquid scintillation counter model Tri-Carb 2200CA or Tri-Carb 3170TR/SL (Packard Instruments, Meriden, CT) using an external standard ratio method for quench correction.
Determination of Mavoglurant Concentrations in Plasma.
Plasma concentrations of mavoglurant were determined by a validated liquid chromatography-tandem mass spectrometry (LC-MS/MS) assay at Novartis, using the liquid-liquid extraction method to be described. Aliquots of 200 μl of plasma were added to 100 μl of a saturated solution of sodium chloride and 300 μl of an internal standard solution (249 ng/ml) containing [13CD3]mavoglurant in acetonitrile (except for the control or blank samples for which 300 μl of acetonitrile was added instead). Tubes were vortex-mixed for approximately 5 seconds and centrifuged at 8000g for 5 minutes at 5°C. An aliquot of 100 μl of the supernatant was transferred into a glass injection vial followed by addition of 100 μl of water. The capped vials were shaken manually, and 80 μl was injected onto a Zorbax SB-C18 column (30 × 4.6 mm I.D., 3.5 µm particle size; Agilent, Santa Clara, CA). The components were eluted with 20 mM ammonium acetate (A) and methanol (B) at 40°C using a total flow rate of 2 ml/min with the following gradient: 40% B isocratic from 0 to 1.5 minutes, 40%–90% B from 1.5 to 2.0 minutes, 90% B isocratic from 2.5 to 3.5 minutes, 90%–40% B from 3.5 to 3.6 minutes, and 40% B isocratic from 3.6 to 4.5 minutes.
The eluent was directed into the atmospheric pressure chemical ionization source of a TSQ Quantum Discovery Max (Thermo Scientific, San Jose, CA) operated in the multiple reaction mode. For mavoglurant and the internal standard, the transitions from m/z 314 ([M+H]+) to m/z 296 and from m/z 318 to m/z 300 were monitored, respectively. The lower limit of quantitation was 2.00 ng/ml.
Determination of Metabolite Profiles in In Vivo and In Vitro Samples.
Metabolite profiles in plasma, urine, and feces were obtained by high-performance liquid chromatography (HPLC) with radioactivity detection. For metabolite profiling in plasma, individual samples of subjects taken before the dose (0 hour) and at 1, 2, 4, 6, 8, 48, and 72 hours after the dose were analyzed. Each plasma sample was extracted as follows: an aliquot of 4 ml plasma was weighed in a 50 ml BD Falcon tube and was extracted with 30 ml of acetonitrile (Uvasol Merck, Darmstadt, Germany). The sample was stirred and refrigerated (4°C, 30 minutes) and was subsequently centrifuged at 4000g for 10 minutes. The supernatant was removed, and the pellet was resuspended in 10 ml of water/acetonitrile (20%/80%, v/v) and treated by ultrasound (15 minutes). The resulting suspension was placed for 30 minutes in a refrigerator (4°C) and then centrifuged at 8000g for 10 minutes. The supernatant was removed and combined with the first. The combined supernatants were evaporated to dryness under a stream of nitrogen at room temperature. The remaining residue was reconstituted in water (0.2 ml) and then transferred into a 1.5 ml ultracentrifuge tube (Beckman, Krefeld, Germany). The supernatant obtained from this ultracentrifugation step was separated from the pellet and then transferred into a HPLC vial, from which the tare weight was previously determined. The solution was concentrated under a stream of nitrogen at room temperature to a volume of approximately 100 µ. After addition of 25 µ of acetonitrile, the concentrate was further diluted with water up to approximately 0.25 g, and aliquots of 80 µl were injected for HPLC analysis.
Urine from each subject was pooled across the collection period of 0–96 hours to determine the percentage of the dose excreted. Aliquots of 1 ml were centrifuged at 10,000g for 15 minutes and stored at −20°C until HPLC analysis. Aliquots of 100 µl of the resulting supernatants were directly injected for HPLC analysis.
Feces homogenates (diluted with water) of each subject were pooled across the collection period of 0–96 hours. An aliquot of approximately 0.6 ml from each pool was mixed with 10 ml of acetonitrile. The resulting suspension was stirred for 60 minutes at room temperature followed by centrifugation for 15 minutes at 10,000g. After removal of the supernatant, the residue was extracted a second time with 1 ml of water and 10 ml of acetonitrile, using the same procedure. Both supernatants were combined and then evaporated to dryness under a stream of nitrogen at room temperature. The resulting residue was reconstituted by addition of acetonitrile (100 µl) and water (900 µl). Aliquots of 100 µl were injected for HPLC analysis. The chromatography was performed on an Agilent 1200 (Agilent) liquid chromatograph.
For metabolite profiling of the in vivo samples, we used an Atlantis dC18 column (150 × 2.1 mm, 3 µm particle size; Waters, Milford, MA) protected by a 20 × 2.1 mm precolumn of the same stationary phase. The temperature of the column was maintained at 40°C, and the mobile phase flow rate was 350 µl/min. For elution, we used a gradient of 20 mM aqueous ammonium formate (pH 3.6; mobile phase A) versus acetonitrile (mobile phase B). Gradient elution was performed between 0 and 35 minutes from 10% to 25% B, between 35 and 60 minutes from 25% to 50% B, and between 60 and 65 minutes from 50% to 90% B. For in vivo samples, the effluent of the column was split in a 1:8 ratio with the minor part directed into a time-of-flight (TOF) mass spectrometer (Waters). Radioactivity was detected by offline solid scintillation counting by collecting the column effluent of the major split in 0.1 minute fractions on yttrium silicate scintillator-coated 96-well plates (LumaPlates; Packard BioScience), using a GX-271 liquid handler (Gilson, Villiers-le-Bel, France) and a PlateCrane robotic system (Hudson Control Group, Springfield, NJ). The configuration and operation of the PlateCrane automation platform were described previously elsewhere (Krauser et al., 2012). Subsequently, the solvents were evaporated at room temperature, and the dry plates were measured in a microplate scintillation counter (TopCount NXT; Packard Instruments).
For in vitro metabolite profiling, we used a Luna C-8(2) column (150 × 4.6 mm, 5 µm particle size; Phenomenex, Torrance, CA) protected by a 4 × 3 mm precolumn of the same stationary phase. The temperature of the column was maintained at 10°C, and the mobile phase flow rate was 800 µl/min. For elution, we used a gradient of 0.5% formic acid in water (pH 2.4; mobile phase A) versus acetonitrile (mobile phase B). The proportion of mobile phase B was held at 25% until 15 minutes after the injection and was then linearly increased to 35% B at 20 minutes, where it was held for a further 20 minutes. Thereafter, the gradient was linearly increased to 60% B at 45 minutes, where it was held for a further 6 minutes. For in vitro samples, the flow post column was split 2:8 with the major proportion directed, after mixing with Rialuma liquid scintillation cocktail (2.5 ml/min), to a LB 506C-1 radioactivity monitor (Berthold, Wildbad, Germany) equipped with a Z-500-4 500 µl cell. The minor split was directed into the mass spectrometry source.
Concentrations in plasma and amounts in excreta of mavoglurant and its metabolites were estimated from the radiochromatograms, based on the relative peak areas and the concentrations or amounts of radioactivity in the original biologic samples, reduced by the losses during sample preparation and chromatography.
Structural Characterization of Metabolites.
For characterization and confirmation of chemical structures of mavoglurant and/or its metabolites observed in plasma, urine, and feces, we performed liquid chromatography–mass spectrometry (LC-MS), liquid chromatography coupled to mass spectrometry with collisional energy switching in collision cell (LC-MSE), and/or LC-MS/MS experiments in the positive ionization mode using a Synapt Quadrupole-time-of-flight (QTOF) tandem mass spectrometer (Waters). In addition, the synthetic reference compounds for M1, M2, M3, M6, M7, M14, M15, M16, M25, M30, and M31 were analyzed by LC-MS, LC-MSE, and LC-MS/MS for comparison of retention times and mass spectra with those of metabolites. Deuterium exchange experiments were performed by replacing the aqueous mobile phase with deuterium oxide to determine the number of exchangeable protons. The chemical structure of the phase II metabolites M5, M20, M21, M22, M26, and M29 was confirmed by enzymatic hydrolysis experiments by incubating selected urine samples (900 μl) with and without the addition of β-glucuronidase from Escherichia coli K12 (Roche Diagnostics GmbH, Penzberg, Germany) and β-glucuronidase/arylsulfatase from Helix pomatia (Roche Diagnostics GmbH).
To check for the presence of acyl-glucuronides, the stability of selected glucuronides was investigated in alkaline solution. For this purpose, 2 times 1 ml of urine supplemented with either 100 µl of water (control) or 100 μl of 1 N sodium hydroxide solution were incubated for 2 hours at room temperature. Afterward, 100 μl of supernatant from each sample was directly analyzed using the HPLC system, and the metabolic profiles were compared.
To determine whether certain metabolites contained a carboxylic acid functional group, metabolic profiles were recorded at pH 6.4 and pH 3.6, assuming that at higher pH the carboxylic acid containing metabolites would be deprotonated and therefore would have a different interaction with the chromatographic stationary phase and thus a different retention time compared with the lower pH where the carboxylic acid containing metabolites would remain protonated and behave as a neutral in their interaction with the chromatographic stationary phase. To further characterize metabolites M13 and M18, they were isolated from 10 ml of human urine (pool 0–48 hours from one subject) for structural characterization using NMR as follows: the total volume of the pooled urine was concentrated on an Atlantis T3 trapping cartridge (4.6 × 20 mm, 5 µm particle size; Waters) using the Agilent 1200 system equipped with a manual injector. In the first step, the trapping cartridge was conditioned with acetonitrile/20 mM ammonium formate (8:2 v/v), pH 3.6, for 10 minutes followed by conditioning with 100% of 20 mM ammonium formate, pH 3.6, for a 10 further minutes. A volume of 10 ml of pooled urine was loaded on the cartridge followed by a 10-minute washing step with acetonitrile/20 mM ammonium formate (5:95 v/v), pH 3.6. After the washing phase, the components were eluted on an analytic column using the described LC conditions. The concentrated urine sample was separated and fractionated (20 second/well); after transfer of 5 µl aliquots to LUMA plates, they were subsequently measured by TopCount. The fractions found to contain metabolites M13 (1 µg) and M18 (15 µg) were combined respectively and reduced to dryness under a stream of nitrogen using a sample concentrator DB.3D (Witec AG, Littau, Switzerland). The dried extracts were dissolved in 35 µl of D6-dimethyl sulfoxide (Armar Chemicals, Döttingen, Switzerland) and transferred into 1.7 mm I.D. NMR tubes (Bruker BioSpin AG, Fällanden, Switzerland). A series of one- and two-dimensional NMR experiments—1H-NMR, total correlation NMR spectroscopy (TOCSY), rotating-frame nuclear Overhauser effect correlation spectroscopy (ROESY), and, in the case of M18, also heteronuclear single quantum coherence NMR spectroscopy (HSQC) and heteronuclear multiple bond correlation NMR spectroscopy (HMBC)—were performed on a Bruker Avance 600 (Bruker BioSpin AG) NMR spectrometer equipped with a 1.7-mm I.D. cryoprobe. The TOCSY mixing time was 80 milliseconds.
In Vitro Incubations.
Pooled human liver microsomes prepared from 50 individual donors (male and female) were obtained from BD Biosciences (Woburn, MA). Human recombinant P450 enzymes CYP1A1, CYP1A2, CYP1B1, CYP2A6, CYP2B6, CYP2C8, CYP2C9*1, CYP2C18, CYP2C19, CYP2D6*1, CYP2E1, CYP2J2, CYP3A4, CYP3A5, CYP4A11, CYP4F2, and CYP4F12 expressed in baculovirus-infected insect cells (BTI-TN-5BI-4) and control insect cell membrane preparations were supplied by BD Biosciences. Incubations with human liver microsomes (HLM) and recombinant P450 enzymes were performed in 100 mM phosphate buffer (pH 7.4). For incubation with P450 enzymes CYP2A6, CYP2C9, CYP2C18, and CYP4A11, the phosphate buffer was replaced by 100 mM Tris buffer. Enzyme kinetics of the biotransformation were determined after establishing linear incubation conditions regarding the incubation time and the microsomal protein concentration. After addition of different volumes of [14C]mavoglurant stock solution, the reactions were started by addition of a 1 mM NADPH solution. The final incubation volume was 1 ml. The enzymatic reactions were stopped and the protein was precipitated by addition of an equal volume of ice-cold acetonitrile.
Pharmacokinetic Evaluation.
The PK parameters were calculated from the plasma concentration-time data using noncompartmental methods. Areas under the concentration-time curve (AUC) were determined by the linear trapezoidal method and extrapolated to infinity using the equation AUCt–inf = Ct · t1/2 / ln 2, where Ct is the last observed concentration above the lower limit of quantitation (mavoglurant) or limit of detection (metabolites). The half-life (t1/2) values were calculated by log-linear regression of plasma concentrations versus time across the terminal elimination phase.
For evaluation of blood/plasma distribution of mavoglurant and its metabolites, the fraction of mavoglurant in plasma (fp) was calculated as follows: fp(%) = (Cp / Cb) × (1 − H) × 100, where Cb is the concentration in blood, Cp is the concentration in plasma (Hinderling, 1997), and H is the hematocrit value (range: 0.40–0.46). The concentration in blood cells (Cbc) was calculated as follows: Cbc = [Cb − Cp × (1 − H)] / H and used for calculation of the blood cells to plasma concentration ratio (Cbc/Cp).
The PK parameters were calculated by noncompartmental method(s) using WinNonlin Professional Version 5.2 (Pharsight Corporation, Mountain View, CA).
Results
Demographic, Safety, and Tolerability Data.
Four healthy, male Caucasian subjects were enrolled and completed the study. Their mean age was 33 years (range: 25–42 years), their height was 170 ± 3 cm (mean ± SD, n = 4, range: 170–175 cm), and their weight was 69 ± 10 kg) (range: 54–76 kg). Mavoglurant was safe and well tolerated as indicated by the lack of any clinically significant abnormalities in the clinical laboratory parameters, vital signs, or electrocardiogram data and the absence of any serious or dose-limiting adverse events. In total, only two subjects experienced adverse events that were suspected to be related to the study drug. These adverse events, somnolence and feeling abnormal, were both of mild severity, had an early onset within about 2 hours after dosing, and spontaneously resolved within less than 1 hour.
Pharmacokinetics of Total Radioactivity and Mavoglurant.
After a single oral dose of 200 mg [14C]mavoglurant, the peak plasma levels (Cmax) of mavoglurant and total radioactivity were observed at 2.6 and 3.6 hours, respectively (Table 1, Fig. 2), indicating rapid oral absorption. Mavoglurant represented 16% of the radioactivity at tmax and accounted for 10% of the plasma 14C-AUC0–inf, indicating that mavoglurant was metabolized rapidly and extensively. After reaching Cmax, mavoglurant was eliminated from plasma with a t1/2 of 12 hours while the radioactivity in blood and plasma, which largely represented metabolites, decreased virtually monoexponentially with a t1/2 of 17.9 and 19.2 hours, respectively (Table 1; Fig. 2). Mavoglurant-related radioactivity in plasma was detected for up to 120 hours, and unchanged mavoglurant was detected for up to 72 hours.
Pharmacokinetic parameters of total radioactivity in blood and plasma and mavoglurant concentrations in plasma
Data are mean ± S.D., n = 4, or median values from four healthy subjects treated with a single oral dose of 200 mg of [14C]mavoglurant. Total radioactivity and mavoglurant were determined by liquid scintillation counting and LC-MS/MS, respectively. Percentage values in brackets are coefficient of variation (CV).

Pharmacokinetics of total radioactivity and mavoglurant in plasma of four healthy male subjects treated with an oral dose of 200 mg of [14C]mavoglurant. Concentrations of mavoglurant were determined by LC-MS/MS. Mean concentrations with standard deviations are shown. Inset: Semilogarithmic concentration-time graph with extended time scale (0–120 hours).
Metabolite Structures.
Chemical structures were elucidated using mass spectrometry (Table 2) and NMR spectroscopy (Table 3; Figs. 3–5). The chemical structures and main biotransformation pathways of the mavoglurant metabolites detected in plasma and/or excreta are depicted in Fig. 8 and are listed in Table 4 and Table 5.
Mass spectral data of protonated mavoglurant and its metabolites
For characterization and confirmation of chemical structures of mavoglurant and its metabolites observed in plasma, urine, and feces, LC-MS, LC-MSE, and/or LC-MS/MS in the positive ionization mode were performed on a Synapt Quadrupole-time-of-flight (QTOF) tandem mass spectrometer.
1H-NMR and 13C-NMR data of mavoglurant and its metabolites M13 and M18
The proposed chemical structure of metabolite M18 including numbering of atoms is shown.

TOF-MSE spectra of mavoglurant and metabolites M1/M2 and M7. Sodium and potassium adduct ions of mavoglurant (e.g., m/z 336) and some metabolites (e.g., M7, m/z 352 or m/z 368) were more prominent in the mass spectra than the protonated quasi molecular ions. In general, this effect is minimized when the sample is diluted with mobile phase during LC-MS coupling. Fairly crude concentrated plasma, urine, and feces samples containing high concentrations of electrolytes were directly injected on the HPLC column to maximize the sensitivity for radiodetection, producing this competition effect (Tang and Kebarle, 1993).

1H-NMR and TOCSY data of metabolite M13 isolated from human urine. Right panel: Expanded region from 6.45 to 7.80 ppm of the TOCSY spectrum with highlighted cross peaks. Left panel: TOCSY cross peaks labeled in metabolite structure with arrows. Bottom left: Expanded region of 1H-NMR between 17.2 and 17.4 ppm.
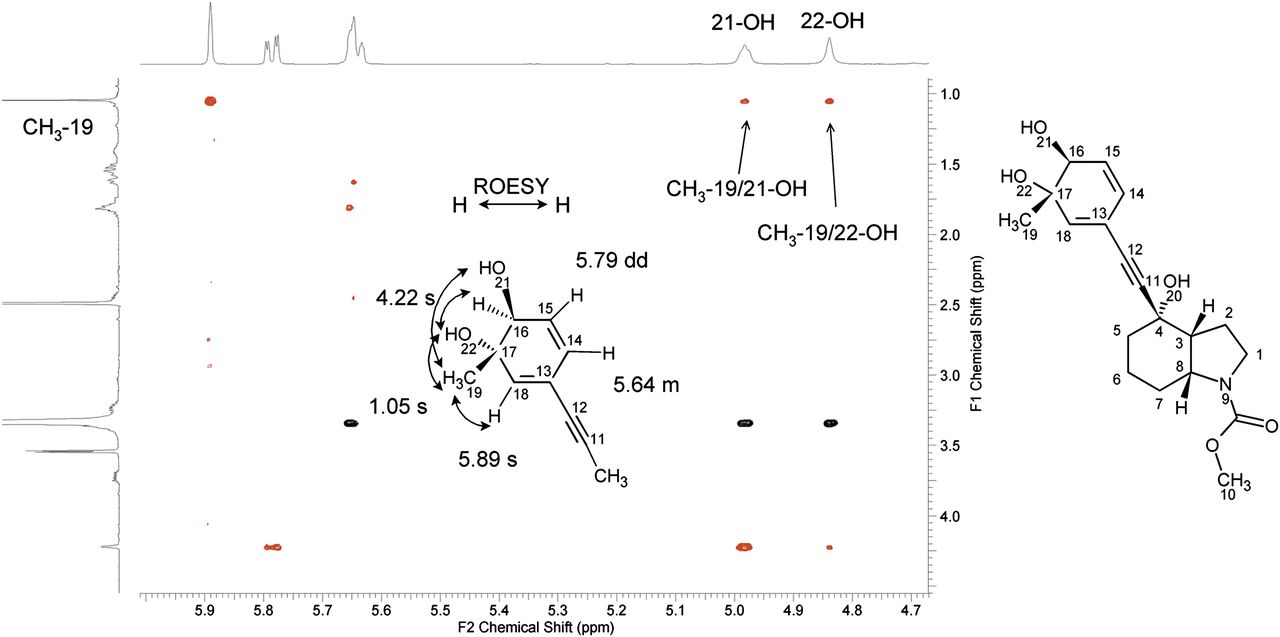
ROESY NMR data of metabolite M18 isolated from human urine. The expanded region of the ROESY spectrum from 1.00–4.40 ppm on the F1-axis and from 4.70–5.95 ppm on the F2 axis is shown. The relevant cross peaks are highlighted and illustrated with arrows on the partial metabolite structure.
Mean AUC0–72 h and percentage of total radioactivity AUC0–72 h values of mavoglurant and its metabolites in the plasma of four healthy male human subjects after a single oral dose of 200 mg of [14C]mavoglurant
The components are listed in the order of the chromatographic elution. Mean ± S.D., n = 4.
Amounts of mavoglurant and its metabolites excreted in urine and feces, derived from metabolite profiles
Data are from four healthy male subjects treated with a single oral dose of 200 mg of [14C]mavoglurant. Radioactivity and mavoglurant were determined by liquid scintillation counting and LC-MS/MS, respectively. The components are listed in the order of the chromatographic elution. The letters A, B, C, D, and E indicate the formation of metabolites through corresponding metabolic pathways. The metabolic pathways are shown in Fig. 8. Mean ± S.D., n = 4.
Strategy for Structural Characterization of Mavoglurant Metabolites.
For mavoglurant and its metabolites, the determination of molecular ions and fragment ions was difficult due to in-source fragmentation—that is, single or double loss of water from the molecular ion (Table 2). Nevertheless, low abundant molecular ions as well as sodium and potassium adduct ions, which did not undergo in-source fragmentation, as well as key fragments were determined by LC-MS analysis, with offline radioactivity detection for peak correlation with mass spectral data. In general, the structures of the metabolites were derived from their product ion mass spectra and the elemental composition by exact mass measurement. Because fragmentation of the aliphatic ring system led to a number of fragment ions that could not be assigned to certain substructures, structural proposals were supported by comparison with synthetic standards whenever possible. Example MSE spectra, including assignment of major fragment ions, mavoglurant, and metabolites M1, M2, and M7, are presented in Fig. 3. An overall summary of the mass spectral data obtained for mavoglurant and metabolites is presented in Table 2.
The chemical structures of the metabolites were further confirmed as follows. 1) Metabolites M1, M2, M3, M6, M7, M14, M15, M16, M25, M30, and M31 were confirmed with synthetic reference standards by comparing chromatographic retention times and mass spectral data. 2) Metabolites M12 (0.82% of plasma 14C-AUC0–72 h), M17 (0.56%), M23 (3.1%), M27 (2.9%), M28 (0.97%), and M29 (1.2%) could only be partially structurally characterized (see Table 2 for a summary of the data obtained for these metabolites). 3) The mobile phase was changed from water to deuterium oxide to determine the number of exchangeable protons for structural confirmation. 4) Chromatographic pH shift experiments were performed to confirm the presence or absence of carboxylic acid function in metabolites. 5) Enzymatic digestion experiments in combination with mass spectral data confirmed the presence of glucuronide or sulfate conjugates. 6) Chemical hydrolysis at a different pH allowed the differentiation between ether- or ester-bound glucuronides. 7) Metabolites M13 (minor metabolite in plasma) and M18 (major metabolite in plasma) were isolated from human urine, and their chemical structures were confirmed by NMR (Table 3).
Structural Characterization of Metabolites.
Metabolite M13 showed a mass shift of −12 Da compared with the molecular ion of mavoglurant, which indicated that the carbamate moiety was hydrolyzed and that additional triple oxidation accompanied by dehydrogenation occurred in the molecule. M13 was isolated in very small quantities from urine. Hence, the NMR spectra have a low signal-to-noise ratio (S/N) and show a fairly intensive impurity background in the aliphatic region. However, the acquisition of two-dimensional TOCSY spectra (Fig. 4) and comparison with the parent drug NMR data confirmed that the benzylic methyl group was oxidized to benzoic acid and that an aromatic hydroxylation occurred in the alpha position (Table 3). More detailed observations include the following. 1) An exchangeable proton (21-OH) appeared at 17.3 ppm with comparable signal intensity to three aromatic signals that are part of a 1,2,4 tri-substituted benzene ring (signal multiplicity and coupling constants in Hz in brackets: H14: double doublet (dd) [8, 2], H15: doublet (d) [8], H18: d [2]). 2) The extreme down-field shift of the OH-proton at 17.3 ppm can be explained by the presence of hydrogen bond to an adjacent carbonyl oxygen. 3) The up-field shift of H-15 from 7.25 ppm in mavoglurant to 6.56 ppm in M13 indicated its proximity to the hydroxyl-group. 4) The signal of the carbamate methyl group is not visible, indicating the loss of this unit. The NMR signal interpretation of metabolite M13 is in line with the LC-MS/MS findings and the proposed chemical structure shown in Fig. 8.
A mass shift of +34 Da compared with the molecular ion of mavoglurant for metabolite M18 indicated that double oxidation and hydrogenation occurred in the molecule. This metabolite was isolated in larger quantities (~15 μg) from urine and purified for NMR analysis. The NMR data are summarized in Table 3. The 1H-NMR spectra of M18 showed a significant high-field shift of the aromatic protons in comparison with the 1H-signals of the parent compound mavoglurant. Moreover, the 13C-signals in position C-16 (73.5 ppm) and C-17 (72.5 ppm) indicated the loss of the aromatic system. Instead, a new spin system was present containing a Z-double bond (14-H and 15-H) with an allylic coupling to an olefinic proton (16-H) at 4.22 ppm and exchangeable protons at 4.98 ppm (21-OH) and 4.83 ppm (22-OH), indicating that two OH groups are bound in position C-16 and C-17. The ROESY experiment (Fig. 5) showed a stronger ROE between 16-H and 22-OH than between 16-H and 19-CH3. This indicates that 16-H and 22-OH are on the same side of the ring and that the relative conformation of the hydroxyl-group is trans. Moreover, the coupling constant between proton at C-15 and proton at C-16 of 2.7 Hz was more consistent with a trans configuration, as a cis isomer should have a smaller coupling constant. In addition, the trans relationship of the 16-H and 22-OH group is ensured by the fact that the dihydrodiol was formed from an epoxide. In summary, the NMR and MS data of M18 point to the presence of a trans dihydrodiol metabolite. However, the fact that the 1H-NMR spectra did not show signal splitting strongly suggests the presence of only one diastereomer of M18. The interpretation of signals was in line with the chemical structure of M18 proposed in Fig. 8.
For metabolite M19, a mass shift of +137 Da compared with the molecular ion of mavoglurant and accurate mass data indicate that the metabolite is a taurine conjugate of metabolite M6.
The enzymatic digestion with β-glucuronidase and arylsulfatase, performed on selected samples, confirmed that M5 is a direct glucuronide of mavoglurant, and that M20, M21, and M22 are glucuronide conjugates of M3, M6, and M7, respectively. Complementary hydrolysis experiments in alkaline solution indicated that M21 was likely an acylglucuronide of M6.
Accurate mass data for metabolite M24 with a mass shift of +87 Da compared with the molecular ion of mavoglurant indicate that the metabolite is a glycine conjugate of metabolite M6. Analysis of the metabolite under different pH-conditions confirmed the absence of a benzoic acid group in the metabolite.
For metabolite M26, a mass shift of +96 Da compared with the molecular ion of mavoglurant and accurate mass data indicate that oxidation and sulfate conjugation occurred in the molecule. Enzymatic digestion experiments in urine using arylsulfatase confirmed that M26 is the sulfate conjugate of M3.
Metabolite Profiles in Plasma and Excreta.
Plasma samples for the each of the individual subjects and per time point were analyzed for metabolite profiles; examples are shown in Fig. 6. Mavoglurant was extensively metabolized, and 24 metabolites were characterized in plasma (Table 4). In addition to mavoglurant, the subjects were mainly exposed to metabolites M6, M14, M15, M18, and M30, which combined accounted for >56% of 14C-AUC0–72 h. All other listed metabolites accounted for less than 5.0% of the 14C-AUC0–72 h each. Urine and feces pools (0–96 hours) from each subject were analyzed for metabolite profiles. Representative metabolic profiles are shown in Fig. 7 and listed in Table 5. The main proportion of the administered radioactivity was excreted with feces and amounted to 55.8% ± 13.8% (mean ± SD, n = 4) of the dose within 96 hours (Fig. 9; Table 5). Of this, unchanged drug amounted to 40.8% ± 14.9%. The major metabolites in feces were M6 (benzoic acid metabolite) and M19 (taurine conjugate of M6). Metabolites M3, M23, M24, M27, and M28 were also detected and accounted for less than 1.0% of the dose each. In urine (0–96 hour), on average, 35.5% ± 9.5% of the administered radioactivity was excreted (Fig. 9; Table 5). Major metabolites in urine were M6, M15, M14, coeluting M19 and M20, and coeluting M25 and M26. The glucuronide conjugates M21/M22 were only detected in small amounts. No parent compound was detected in urine. Other metabolites were detected at trace levels only (<1.0% of dose).

Representative metabolic profiles in plasma (A–C) of one healthy male subject treated with a single oral dose of 200 mg of [14C]mavoglurant.

Representative metabolic profiles in urine and feces of four healthy male subjects treated with a single oral dose of 200 mg of [14C]mavoglurant.
In Vitro Metabolism of [14C]Mavoglurant.
Complementary in vitro incubations of [14C]mavoglurant in human liver microsomes (Table 6) demonstrated that M7 and M1/M2 were major metabolites formed in human liver microsomes. Incubations in recombinant P450 enzymes confirmed that metabolite M7 was formed mainly by the CYP2C family (CYP2C8, CYP2C9, CYP2C19) with minor to negligible contributions of CYP2D6, CYP3A4, and CYP1A1. The enzyme kinetics by CYP2C8, CYP2C9, and CYP2C19 were characterized by apparent Km values of 17.1, 2.49, and 3.54 µM and Vmax values of 5.06, 1.15, and 14.8 pmol/(min·pmol P450 enzyme), respectively. In addition, the incubations also showed that metabolites M1/M2 were formed by CYP3A4 with negligible contributions of CYP1A1. The enzyme kinetics by CYP3A4 were characterized by an apparent Km value of 7.78 µM and a Vmax of 84.1 pmol/(min·pmol P450 enzyme). Metabolite M3 was only identified in traces in incubations of human liver microsomes because it was mainly formed by recombinant CYP1A1 (which is mainly expressed extrahepatically) with minor contributions from CYP2C19 and CYP1A2. The enzyme kinetics by CYP1A1 were characterized by a Km value of 0.796 µM and a Vmax of 45.7 pmol/(min·pmol P450 enzyme) (Table 6).
Results from in vitro incubations of [14C]mavoglurant in recombinant human P450 enzymes and human liver microsomes (HLM)
Discussion
[14C]mavoglurant, administered as a single oral dose of 200 mg to healthy subjects, was rapidly absorbed. Mavoglurant and total radioactivity disappeared from plasma with mean half-lives of 12.0 and 17.9 hours, respectively (Fig. 2), indicating that the risk for accumulation of mavoglurant and/or its metabolites during chronic treatment is rather low. The extent of absorption was >50% of the dose as assessed by the average amount of radioactivity excreted in urine (35.5% of dose; Table 5), the amount of metabolites in feces (15.0% of dose), and the assumption that no bacterial degradation of mavoglurant occurs in the intestinal lumen. An autoradiography study in rats (3 mg/kg [14C]mavoglurant, i.v.) did not indicate substantial direct secretion of mavoglurant and/or its metabolites into the gastrointestinal lumen, bypassing the biliary route (Novartis, unpublished data). For comparison, the absolute oral bioavailability of mavoglurant (100 mg PO versus 25 mg i.v.) was about 40% of the dose (Novartis, unpublished data). Overall, the PK of mavoglurant in this study was comparable to the data reported in PK studies in healthy subjects dosed with 100 mg of oral mavoglurant (Novartis, unpublished data).
The distribution of mavoglurant and total radioactivity occurred rapidly, as indicated by the early onset of Cmax at about 2.6 and 3.6 hours, respectively (Table 1). Mavoglurant is a very lipophilic compound with a logP (octanol/water) of 4.7. Consequently, the mean apparent terminal distribution volume (Vz/F) of mavoglurant was high (38.7 l/kg), indicating an extensive distribution to organs and tissues. The blood/plasma distribution ratio of radioactivity was 0.61, which corresponds to 94% of 14C-AUC0–inf being confined to the plasma compartment. In earlier in vitro blood distribution and plasma protein binding studies, 92% of total [14C]mavoglurant in the blood was confined to the plasma compartment, and the plasma protein binding of [14C]mavoglurant was high, with an unbound fraction (fu) of 2.8% (Novartis, unpublished data).
The absorbed part of the oral dose was cleared mainly by metabolism through both biliary/fecal and renal elimination, with an apparent plasma clearance (CL/F) of 2.07 l/(h·kg) (Table 1). By considering mavoglurant’s blood/plasma distribution ratio of 0.61 and its known F value of approximately 0.4, the corresponding total systemic clearance (CL) was assessed to be at 0.504 l/(h·kg) (41% of the hepatic blood flow).
About 89% of total 14C-AUC0–72h in plasma was accounted for by numerous metabolites, of which up to 24 were structurally characterized (Table 4; Fig. 8). About 48% of 14C-AUC0–72 h was covered by M3, M6, M7 M14, M15, M18, and M30. The metabolites M1/M2, M7 and M3 were shown to be major metabolites formed in vitro and were also observed in vivo in human plasma at early time points (Fig. 6; Table 4). At 1 hour, mainly M1/M2, M3, M5, M6, M7, and M18 were detected, confirming that these metabolites indeed represented the primary steps of the in vivo mavoglurant metabolism. M1/M2 and M3 reached Cmax after 4 hours and M7 after 2 hours. After 1 or 2 hours, secondary metabolites started to appear in the radiochromatogram that were formed by further oxidations (e.g., M30), hydrolysis (e.g., M15), and/or combinations thereof, with subsequent conjugation reactions (e.g., M19, M20, M22, M24, M26, and M29). Metabolites M13, M14, M15, M18, M19, M20, M22, M23, M24, M26, M27, M6, and M30 (representing secondary metabolites) were observed for up to 72 hours after the dose.
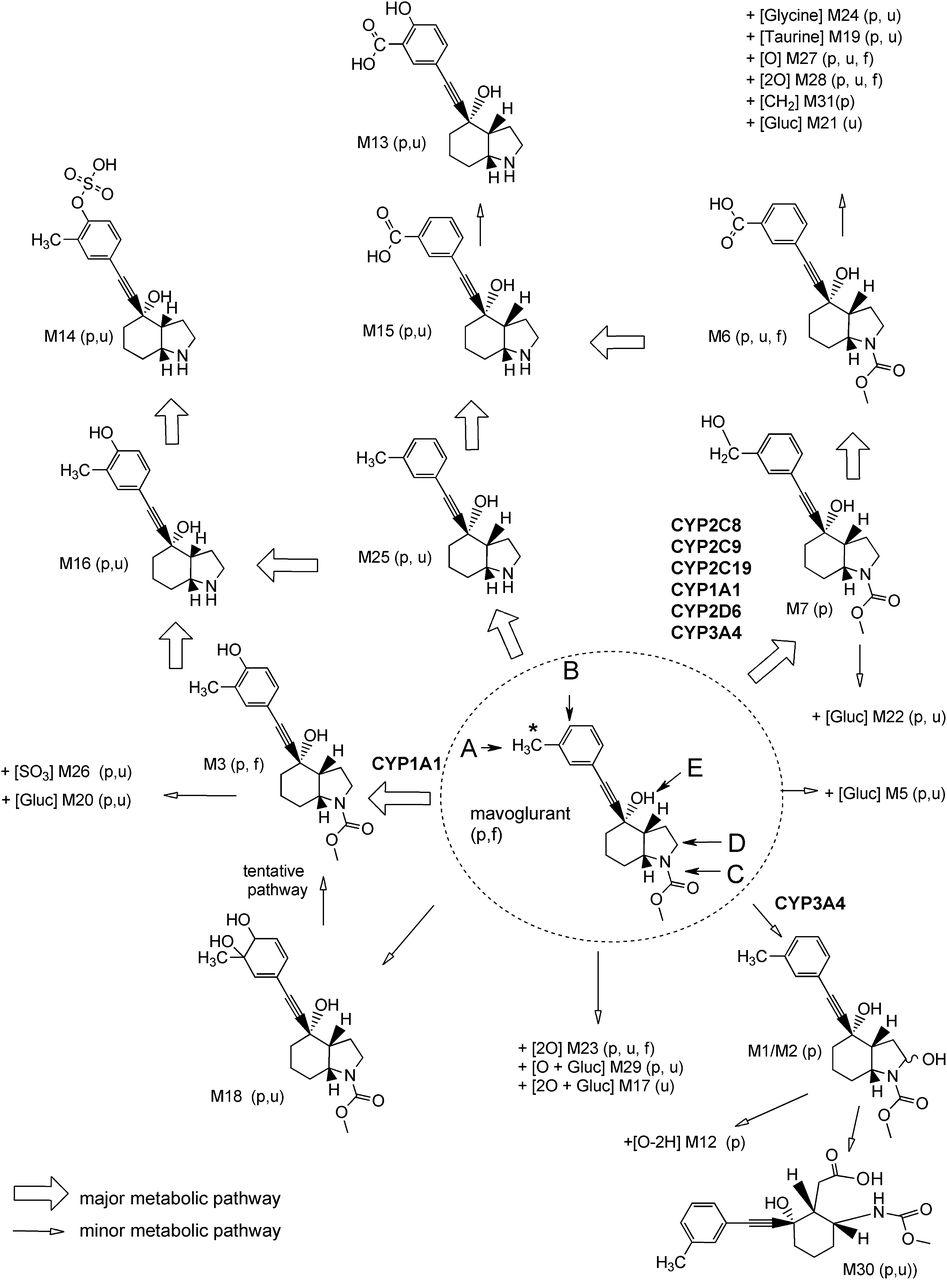
Proposed metabolic pathways of mavoglurant in healthy human subjects. (A–E) Main positions of metabolic transformation. p, plasma; u, urine; f, feces. *Position of 14C radiolabel. +[O], aromatic or aliphatic oxidation; +[2O], 2-fold aromatic or aliphatic oxidation; +[CH2], O-methylation; +[SO3], sulfuric acid conjugation; +[Glycine], glycine conjugation; +[Taurine], taurine conjugation; +[Gluc], conjugation with glucuronic acid; +[O-2H], oxidation and dehydrogenation.
In feces, 40.8% of the dose was recovered as unchanged mavoglurant, which was either nonabsorbed material, biliary-excreted mavoglurant, or was formed by bacterial metabolism of biliary-excreted M5 in the intestine. In dog bile samples taken after 1 and 28 days of daily oral treatment with 625 mg/kg [14C]mavoglurant, about 1.4% and 1.1% of total radioactivity in the bile (collected at dissection time) consisted of unchanged mavoglurant and about 20% and 6% of M5, respectively (Novartis, unpublished data). As no M5 and also no parent drug were observed in the bile of bile duct-cannulated rats (3 mg/kg i.v.; 10 mg/kg PO), we conclude that the unchanged mavoglurant observed in human feces is predominantly due to nonabsorbed drug, but we cannot exclude some contribution through intestinal hydrolysis of M5 (Novartis, unpublished data). In urine, no mavoglurant was detected, which indicates that mavoglurant is not renally cleared. However, a contribution of renal metabolism through renally expressed CYP1A1 to the metabolic clearance of mavoglurant cannot be excluded. Another explanation for the virtual absence of unchanged mavoglurant in urine might be that mavoglurant, which is a neutral compound with a logP (octanol/water) of 4.7, might undergo passive reabsorption with subsequent almost complete metabolism (Varma et al., 2009).
The major metabolite in feces and urine was M6, representing 5.46% and 7.31% of the dose, respectively (Table 5). The balance of excretion was almost complete (>95% of dose; Fig. 9). In general, all metabolites that were detected in plasma were also detected in the excreta with the exception of M1/M2, M12, and M31, which were only detected in plasma, and M17 and M21, which were only detected in urine. Although no primary metabolites, apart from M3, M5, and M25, could be detected in excreta, the secondary metabolites could partly be classified by the initial primary biotransformation steps and the P450 phenotyping data.

Cumulative excretion of total radioactivity in healthy male subjects treated with a single oral dose of 200 mg of [14C]mavoglurant. Values are given as mean ± S.D. for n = 4 subjects. ▵ Percentage of dose excreted in urine. □ Percentage of dose excreted in feces. ○ Percentage of dose excreted in both urine and feces combined.
The chemical structures of the mavoglurant metabolites observed in the excreta, combined with in vitro metabolism, indicated two major biotransformation pathways (Fig. 8) were involved in the elimination of mavoglurant:
A) Oxidation of the tolyl-methyl group to metabolite M7 and subsequent oxidation to M6, followed by conjugation or further oxidations which, together, accounted for about 56% of total metabolism. The CYP2C family with minor involvement of CYP1A1, CYP2D6, and CYP3A4 contribute to this pathway.
B) Oxidation of the phenyl ring in the ortho-position to the tolyl-methyl group (M3) or oxidative formation of the dihydrodiol metabolite M18 followed by conjugation, which together accounted for 7.52% of the total metabolism. CYP1A1 was identified as the main contributing enzyme to the formation of M3 (Table 6).
The dihydrodiol metabolite M18 might be postulated as a downstream hydrolysis product of an epoxide metabolite of mavoglurant. However, no further downstream products such as glutathione adducts of mavoglurant or metabolites thereof were detected, either in vitro in human hepatocytes (Novartis, unpublished data) or in vivo. In this study, M18 displayed plasma 14C-AUC0–72 h levels of 8.8% (range: 7.0%–12.1%) (Table 4). M18 was also detected in dog plasma (0.49% of 14C-AUC0–32 h) and in dog urine (0.27% of dose) after a single oral dose of 10 mg/kg [14C]mavoglurant (Novartis, unpublished data). As the average human exposure of M18 relative to overall drug–related exposure is low and M18 was also covered in the dog (toxicity studies), there are no palpable safety concerns of M18 in humans.
Additional metabolic pathways accounted (combined) for less than 10% of overall metabolism and include:
C) Hydrolysis of the carbamate methylester group to M25. The carbamate hydrolysis might be mediated by carboxylesterases; however, an oxidation on the methyl group of the carbamate moiety of mavoglurant followed by hydrolysis and release of free amine cannot be excluded (Yumibe et al., 1996).
D) Oxidation of the aliphatic octahydro-indol moiety of mavoglurant to the diastereomeric alcohols M1 and M2 and further oxidation to M12 (possibly a lactam or urea metabolite), followed by hydrolysis and ring opening leading to an aliphatic carboxylic acid metabolite M30. CYP3A4 was identified as the major contributing enzyme to this pathway.
E) Direct O-conjugation of mavoglurant with glucuronic acid to M5. The glucuronosyl-transferases UDP-glucuronosyltransferase 1A4 (UGT1A4) and UGT2B7 were identified as the major contributing enzymes to this pathway (Novartis, unpublished data).
A number of additional minor metabolites were identified that were either formed by a combination of the previously mentioned pathways or could not be fully structurally characterized. These mixed or uncharacterized contributions together accounted for about 30% of total metabolism. It should be noted that the contributions of CYP3A4 and CYP1A1 to metabolic pathway A might be underestimated, as they were also contributing to a minor extent to pathways B and D. In general, the involvement of multiple enzymes such as the CYP2C family, CYP1A1, and CYP3A4 in the metabolism of mavoglurant minimizes the risk for drug-drug interactions (with mavoglurant being the victim drug) because several enzymes could still metabolically clear mavoglurant, even if one enzyme is inhibited or not active due to the enzyme’s natural variation or polymorphism. Nevertheless, the observed main in vivo metabolic pathways—the formation of M7 and M3 through CYP2C and CYP1A1 enzymes, respectively—differ from the main predicted in vitro results (Table 6), where CYP3A4 was predicted to be the main enzyme driving the human metabolism of mavoglurant. One reason for this discrepancy could be the contribution of extrahepatically expressed CYP1A1 to mavoglurant metabolism, as this metabolic route is not covered by in vitro incubations with human liver microsomes. CYP1A1 is mainly expressed in extrahepatic organs such as the intestine, lung, kidney, skin, and placenta (Ioannides and Parke, 1990; Rendic and Di Carlo, 1997).
This ADME study with 14C-radiolabeled mavoglurant in healthy male subjects showed a rapid and good absorption of mavoglurant (>50% of dose), fast and extensive metabolism, and almost complete excretion (>95% of dose) through biliary/fecal and renal routes. Mavoglurant is predominantly cleared by metabolism, primarily through oxidation pathways and additionally through conjugation with glucuronic or sulfuric acid. Part of the primary steps of mavoglurant metabolism observed in vivo could be reproduced in vitro in incubations with human liver microsomes and recombinant P450 enzymes. Accumulation of mavoglurant and/or its metabolites in the body after chronic oral daily administration is not anticipated from these single-dose data. This, coupled with the good safety and tolerability profile as shown in the subjects of this study, supports the further clinical development of oral mavoglurant in patients.
Acknowledgments
The authors thank Ines Rodriguez, Albrecht Glaenzel, and the Novartis Isotope Laboratory (Synthesis and Analytics groups) for the synthesis and release of [14C]mavoglurant; Hubert Borell and Veronique Pflimlin for in vitro experiments and sample analysis by HPLC; Alexander D. James for critical review of the manuscript; Markus Weiss and Ulrike Pfaar for the in vitro blood/plasma distribution and plasma protein binding experiments; Thomas Faller, Hans-Joachim Handschin, Barbara Handschin, Sven Guldbrandsen, Marc Raccuglia, and Serge Winter for the dog and rat bile study experiments; Lukas Oberer for editing of the NMR spectra; and Harlan Ltd. (Itingen, Switzerland) for support with radioactivity measurements of excreta.
Authorship Contributions
Participated in research study design: Walles, Krauser, Ocwieja, Woessner, Chakraborty, Swart.
Conducted experiments: Walles, Wolf, Ritzau, Leuthold.
Contributed new reagents or analytic tools: Wolf, Ritzau, Carcache, Kittelmann.
Performed data analysis: Walles, Wolf, Jin, Leuthold, Gschwind.
Wrote or contributed to the writing of the manuscript: Walles, Wolf, Jin, Ritzau, Gschwind, Ufer, Woessner, Swart.
Footnotes
- Received January 24, 2013.
- Accepted June 13, 2013.
This work was supported by Novartis Pharma AG.
Abbreviations
- ADME
- absorption, distribution, metabolism, and excretion
- AFQ056
- mavoglurant
- AUC
- area under the concentration-time curve
- AUC0–inf
- AUC from time 0 to infinity
- CL
- clearance
- HLM
- human liver microsomes
- HPLC
- high-performance liquid chromatography
- LC-MSE
- liquid chromatography coupled to mass spectrometry with collisional energy switching in collision cell
- LC-MS/MS
- liquid chromatography coupled to tandem mass spectrometry
- LC-RAD-MS
- HPLC coupled to offline radioactivity detection and mass spectrometry
- LID
- L-dopa induced dyskinesia
- mGLuR5
- metabotropic glutamate receptor 5
- P450
- cytochrome P450
- PD
- Parkinson disease
- PK
- pharmacokinetic
- ROESY
- rotating-frame nuclear Overhauser effect correlation spectroscopy
- TOCSY
- total correlation NMR spectroscopy
- t1/2
- terminal half-life of elimination
- Copyright © 2013 by The American Society for Pharmacology and Experimental Therapeutics


