


Abstract
The antibiotic nitrofurantoin is transported against an electrochemical gradient into milk.A monolayer of CIT3 cells, a subline of the Comma 1D normal mouse mammary epithelial cell line, transports [14C]-nitrofurantoin against a concentration gradient from the basal to the apical solution when grown on membrane filters. In a side-by-side diffusion chamber with well-stirred solutions on both sides, the transfer rate is 50% higher in the basal-to-apical than in the apical-to-basal direction. Nonlabeled nitrofurantoin (500 μM) in the basal chamber equalized the transport in both directions, suggesting that a specific transporter is responsible for the basal-to-apical increment in flux. From inhibition studies, the apparent affinity of this transporter for nitrofurantoin is 50 μM. Changes in pH between 6.4 and 7.8 had no effect on the active transport component of the flux but did affect the passive flux component. Passive flux of the nonionized molecule was 2.6 times faster than that of the ionized molecule, but the ionized molecule did appear to cross the membrane passively. Our findings show that nitrofurantoin is actively transported across a mammary epithelial cell monolayer by a transporter whose affinity for nitrofurantoin does not depend on the anionic charge on nitrofurantoin. The pH dependence of a parallel passive pathway suggests that both nonionized and ionized forms of nitrofurantoin cross the membranes of the mammary epithelial cell by passive diffusion.
The steady-state concentration of the antibiotic nitrofurantoin in rat milk has been shown to be much higher than predicted on the basis of its protein binding and lipid solubility and the pH difference between plasma and milk (Kari et al., 1997). We postulated that the mammary epithelium contains an active transporter responsible for this phenomenon. However, preliminary studies utilizing mammary gland explants failed to reveal any active accumulation of the drug (Kari, unpublished data). We therefore turned to CIT3 cells (Danielson et al., 1984). This line was selected for its ability to form tight junctions when grown as a monolayer on a filter support. Initial studies, carried out with membrane filters placed in a tissue culture well, show that 1) transport from the basal to the apical solution was much faster than transport in the opposite direction, 2) a concentration gradient could be established between the apical and the basal solutions and 3) basal-to-apical, but not apical-to-basal, transport of [14C]-nitrofurantoin was inhibited by nonlabeled nitrofurantoin. To verify that the apparent active transport of nitrofurantoin across CIT3 cells on membrane filters is not due to artifacts of that system and to examine the effects of pH more systematically, we studied nitrofurantoin flux in a side-by-side diffusion chamber in which the filter support with the cell monolayer is placed vertically and separates well-stirred solutions (Hidalgo and Hillgren, 1992). We show that in this system, as in the transwell system, there are three components to the nitrofurantoin flux. A specific flux component is inhibited by nonlabeled nitrofurantoin and is observed only in the basal-to-apical direction. Nonspecific flux components can be divided into a fluid phase component whose transfer coefficient is presumed to be equivalent to that of mannitol and a diffusional component assumed to represent passive transfer across apical and basal membranes. We show that only the latter is affected by changes in pH between 6.4 and 7.8.
The results of studies in both membrane filter and diffusion chamber systems demonstrate active transport of nitrofurantoin across a mammary cell monolayer. This is the first report of a tissue culture model system that demonstrates active drug transport across a mammary epithelium in vitro.
Materials and Methods
Chemicals
The following drugs and chemicals were used in this study: nitrofurantoin [N-(5-nitro-2-furfurylidene)-1-aminohydantoin]; furazolidone [3-(5-nitrofurfurylideneamino)-2-oxazolidinomne] (Sigma Chemical Co., St. Louis, MO), radiolabeled nitrofurantoin (14C, methylene bridge-labeled; 97% radiopure; specific activity = 58.9 mCi/mmol) (Chemsyn Science Laboratories, Lexena, KA) and [3H]-mannitol (30 Ci/mmol) (New England Nuclear, Boston, MA).
Culture Media
For cell growth, Dulbecco’s Modified Eagle’s Medium (DMEM) with Ham’s F12 (50:50) was supplemented with 2% heat-inactivated fetal bovine serum (FBS), 5 ng/ml epidermal growth factor (EGF), 10 μg/ml insulin, 100 U/ml penicillin and 100 μg/ml streptomycin. To differentiate the cells, this growth medium was modified by removal of EGF and addition of 3 μg/ml each of ovine prolactin (National Hormone and Pituitary Program, Rockville, MD) and hydrocortisone (Sigma Chemical Co. St. Louis, MO). The modified medium was designated the secretion medium.
Culture of CIT3 Cells
CIT3 cells.
The CIT3 cells used in this study were derived from Comma 1D cells, a normal mouse mammary cell line that synthesizes casein in response to prolactin (Danielsonet al., 1984). The original Comma 1D culture was heterogeneous and did not form a tight epithelium when grown on appropriate filter supports. Triple trypsinizations (Schmidhauseret al., 1990) with selection for a high junctional resistance when grown on filters resulted in the “CIT3” cell line. These cells form a confluent monolayer with a transepithelial resistance of 800 to 1500 ohm · cm2 when grown for 2 or more weeks on collagen or polycarbonate filter supports. They remain heterogeneous, and approximately 50% of the cells respond to prolactin by immunocytochemistry for mouse β-casein (data not shown).
For the membrane filter transport experiment, the cells were grown on Transwell-COL cell chamber inserts (Costar Cambridge, MA). These inserts are collagen-coated, measure 24.5 mm in diameter and have a pore size of 3.0 μm. Each transwell was placed in an individual well in a 6-well cluster plate (Costar). To maintain hydrostatic pressure equilibrium, we added 1.5 ml of medium to the top and 2.5 ml to the bottom chamber formed by the filter for both growth and experimental purposes. The cells were seeded on the filters at half the density of the parent culture plate and grown to confluence (6–7 days) in growth medium. They were then transferred to secretion medium and grown for 6 to 7 days more until they achieved high transepithelial resistance. Preliminary measurements of the transepithelial electrical resistance were obtained with an ohmmeter outfitted with chop-stick electrodes (Precision Scientific) and designed specifically for this purpose.
For experiments in the diffusion chamber, cells were plated at a 1:1 density on “Snapwell” polycarbonate filter inserts (Costar). These inserts, made to fit in the diffusion chamber described below, had a area of 1 cm2 and a pore size of 3.0 μm. Culture conditions were identical to those described above for the transwell filters.
[14C]-Nitrofurantoin Transport Experiments
Experiments on transwell filters.
Approximately 2 × 10⁴ dpm each of [14C]-nitrofurantoin and [3H]-mannitol were placed in the top or bottom chamber of the culture well and maintained at 37°C in an incubator outfitted with a platform rocker rocking at about 1 Hz. The chamber receiving the initial radioactivity is called the donor chamber. Samples (5% of the total volume in the chamber) were pipetted from the opposite, or receiver, chamber at hourly intervals for counting. An equal volume of nonlabeled medium was added to this chamber to maintain hydrostatic equilibrium. At the termination of the experiment, both chambers were sampled. Unless otherwise stated, no nonlabeled nitrofurantoin or mannitol was added to either chamber; from the specific activity stated by the manufacturer, the molar concentrations in the donor chamber were 0.5 to 2.0 × 10⁻⁶ M for nitrofurantoin and 1 to 2 × 10⁻⁹ M for mannitol. The concentration of [3H]-mannitol in the donor chamber varied no more than 10% over the course of an 8-hr experiment. The same was true for the concentration of [14C]-nitrofurantoin when the apical chamber served as the donor chamber. The concentration of nitrofurantoin in the basal chamber when it served as the source of nitrofurantoin declined about 50% over the same time period, as expected from the high rate of transport. However, the total [14C]-nitrofurantoin in the two chambers did not change during the course of the experiment. These observations indicate that binding to cells or culture dishes is not a problem at these low concentrations of drug.
Experiments in the diffusion chamber.
For more precise studies of transport rates under conditions where unstirred layers could be minimized and the resistance of the monolayer determined accurately, the cell monolayers were placed in a Costar diffusion chamber set-up in which the filter was held vertically in such a way as to separate two side-by-side chambers (Hidalgo and Hillgren, 1992). The medium used in the experiments was DMEM:F12 50:50 with no addition of serum or hormones. The assembled chambers were placed in a heat block to maintain the solutions at 37°C. The 5 ml of solution in each chamber was stirred rapidly by a gas-lift arrangement utilizing 5% CO2 and oxygen. The gas pressure was adjusted so that the gas bubbled through the chamber at the maximal rate possible without splashing or foaming outside of the chamber. Protein-free solutions were necessary to avoid an unacceptable degree of foaming. Resistance was measured in this system by utilizing symmetrically placed current-passing and voltage-monitoring electrodes that provided an analytically correct measure of transepithelial resistance. Only data from filters with a transepithelial resistance greater than 400 ohm · cm2 before and after the experiment are presented. The relation between resistance and mannitol flux is shown in figure1. At resistances above 300 ohm · cm2, the mannitol transfer coefficient (see below) was less than 14 × 10−3 cm/hr in all but one filter of those plotted here. Data from the few filters that showed mannitol transfer coefficients greater than this value were not used.

The relation between transepithelial resistance and mannitol flux in the diffusion chambers. Each point represents one filter.
After approximately 1 hr for equilibration of the system, the isotopes (20,000–300,000 dpm/ml) were placed in one side or the other of the chamber to measure transfer in the apical or basal direction as desired, and 100-μl samples were taken from each chamber at 10- to 20-min intervals. The flux was linear up to at least 3 hr (data not shown). However, most experiments were carried out for 2 hr, and the slope of the time course was used to calculate the rate of transfer from the donor to the receiver chamber. Because of the large volume of the solutions compared with the area of the filter, the concentration of isotope in the donor chamber did not change significantly over the 2-hr experiment. The amount of nitrofurantoin transferred from the donor to the receiver chamber was calculated from the equation
Effect of pH on transport parameters.
To examine the effect of pH on both nonspecific and specific transport, we carried out the following experiment. All solutions were equilibrated with 95% O2/5% CO2 and then adjusted to pH 7.4 before being placed in the chamber. After 1 hr for temperature equilibration, [14C]-nitrofurantoin and [3H]-mannitol were added to either the apical or the basal chamber. Isotope flux was allowed to proceed for 1 hr, samples being taken at 1, 20, 40 and 60 min. Sufficient 1 M HCl or NaOH was then added to both chambers to adjust the pH to a predetermined level. In some experiments, sufficient nonlabeled nitrofurantoin to bring the concentration to 500 μM, the highest concentration of nonlabeled nitrofurantoin possible in aqueous solution, was added to the basal chamber simultaneously with the pH change. The experiment was allowed to proceed for another hour, samples being taken at 80, 100 and 120 min from the start. The transepithelial resistance was measured with Ag · AgCl electrodes in each chamber; then the solutions were removed and the pH measured. The pH was within 0.2 unit of the anticipated pH. In separate experiments, we found that pH could be maintained only if both chambers were buffered to the same pH and that, in any case, the epithelium slowly buffered the pH back to 7.4. For this reason, we limited experiments with pH changes to 1 hr and averaged the initial and final pH values in reporting the results.
[14C]-nitrofurantoin quantitation in cell culture media.
To be certain that [14C]-nitrofurantoin was not metabolized during the course of these experiments, CIT3 cells on a membrane filter were incubated overnight with [14C]-nitrofurantoin. The medium was analyzed by high-performance liquid chromatography via the methodology described previously (Kari et al., 1997) for unlabeled nitrofurantoin. The outlet of the absorbance meter was connected to a Flo-one/β radioactive monitor equipped with a 0.5-ml wet cell. Flow-scint II was pumped at the rate of 4 ml/min. All the radioactivity was found in the peak corresponding to authentic nitrofurantoin, which indicates that the drug is not metabolized by the cell line even during a relatively long-term exposure.
Scintillation counting.
Radioactivity was determined by β-scintillation counting with Budget Solve (Research Products International Corp., Mount Pleasant, IL). The windows for double-label counting on the Beckman LS6500 instrument were set for less than 1%3H spillover into the 14C channel and for no more than 18.3% spillover of 14C into the 3H channel. Automatic calculation of disintegrations per minute was used for each sample.
Results
Transfer Across Monolayers on Transwell Filters
Figure 2 shows the 8-hr time courses of [14C]-nitrofurantoin and [3H]-mannitol transport from the bottom to the top chambers separated by confluent monolayers of CIT3 cells grown on transwell filters and, conversely, from the top to the bottom chambers of the transwells. These experiments measure basal-to-apical and apical-to-basal flux, respectively. To compare mannitol and nitrofurantoin fluxes we plotted the concentration of each substrate in the receiver chamber as a fraction of that in the donor chamber. The graph shows that the change in the concentration ratio in either direction was linear over the 8-hr period for both substrates. Mannitol flux, which represents the sum of transfer via the paracellular pathway and fluid phase transcytosis, if it exists in these cells, was less than 3% of the nitrofurantoin flux in the basal-to-apical direction (table1) and about 14% of the flux in the apical-to-basal direction. This indicates that the great majority of the nitrofurantoin reaches the opposite chamber by passive diffusion or active transport through the cells. Figure 2A also shows that the epithelium is capable of establishing a concentration gradient of nitrofurantoin from the apical to the basal solution. The equilibrium level of this gradient is not known because the transfer coefficient began to decline after 8 hr, probably as a result of acidification of the culture medium from metabolic processes. However, a nearly 2-fold gradient was established between the apical and basal chambers in 8 hrs.

Time course of [14C]-nitrofurantoin and [3H]-mannitol transport across mammary epithelial cell monolayers on transwell filters. A) The concentration in the receiving chamber as a percent of that in the donor chamber is plotted for flux in the basal-to-apical direction (B to A; ▴) and in the apical-to-basal direction (A to B; ▿). B) Similar data for mannitol. Each point represents the average of samples from six wells, and the distance between the bars is two S.E.M. Where error bars are not evident, they fall within the data point. The nitrofurantoin concentration in the donor chamber at the beginning of the experiment was 1.1 μM; that of mannitol was about 2 nM.
Coefficients for [14C]-nitrofurantoin and [3H]-mannitol transfer across transwell filters1-a
The data in figure 2 exaggerate the difference between the actual basal-to-apical and apical-to-basal fluxes because of the difference in volume between the upper and lower chambers (1.5 and 2.5 ml, respectively). The actual fluxes were calculated as transfer coefficients as described in “Materials and Methods” (table 1). The transfer coefficient was about 10 × 10−3 cm/hr from apical to basal and 63 × 10−3 cm/hr from basal to apical solution, about a 6-fold difference under the conditions of this experiment.
If the rapid flux of nitrofurantoin across the epithelium from the basal to the apical side is due to a specific transporter for nitrofurantoin, the nonlabeled nitrofurantoin should compete with the [14C]-nitrofurantoin. To test this hypothesis, we studied [14C]-nitrofurantoin flux from basal to apical solutions for 3 hr in the presence of varying concentrations of nonlabeled nitrofurantoin in the basal chamber. This compound inhibited 45% of the flux from the basal to the apical surface with an apparent half-maximal effect at 63 μmol (fig. 3A). As shown in figure 3B, addition of nonradioactive nitrofurantoin to the apical surface had no effect on the flux rate. These observations are consistent with the presence of a specific transporter for nitrofurantoin that acts only on basal-to-apical flux in parallel with a nonspecific pathway in both apical and basolateral membranes (see “Discussion”). However, the observation that nonlabeled nitrofurantoin did not reduce the nonspecific flux from the basal to the apical chamber to the rate of the apical to basal flux suggests that the conditions in the apical and basal chambers differ in some respect.

Effect of inhibitors on [14C]-nitrofurantoin transport from the basal to the apical chamber across CIT3 cells. A) Various concentrations of nonlabeled nitrofurantoin. The line is the best fit to the equation The transfer coefficient, T, is equal to the sum of the transfer coefficient for nonspecific transport, TNS, and the transfer coefficient for specific transport given by the second term. TSP
is the transfer coefficient for specific transport in the absence of inhibitor, [NFT] is the concentration of nitrofurantoin and Ki
, is the inhibitory constant. The best-fitting values by nonlinear least-squares analysis for TNS
,TSP
and Ki
were 29 × 10−3 cm/hr, 23 × 10−3 cm/hr and 63 μM, respectively. Labeled nitrofurantoin was present at 1.45 μM in the donor chamber. B) The effect of 250 μM nitrofurantoin on transport in the apical-to-basal and the basal-to-apical directions. Labeled nitrofurantoin was present at 1.45 μM in the donor chamber. C) The effect of congeners of nitrofurantoin on transport in the basal-to-apical direction. Labeled nitrofurantoin was present at 1.66 μM in the donor chamber.
The transfer coefficient, T, is equal to the sum of the transfer coefficient for nonspecific transport, TNS, and the transfer coefficient for specific transport given by the second term. TSP
is the transfer coefficient for specific transport in the absence of inhibitor, [NFT] is the concentration of nitrofurantoin and Ki
, is the inhibitory constant. The best-fitting values by nonlinear least-squares analysis for TNS
,TSP
and Ki
were 29 × 10−3 cm/hr, 23 × 10−3 cm/hr and 63 μM, respectively. Labeled nitrofurantoin was present at 1.45 μM in the donor chamber. B) The effect of 250 μM nitrofurantoin on transport in the apical-to-basal and the basal-to-apical directions. Labeled nitrofurantoin was present at 1.45 μM in the donor chamber. C) The effect of congeners of nitrofurantoin on transport in the basal-to-apical direction. Labeled nitrofurantoin was present at 1.66 μM in the donor chamber.
To obtain some information about the specificity of the putative nitrofurantoin transporter, we tested the effect of the nitrofurantoin congeners furaltadone and furazolidone, at concentrations of 250 μmol, on the flux of labeled nitrofurantoin from basal to apical solutions (fig. 2C). Both were inhibitory, furaltadone inhibiting transport by about 33% and furazolidone by 31% compared with 43% inhibition by an equimolar concentration of nitrofurantoin.
Nitrofurantoin Transport Across Mammary Monolayers in the Diffusion Chamber
Cells on transwell filters may not give an accurate picture of fluxes across an epithelial monolayer, because both unstirred fluid layers and metabolites may alter the flux characteristics. For these reasons, we continued our experiments utilizing the diffusion chamber described in “Materials and Methods.” The time course of [14C]-nitrofurantoin transfer in both directions across CIT3 monolayers mounted in the diffusion chamber is shown in figure 4A. The flux is linear for at least the 2 hr shown. The concentration of isotope in the donor chamber was constant after the first sample at 1 min, which indicated rapid mixing within the chamber and no significant loss of isotope due to adsorption to the walls of the chamber or evaporation (data not shown). The transfer coefficient from the basal to the apical chamber was 64.5 × 10⁻³ cm/hr, approximately 50% greater than the transfer coefficient for flux from the apical to the basal chamber, 41.7 × 10⁻³ cm/hr (table 2). Addition of 500 μM nonlabelled nitrofurantoin reduced the basal-to-apical flux such that the transfer coefficient was similar to that in the apical-to-basal direction. Unlabeled nitrofurantoin had no effect on apical-to-basal flux. The mean mannitol transfer coefficient was 6 to 8 × 10⁻³ cm/hr, approximately 25% of the passive nitrofurantoin transfer coefficient. It was not significantly different in the two directions (table 2). Because mannitol does not cross plasma membranes and its size is similar to that ofnitrofurantoin, its passage sets an upper limit for nitrofurantoin transfer between the cells (paracellular transfer).

Time course of [14C]-nitrofurantoin transfer across CIT3 monolayers in a side-by-side diffusion chamber. The concentration of [14C]-nitrofurantoin in the source chambers was 1.8 to 1.9 μM. ○, •: transfer from basal to apical solutions; □, ▪; transfer from apical to basal solutions; •, ▪: no nonlabeled nitrofurantoin present; ○, □: 500 μM nonlabeled nitrofurantoin present.
[3H]-mannitol and [14C]-nitrofurantoin transfer coefficients in the diffusion chamber
Concentration Dependence of Nitrofurantoin Inhibition of [14C]-Nitrofurantoin Flux
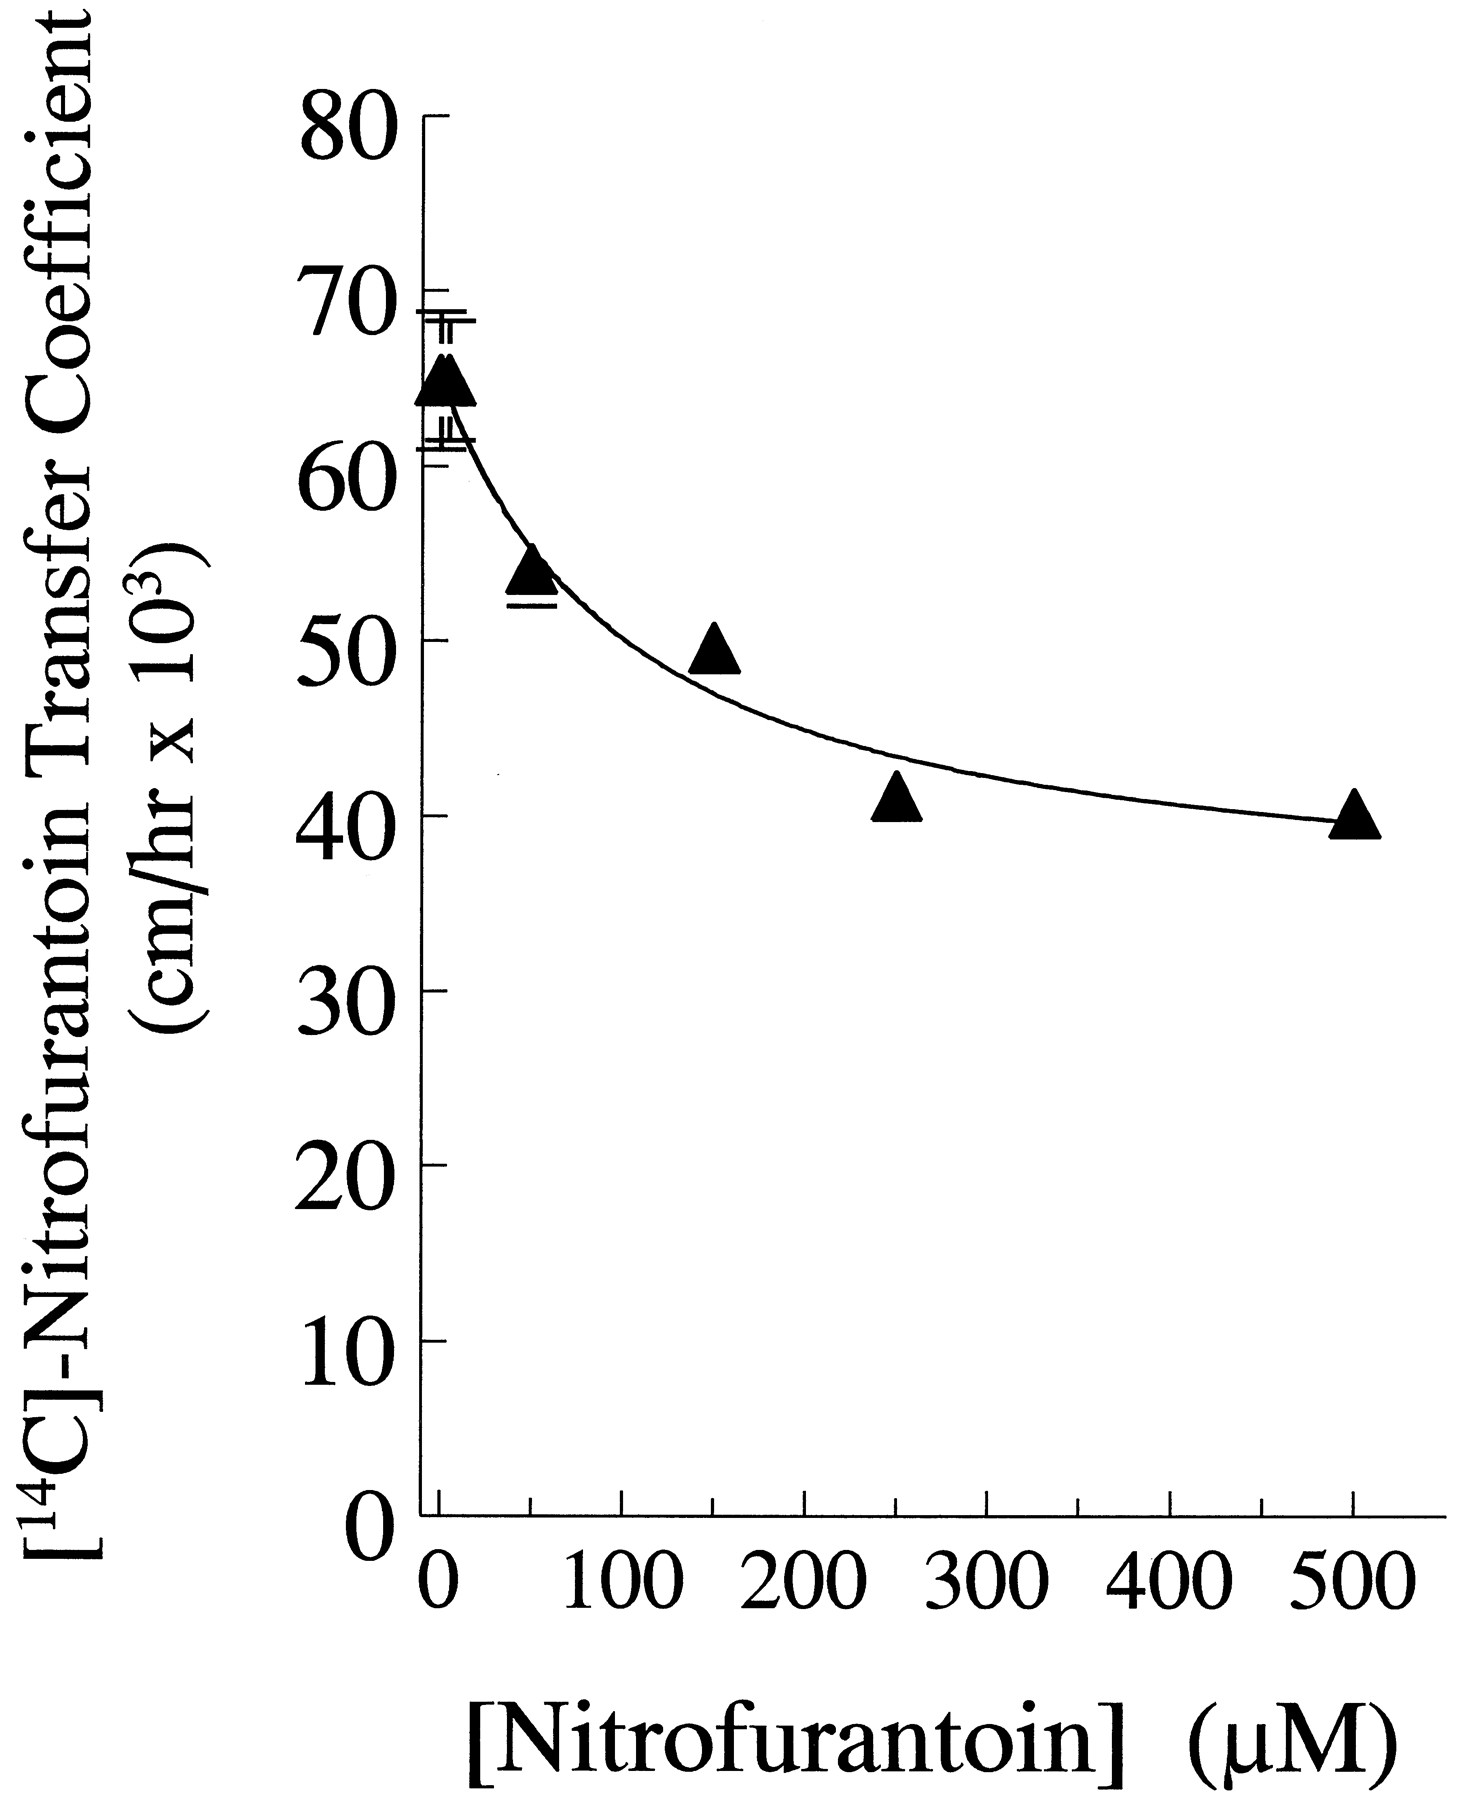
The relatively high proportion of nonspecific transfer of nitrofurantoin precluded a kinetic analysis of fluxes using increasing amounts of isotope. In order to compare the affinity of nitrofurantoin for the proposed specific transporter in the diffusion chamber with the results obtained from the transwell experiment, we again examined the concentration dependence of nitrofurantoin inhibition of isotopic flux (fig. 5). Increasing concentrations of nonlabeled nitrofurantoin decreased the basal-to-apical transfer coefficient from about 64 × 10−3 to 39 × 10−3cm/hr with an inhibitor coefficient (Ki ) of about 50 μM. Because it was necessary to average over several experiments performed on different sets of cultures, the precision of the replicates in the diffusion chamber is not so good as that of the transwell filters. The remainder of the flux appeared to be nonspecific. From the mannitol transfer coefficient (table 2), the paracellular (and transcytotic, if it exists) component would have a transfer coefficient of about 9 × 10⁻³ cm/hr. We postulate that the remaining flux component represents passive transfer across the apical and basal plasma membranes and has a transfer coefficient of about 30 × 10−3 cm/hr.

The effect of nonlabeled nitrofurantoin on the transfer of [14C]-nitrofurantoin across the CIT3 monolayer in the diffusion chamber. The points present the mean of 2 to 4 determinations per concentration. The line was drawn as in figure 2A. The best-fit coefficients by least-squares analysis were TNS = 38 ± 5 × 10⁻³ cm/hr, Ts = 26 ± 5 × 10⁻³ cm/hr and Ki = 53 ± 41 μM.
Effect of pH on Transport Parameters
Figure 6 shows the effect of pH on basal-to-apical flux in the presence and absence of 500 μM nitrofurantoin, as well as the effect on apical-to-basal flux. All curves are similar in shape and can be fit by the following equation:
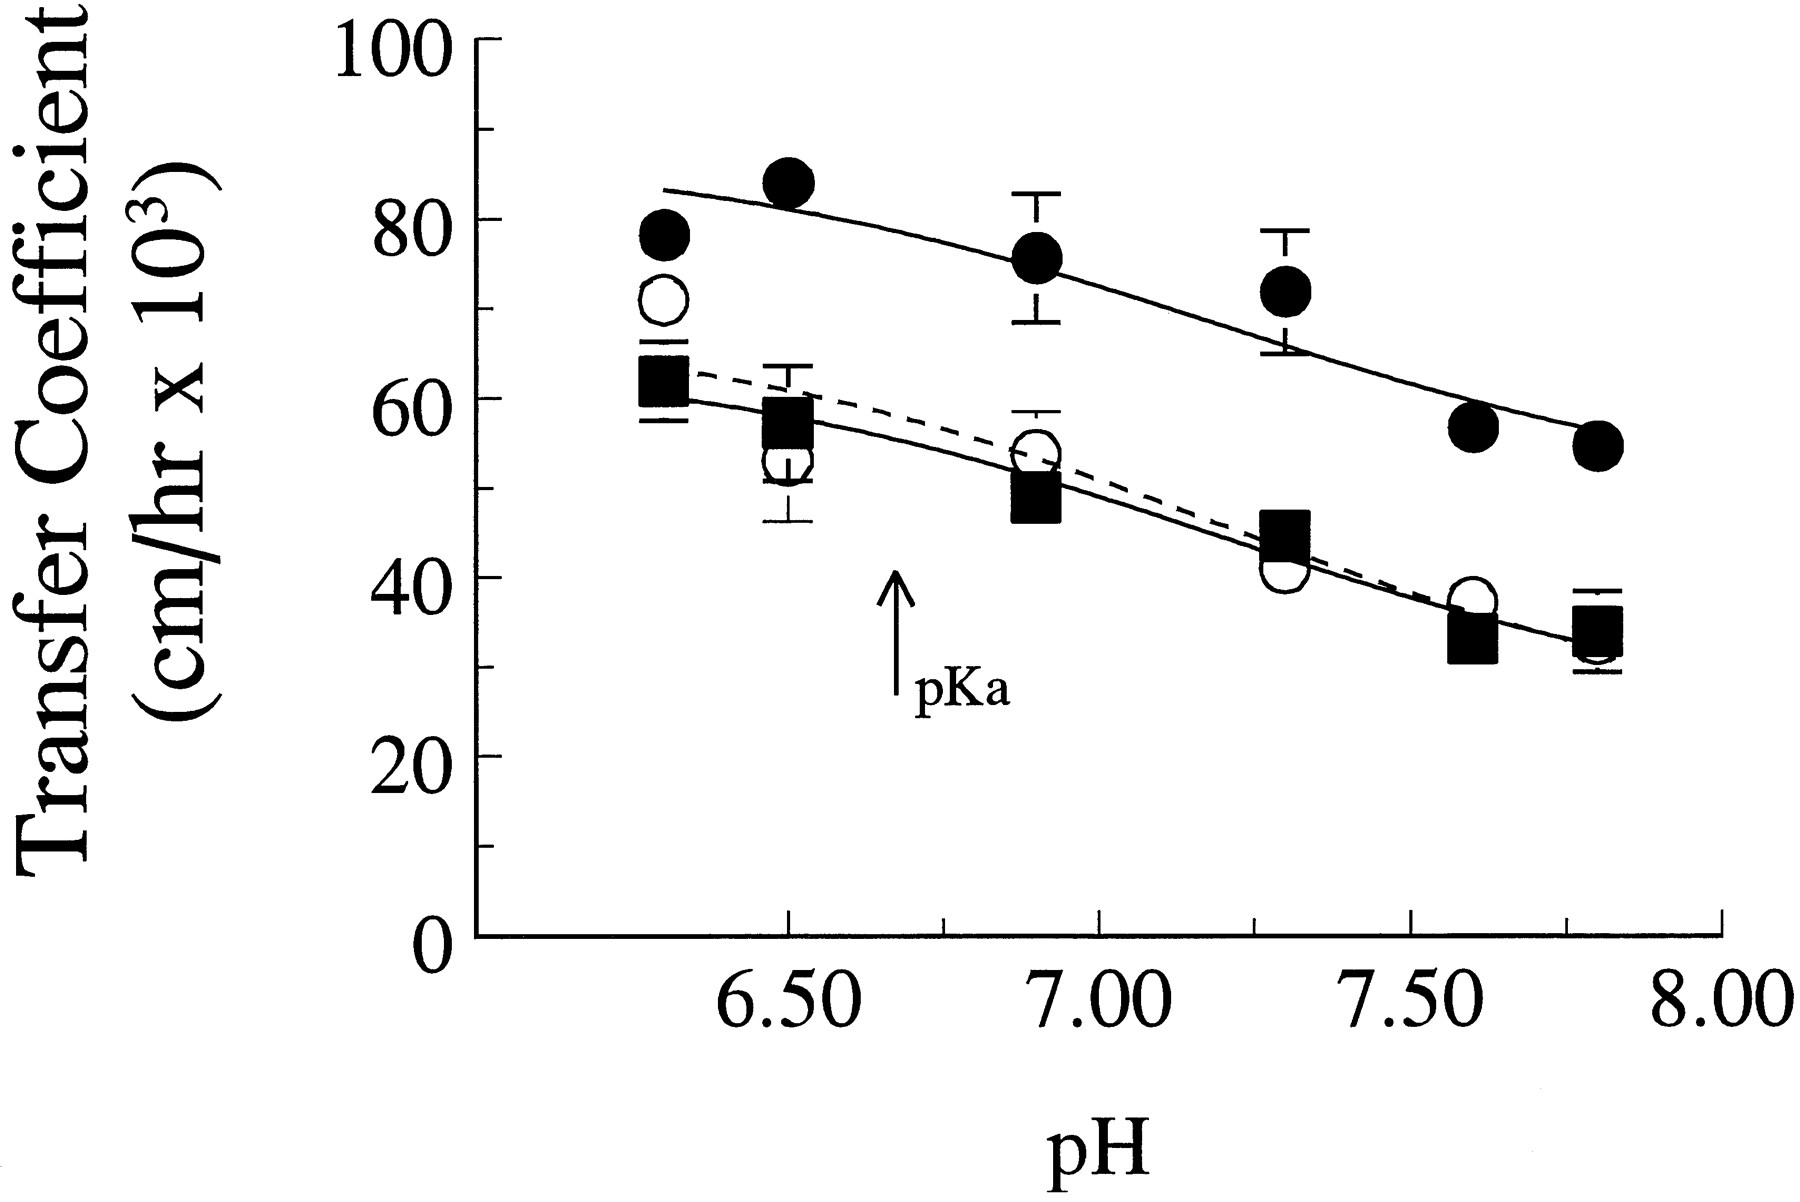
The effect of pH on the transfer of nitrofurantoin across monolayers of CIT3 cells in the diffusion chamber. Points are the mean of two or three experiments done at 6-month time intervals. Curves are theoretical as described in the text. Symbols are as in figure 4.
Transfer coefficients to fit pH curves in figure 6
Discussion
In previous work, we showed that nitrofurantoin is transported against a concentration gradient into rat milk (Kari et al., 1997). To define the nature of the transporter, we undertook in vitro experiments with a line of normal mouse mammary cells that were selected for their ability to form tight junctions. Using transwell filters, we found that these cells transported nitrofurantoin 6 times as fast in the apical direction as in the basolateral direction. Using nonradioactive nitrofurantoin as an inhibitor, we found that approximately 45% of the transfer from the basolateral to the apical chamber was inhibited at high concentrations of nitrofurantoin (500 μM), whereas transfer in the opposite direction was not inhibited by the nonlabeled nitrofurantoin. Similar but not identical results were obtained when the experiments were carried out in a diffusion chamber. These observations are consistent with a model (fig. 7) in which passive transfer of the drug across both apical and basal plasma membrane proceeds in parallel with an active transport pathway.
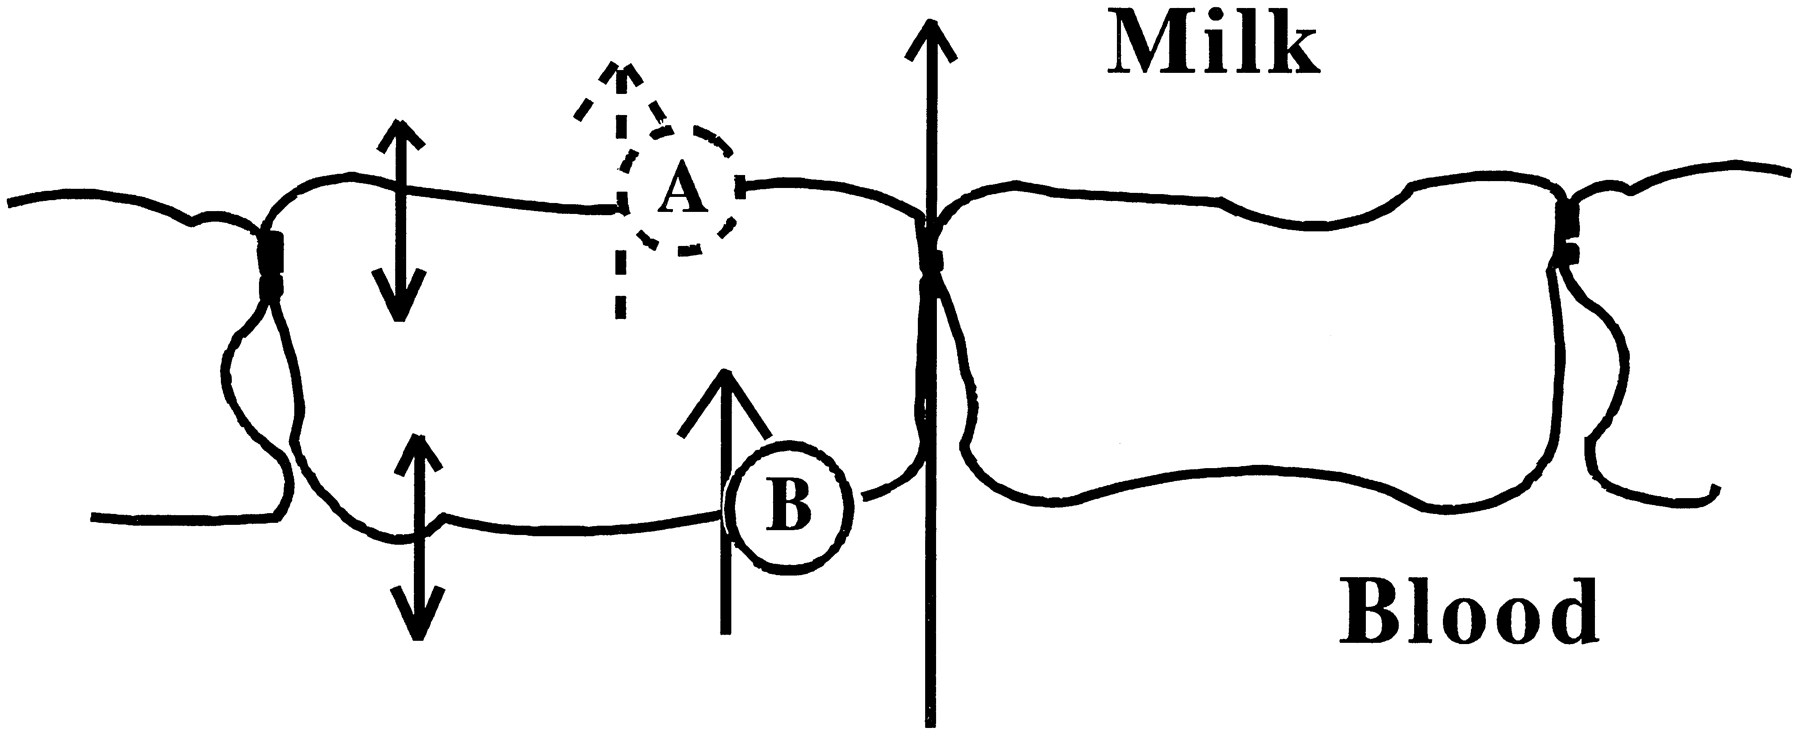
Model for nitrofurantoin transport across the mammary epithelium showing several mammary epithelial cells joined by tight junctions. Nitrofurantoin could cross between the cells viathe paracellular pathway or across the cells by a diffusional or transport pathway through the membranes. The active transporter could be localized in either the apical (A) or the basolateral (B) membrane.
These flux differences persist in a side-by-side diffusion chamber setup where excellent stirring is possible and hydrostatic pressures on both sides of the filter are equal at all times. In addition to making excellent stirring possible, the diffusion chamber setup offers other advantages: flux rates can be easily monitored by removing a small portion of the solutions on either side of the filter at regular intervals, and constant monitoring of transepithelial resistance is possible. In the diffusion chamber, fluxes were linear during the period of the experiments, and mannitol flux, which represents transfer between the cells, averaged less than 25% of the passive flux rate under all conditions. Furthermore, addition of 500 μM nitrofurantoin to the solution bathing the basal surface of the cells equalized the fluxes in the two directions. The inhibitor constantKi , 50 μM, was not significantly different from the inhibitor constant of 63 μM found using transwell filters. On the other hand, the apical-to-basal transfer coefficient was about 43 × 10−3 cm/hr compared with about 10 × 10−3 cm/hr in the diffusion chamber. The basal-to-apical flux rate was 60 to 65 × 10−3 cm/hr, rather faster than expected on the basis of the apical flux, and was reduced to 35 to 45 × 10−3 cm/hr in the presence of 500 μM nitrofurantoin in both types of chamber. We postulate that the pH in the restricted space below the filter in the transwell setup may be more acidic than the rest of the solution in the chamber, thereby enhancing passive flux from the basal to the apical solution.
It is important to understand the advantages and limitations of the transwell and diffusion chamber setups. Transwell filters have the advantage that no special equipment is necessary to study fluxes other than the tissue culture wells in which the cells are grown. Furthermore, it is possible to handle many filters in one experiment, which makes possible several replicates for each experimental condition. The fact that the Ki values for the effect of nonlabeled nitrofurantoin on the basal-to-apical flux were similar in the two setups suggests that the transwell filter system is suitable for screening inhibitors, a necessary step in determining the physiological substrate for this transporter. However, absolute flux rates cannot be determined reliably in this system, because adequate stirring may not be possible, and metabolites or hydrogen ion may build up in the limited space beneath the filter, altering the flux rates. For such determinations the diffusion chamber setup is essential, because it provides well-stirred solutions on both sides of the filter and because the volumes of solution are larger, which minimize the effect of metabolites. However, no more than six filters can be studied in a single experiment, a drawback that seriously limits the number of replicates possible at any one time.
The model shown in figure 7 illustrates three potential paths for the transfer of nitrofurantoin across the mammary epithelium: a paracellular pathway, a passive transcellular pathway and an active transport pathway. Transfer via the paracellular pathway was monitored by the transfer of mannitol across the epithelial monolayer and was uniformly low, achieving a concentration of 1% of the source chamber in 2 hr, a result consistent with the high electrical resistance of these monolayers. Transfer via the passive pathway—that is, the fraction of transfer that could not be inhibited by nonisotopic nitrofurantoin—was significant and, at the concentration of [14C]-nitrofurantoin used in these experiments, was of the same order of magnitude as the flux through the active pathway. In more recent experiments, we have found that allowing the cells to grow on the filters for the diffusion chamber for a longer time increases the transepithelial resistance. Under these conditions, the active portion of the flux was about double the passive flux (data not shown).
The location of the active transporter is not clear from the present experiments. A basal location (pump B in fig. 7) is the most parsimonious explanation for the effects of basal inhibitors and would suggest an analogy to the renal organic anion transporter (Pritchard and Miller, 1992). However, an active transporter in the apical membrane that pumps nitrofurantoin out of the cell is also a possibility (pump A in fig. 7). One might expect inhibition of an apical pump with nonlabeled nitrofurantoin to increase the apical-to-basal flux rate; a slight increase was observed in the diffusion chamber (table 2).
This is the first report of active transport of a pharmaceutical agent across a model mammary epithelium in vitro, although a number of compounds have been found at high milk-to-plasma ratiosin vivo (see Kari et al., 1997 for review). The largest apical-to-basal ratios we have been able to achieve in thein vitro system are about 3 at steady state, rather than the 23 observed in in vivo experiments in the rat. There are a number of possible explanations for this observation. The most likely is that the number of transporters per cell in the rat mammary epithelium is greater than the number in CIT3 cells, which increases the ratio of active to passive flux in vivo. Another difference between the in vivo transport results and the in vitro effects of inhibitors is that neither furazolidone nor furaltadone establishes large gradients across the rat mammary epithelium, although they are effective inhibitors of nitrofurantoin transport in vitro. A high milk-to-plasma ratio requires a high ratio of active transport to passive transport at the drug concentrations found in plasma. Possibly these analogs have a higher passive flux rate than nitrofurantoin, such that the gradient is dissipated. This seems quite likely for the nonpolar molecule furazolidone. On the other hand, the affinity of the compound for the transporter may also be lower so that active transfer is lower at concentrations achievable in plasma.
The lack of effect of pH on the specific component of nitrofurantoin flux was at first somewhat surprising, because we expected the putative nitrofurantoin transporter to recognize the anionic character of this molecule. However, Ullrich and Rumrich (1992) have recently shown that the charge on organic anions does not alter recognition by the renal organic anion transporter. In agreement with this concept, we found (Kari et al., 1997) that both a neutral analog of nitrofurantoin (furazolidone) and a basic analog (furaltadone) inhibited [14C]-nitrofurantoin transport to nearly the same extent as nonlabeled nitrofurantoin. We conclude that, like the renal organic anion transporter, the specificity of the mammary nitrofurantoin transporter does not reside in the anionic charge on the molecule. Inhibitor experiments to be published elsewhere suggest that, like the renal organic anion transporter (Ullrich and Rumrich, 1992;Ullrich and Rumrich, 1988) the nitrofurantoin transporter interacts with a large variety of therapeutic agents. However, additional experiments are necessary to determine to what extent the biology of the nitrofurantoin transporter is, in fact, similar to that of the renal organic anion transporter (Pritchard and Miller 1992), and molecular cloning (Wolff et al., 1992) will be necessary to determine whether nitrofurantoin transport is the result of expression of the renal anion transporter in the mammary epithelium.
The results of these experiments were also surprising in that they show that the ionized form of nitrofurantoin is transferred passively (or at least at equal rates in both directions) across the mammary epithelium, though at a slower rate than the nonionized form. We postulate that both forms of the molecular can pass into and out of the cell by diffusion through the plasma membrane. If the charge on the ionized form is diffusely distributed on the molecule, then interactions with water may be sufficiently weak that transfer into the hydrophobic interior of the membrane is energetically feasible. If this is the case, then the usual theoretical framework (Oo et al., 1995;Fleishaker and McNamara, 1988) for calculating the milk-to-plasma ratio must be revised. In theory, the milk-to-plasma ratio for drugs that are passively transferred into milk takes into account entrapment of the drug in the milk fat globule and binding of drug to plasma and milk proteins and explicitly states that only the nonionized form of the drug is able to cross the epithelial membranes. If the ionized form of the drug is also able to cross the mammary membranes, then the effect of the differential in pH between milk and plasma on the milk-to-plasma ratio will be reduced, but not eliminated.
Perspective
Our studies of the effect of pH on the transfer of nitrofurantoin into milk show that, like the renal anion transporter, the specificity of the mammary nitrofurantoin transporter does not reside in the anionic charge on the molecule. This finding and the apparent broad specificity of the transporter (Toddywalla and Neville, unpublished observations) suggest that the renal organic anion transporter or a similar molecule is present in the mammary epithelium. The easy accessibility of the tissue and our ability to characterize nitrofurantoin transport functionally suggest that expression cloning of the transporter by using mRNA from CIT3 cells is feasible. From a practical standpoint, these studies and inhibitor studies may help us predict which drugs are likely to be actively transported into milk. This information should be important both to breast-feeding mothers, some of whom must take therapeutic agents, and to dairy farmers, who are still in great need of improved antibiotic therapies against mastitis.
Acknowledgements
The authors thank Sean Gavigan, A. R. Martin, P. McNamara and J. C. Pritchard for helpful discussion and Valerie Sawicki for crucial assistance with the tissue culture techniques.
Footnotes
-
Send reprint requests to: Margaret C. Neville, Ph.D., Department of Physiology, Box C240, University of Colorado Health Sciences Center, Denver, CO 80262.
-
↵1 The work presented here was supported in part by NIH grant HD 19547 to M.C.N. and by a Research Fellowship from the World Health Organization to V.S.T.
- Abbreviations:
- CIT3
- a subline of the Comma 1D normal mouse mammary cell line
- EGF
- epithelial growth factor
- Received July 8, 1996.
- Accepted October 3, 1996.
- The American Society for Pharmacology and Experimental Therapeutics


