


Abstract
The bioavailability after oral administration of (S)-(-)-2,8-dimethyl-3-methylene-1-oxa-8-azaspiro [4,5] decane-l-tartarate monohydrate (YM796), which is being developed as an antidementia drug, at a dose of 1 mg/kg was very low (3.4%) in rats, but considerably higher (16.1%) in dogs. The oral clearances (CLoral, Dose/AUCoral) in rats and dogs were, respectively, 300 and 18 times more than that already reported in humans. We have previously reported successful attempts to predict the in vivohepatic metabolic clearance of YM796 from in vitro data in humans. In our study, the in vitro metabolism of YM796 was determined using liver microsomes prepared from both rats and dogs and we also investigated if the species difference observedin vivo could be quantitatively reproduced in vitro. In rats, total metabolite formation could be described by single component kinetics with a Km of 13.4 μM and a Vmax of 520 nmol/min/g liver. However, in dogs, total metabolite formation could be described by three components, as also reported for humans. TheKm and Vmax values for the high-affinity, low-capacity component (Km1 and Vmax1) in dogs and humans were, respectively, 8.1 and 1.7 μM, and 10.9 and 1.2 nmol/min/g liver. The overall intrinsic metabolic clearances estimated from the in vitro studies (CLint,in vitro) for rats and dogs were 38.8 and 2.6 ml/min/g liver, respectively, being approximately 40 and 3 times more than that previously reported for humans (0.94 ml/min/g liver). The overall intrinsic hepatic clearances (CLint,in vivo) calculated from in vivo CLoral were 30.4, 3.4 and 0.73 ml/min/g liver for rats, dogs and humans, respectively, indicating that the in vivo hepatic clearance of YM796 can be predicted from in vitro metabolism data in each species. Thus, the pronounced species difference in the metabolic clearance observedin vivo can be quantitatively predicted from in vitro metabolic data using liver microsomes, and was predominantly due to the large difference in the Vmaxvalues.
Because most of drugs are eliminated from the body predominantly by hepatic metabolism and/or renal excretion, it is important to be able to predict the CLh and CLr in humans. Application of the method for animal-scaling has been successful in predicting CLr in humans for many drugs using information obtained from animal experiments (Dedrick, 1974; Boxenbaum, 1982; Sawada et al., 1984). The application of animal-scaling to the prediction of CLh, however, is limited because of large interspecies differences in the CLint (Boxenbaum, 1980; Lin, 1995).
Rane et al. (1977) and Wilkinson (1987) proposed an alternative method for predicting in vivoCLh from in vitro metabolism data using liver microsomes or isolated hepatocytes in rats, taking into consideration the Qh and fb. We have also reported successful attempts to predict the in vivo CLh in rats for 14 drugs metabolized by CYP (Sugiyama et al., 1988; Sugiyama and Iwatsubo, 1994). We recently reviewed a method for predictingin vivo CLh from in vitrometabolism data in detail and suggested that the “in vitro/in vivo scaling” method is also useful in humans for various drugs that are metabolized by CYP in the liver, based on the extensive literature on in vitro and in vivo metabolism (Iwatsubo et al., 1996). In this light, we have identified several important factors which should be taken into account to improve the predictability (Iwatsubo et al., 1997a, Suzuki et al., 1995).
In our study, we examined the interspecies difference in the metabolic clearance of a model drug, YM796 (fig.1), which is being developed for the treatment of dementia, both in vitro and in vivo. We calculated CLint,in vitro and CLint,in vivo using in vitro andin vivo metabolism data in rats and dogs. We compared the parameters obtained with those previously reported for humans (Iwatsuboet al., 1997b), and also examined the possibility of predicting species differences in the in vivo metabolic clearances from in vitro metabolism data.

Chemical structure of YM796
Materials and Methods
Chemicals and reagents.
YM796 and [14C-]YM796 were synthesized by Yamanouchi Pharmaceutical Co., Ltd. (Tokyo, Japan) and by Amersham International (Buckinghamshire, UK), respectively. Acetonitrile, methanol and other reagents of analytical grade were purchased from Wako Pure Chemical Industries, Ltd (Osaka, Japan). NADP, glucose-6-phosphate and glucose-6-phosphate dehydrogenase were obtained from Boehringer Mannheim (Mannheim, Germany). Anti-sera for rat CYP3A2 were purchased from Daiichi Pure Chemicals Co. Ltd. (Tokyo, Japan).
Preparation of rat and dog liver microsomes.
Liver specimens from male F344 rats and/or male Beagle dogs were rinsed with ice-cold 1.15% KCl and homogenized in 100 mM potassium phosphate buffer (pH 7.4). Microsomes were prepared by differential centrifugation, and a 105,000-g pellet was rinsed and resuspended in 100 mM potassium phosphate buffer (pH 7.4). The suspension was divided into aliquots, frozen and stored at -80°C until used.
YM796 metabolism in rat and dog liver microsomes.
YM796 and [14C-]YM796 (1 μM; specific activity, 40 mCi/mmol) were incubated with a reaction mixture (0.25 ml) consisting of 25 μg rat or dog liver MS protein and NADPH-generating system (0.33 mM NADP, 8 mM glucose-6-phosphate, 0.1 U/ml glucose-6-phosphate dehydrogenase, 6 mM MgCl2) in the presence of 100 mM potassium phosphate (pH 7.4). Enzyme reactions were initiated by adding 25 μl NADPH-generating system. After incubation at 37°C in a shaking water-bath for 2 min, the reaction was terminated by adding 250 μl methanol. Experiments were performed in triplicate. YM796 concentrations used to estimate the kinetic parameters were 1 to 1000 μM. After stopping the metabolic reaction, the reaction mixture was centrifuged at 10,000 × g for 5 min then an aliquot of supernatant was spotted on to silica-gel plates (E. Merck, Darmstadt, Germany) to separate metabolites from the parent drug by TLC using chloroform/methanol/27% ammonia (100:10:1) as mobile phase. Quantitation of metabolites was performed using BAS-2000 equipment (Fuji-film, Tokyo, Japan).
Immunoinhibition of YM796 metabolism.
Rat and dog liver microsomes were used at a final concentration of 0.1 mg MS protein/ml and were preincubated for 30 min at room temperature with increasing volumes of anti-sera (from 10 to 80 μl/mg MS protein) for rat CYP3A2 or rat control sera. The final YM796 concentration was 1 μM.
Protein binding of YM796 in rat and dog plasma.
To 2-ml aliquots of rat or dog plasma, 20-μl aliquots of phosphate buffered isotonic solution containing [14C-]YM796 were added to give concentrations of 0.5, 50 and 2500 μM. After incubation for 30 min at 37°C, a 50-μl aliquot was taken from each plasma sample to measure the total plasma concentration and the remainder was transferred to an ultrafiltration tube (Ultrafree CL, Millipore Corp., Bedford, MA). These tubes were centrifuged for 15 min (1000 ×g, 37°C), and then a 50-μl aliquot of filtrate was removed and used to measure the unbound plasma concentration. Aliquots of plasma and filtrate samples underwent liquid scintillation counting with 10-ml liquid scintillator.
Blood-to-plasma concentration ratio (RB) of YM796 in rats and dogs.
The RB of YM796 was determined using heparinized whole blood (Lin et al., 1982). To 1-ml aliquots of rat and dog blood preincubated at 37°C, 20-μl aliquots of phosphate-buffered isotonic solution containing [14C-]YM796 were added to give concentrations of 0.5, 50 and 2500 μM. After incubation for 5 min at 37°C, the blood samples were centrifuged for 5 min at 1500 × g, and then aliquots of plasma underwent liquid scintillation counting with 10 ml liquid scintillator.
Calculation of CLint,in vitro.
The kinetic data for YM796 metabolism obtained with liver microsomes were fitted to equations (1) in rats, and (2), (3) and (4) in dogs using MULTI (Yamaoka et al., 1981) to estimateKm
, Vmax and CLns.
Basic values used for the conversion of intrinsic clearance per mg microsomal protein into that per g liver in rats, dogs and humans
Pharmacokinetics of YM796 in rats and dogs.
Male F344 rats weighing 150 to 200 g were given YM796 i.v. (0.3 mg/kg) or p.o. (1.0 mg/kg). At defined time points after dosing, blood was collected from the inferior vena cava using a heparinized syringe under ether anesthesia. Male Beagle dogs weighing 15.0 to 17.5 kg were also given YM796 i.v. (0.1 mg/kg) or p.o. (1.0 mg/kg). Blood was collected from the cephalic vein using a heparinized syringe at defined time points after dosing. After centrifugation, plasma was separated and stored at -20°C until analysis. An aliquot of plasma (2.5 ml) was buffered with 0.5 ml saturated sodium bicarbonate solution after addition of 0.1 ml aqueous internal standard solution, and the resulting mixture was stirred and applied to a disposable column (Chem Elute, Analytichem International, Harbor City, CA) for liquid-liquid extraction. YM796 was extracted by passing 4 ml dichloroethane through the column twice. The extract was evaporated to dryness under reduced pressure, the residue dissolved in 0.5 ml 0.1N hydrochloric acid and washed with 8 ml diethylether. After stirring and centrifugation, the upper layer (ether) was discarded. To the aqueous layer, 1 ml saturated sodium bicarbonate solution was added and YM796 was extracted from the resulting mixture using 7 ml dichloroethane. After stirring and centrifugation, the aqueous layer was discarded and the organic layer evaporated to dryness. The residue was dissolved in chloroform and a small aliquot (25 μl) was injected into the GC-MS-MS system. GC-MS-MS was performed on a Finnigan MAT (San Jose, CA) TSQ70 triple quadrupole mass spectrometer connected to a gas chromatograph (Varian 3400). Gas chromatography was performed on a phenylmethyl silicone capillary column (DB-17, 15 m 0.25 mm I.D., 0.25 μm, J&W Scientific, Folsom, CA). The column temperature was raised from 50 to 242°C at a rate of 32°C/min. The sheath (nebulizing) gas pressure and auxiliary nitrogen flow were set at 70 p.s.i. (ca. 4.8×10⁵ Pa) and 20 ml/min, respectively. Chemical ionization was performed in the reaction gas (methane) at an ionization voltage of 100 V. The mass spectrometer was set to admit positively charged protonated molecules [M+H]+at m/z 182 (YM796) and m/z 196 (internal standard) via the first quadrupole filter (Q1) with collision-induced fragmentation in Q2 [collision gas argon, -25 eV, 1.5 mTorr (ca. 0.20 Pa)] and monitoring, via Q3, the production of fragments m/z 96 and m/z 110 for YM796 and its internal standard, respectively. Each selected reaction was monitored using a dwell time of 0.2 sec. The AUC values were calculated by the trapezoidal rule, extrapolating to infinity.
Calculation of CLint,in vivo.
CLoral was calculated by dividing the dose by AUCoral, and then CLh was calculated from equation (7) and using a Qh value of 0.95 ml/min/g liver (Bischoff et al., 1971; Dedrick et al., 1973;Montandon et al., 1975) assuming that Fa was 0.88 (estimated in the present study) and CLr was negligible since no parent drug was detected in urine.
Animal scaling.
The CLint,in vivovalues in rats and dogs calculated by the aforementioned method were plotted against the body weight on a log-log scale and the following allometric equation was used to predict CLint,in vivo (ml/min/kg) in humans based on a body weight of 70 kg.
YM796 metabolism in rat small intestinal microsomes.
Microsomes were prepared from rat jejunal mucosa as previously described (Stohs et al., 1976). Under similar conditions to those used for rat and dog liver microsomes except the incubation time (5 and 20 min), YM796 metabolism in rat intestinal microsomes were examined. The final YM796 concentration used was 1 μM.
Estimation of the fraction of unchanged YM796 absorbed from the small intestine.
Male Wistar rats weighing 270 to 280 g were used. After 16 hr fasting, under light ether anesthesia, the abdomen of each rat was opened by a midline incision. The first cannula filled with heparinized normal saline was implanted in the upper part on the portal system through the pyloric vein. The free end of the cannula was drawn out through the midline incision. Simultaneously, the femoral artery of each rat was cannulated. After preparing the proximal jejunal loop (around 5 cm), YM796 solution in potassium phosphate buffer (pH 7.4) was administered to the loop at a dose of 1 mg/kg. Blood samples were collected simultaneously from the portal vein and femoral artery 5, 10, 20, 30, 40 and 60 min after administration and centrifuged at 10,000 × g for 5 min to separate plasma. Unchanged YM796 concentrations in plasma were determined by TLC and a BAS-2000 system in a similar way described above. The Faof unchanged YM796 into the portal system was calculated from the following equation (14) (Fujieda et al., 1996).
Results
Plasma concentration of YM796 in rats and dogs.
All parameters obtained from the in vivo studies in rats and dogs are summarized in table 2. The previously reported parameters for humans (Iwatsubo et al., 1997b) are also shown in table 2 for comparison. The plasma concentration-time profiles of YM796 after i.v. administration (dose: 0.3 and 0.1 mg/kg in rats and dogs, respectively) showed a biexponential behavior in both animals (fig. 2). The CLtot was 3.6 times more in rats compared with dogs. The plasma concentration of YM796 after oral dosing (dose: 1.0 mg/kg in rats and dogs) reached Cmax at approximately 0.5 hr in both animals (fig. 2), and Cmax, AUCoral and the bioavailability in dogs were 4.2, 18 and 4.7 times more than in rats, respectively. A species difference was also observed in the CLoral, which were 300 and 18 times more in rats and dogs, respectively, than in humans (Iwatsubo et al., 1997b).
Pharmacokinetic parameters of YM796 in rats, dogs and humans

Plasma concentration-time profiles of YM796 after i.v. and p.o. administration in rats and dogs. Each point represents the mean ± S.D. of three animals. ○: Plasma concentration-time profiles of YM796 after i.v.administration to rats (0.3 mg/kg). •: Plasma concentration-time profiles of YM796 after i.v.administration to dogs (0.1 mg/kg). ▵: Plasma concentration-time profiles of YM796 after oral administration to rats (1 mg/kg). ▴: Plasma concentration-time profiles of YM796 after oral administration to dogs (1 mg/kg).
YM796 metabolism in rat and dog liver microsomes.
As shown in figure 3, at least four different metabolites of YM796 could be detected by TLC for both of rat and dog microsomes. The Rf values of unchanged YM796 and each metabolite (M1, M2, M3 and M4) were 0.52, 0.12, 0.19, 0.39 and 0.45, respectively, for both animals, the same as the previously reported values for the metabolites formed by human liver microsomes (Iwatsubo et al., 1997b). Eadie-Hofstee plots for total metabolite formation in rat and dog liver microsomes are shown in figure 4. For rats, the formation of YM796 metabolites could be described by a single component with aKm of 13.4 μM and a Vmax of 520 nmol/min/g liver (fig. 4a; table 3). Because Eadie-Hofstee plots for the formation of YM796 metabolites derived from dog liver microsomes showed that multiple metabolic components were involved in YM796 metabolism (fig. 4b), the following three models were tried for data fitting: 1) one saturable and one nonsaturable components (equation (2), 2) two saturable components (equation (3) and 3) two saturable components and one nonsaturable component (equation (4). The kinetic parameters obtained based on each model are shown in table 4. The AIC value was smallest for model 3, indicating that equation (4) gave the statistically best fit of the data.

TLC patterns of YM796 and its metabolites in microsomes prepared from rat, dog and human livers. The final YM796 concentrations used were 1 (A), 30 (B) and 1000 (C) μM. The [14C-]labeled YM796 concentration was kept constant at 8.88×10⁴ dpm/ml (1 μM). Rf values for YM796, M1, M2, M3 and M4 were 0.52, 0.12, 0.19, 0.39 and 0.45, respectively. The human data were taken from Iwatsubo et al., 1997b.
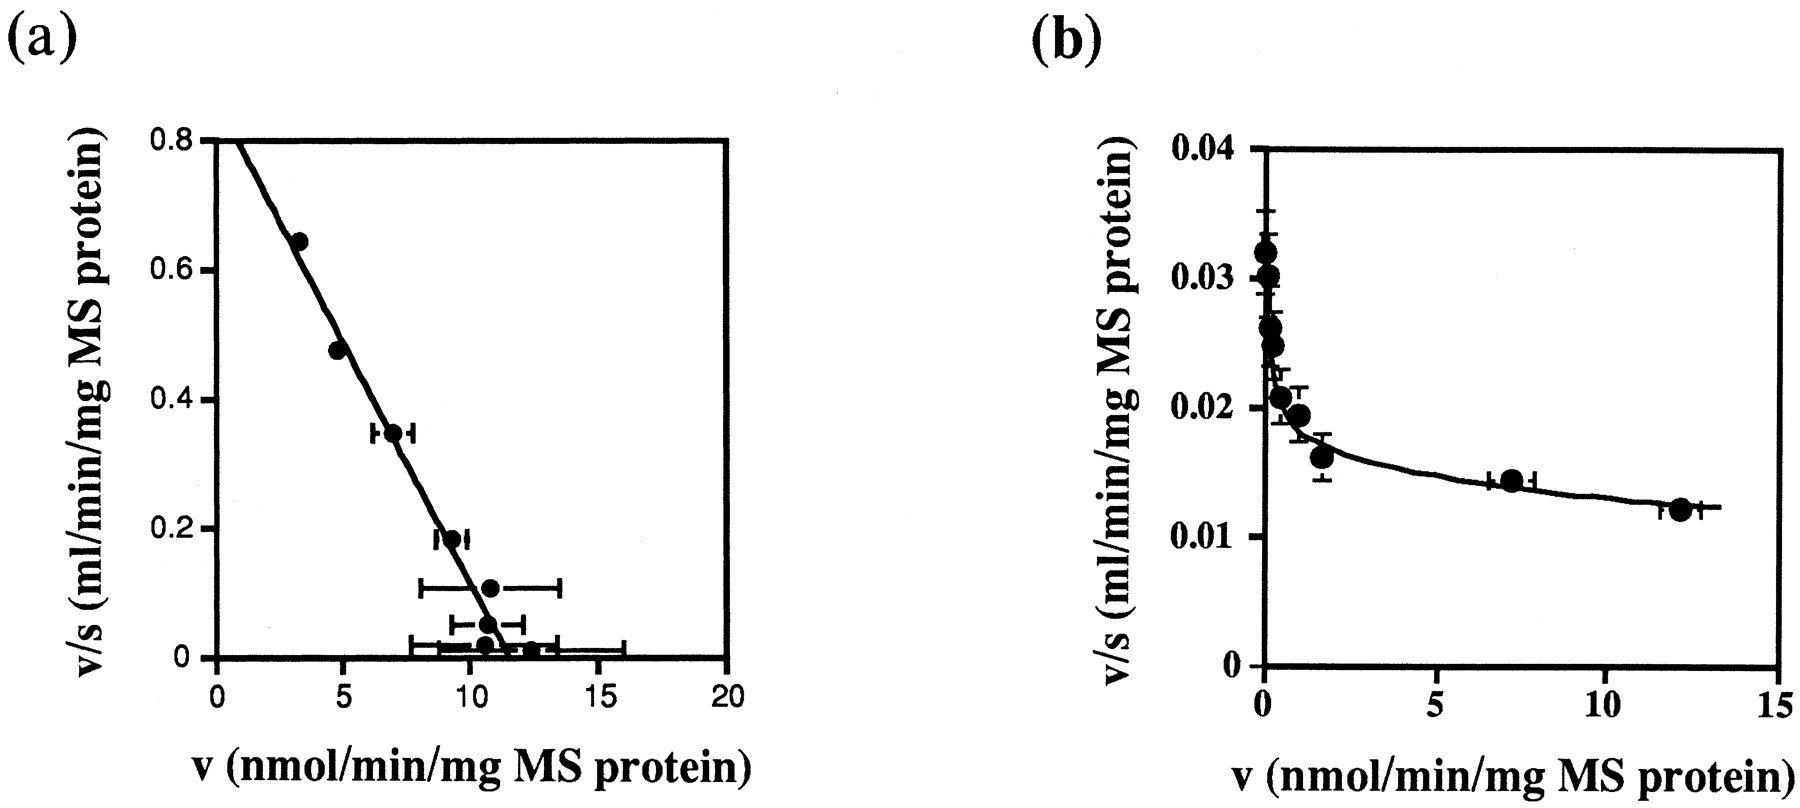
Eadie-Hofstee plots for the formation of total metabolites of YM796 in microsomes prepared from rat (a) and dog (b) livers. YM796 (1 to 1000 μM) was incubated for 2 min at 37°C with rat and dog liver microsomes (0.1 mg MS protein/ml). Each point represents the mean ± S.D. of three experiments. •: Observed data, solid lines: fitted curves.
Comparison of kinetic parameters among rats, dogs and humans
Comparison of models for fitting of Eadie-Hofstee plots in dogs
The kinetic parameters obtained from the in vitroexperiments using rat and dog liver microsomes are summarized in table3, for comparison, together with those obtained for human microsomes reported previously (Iwatsubo et al., 1997b). The formation of YM796 metabolites was described by only a single component for rats. Also for humans, the high-affinity, low-capacity component accounted for approximately 80% of the CLint,all under linear condition, while the contribution of the high-affinity component was only 50%, and other low-affinity and non-saturable components also contributed to CLint,all for dogs (table3). The Km value of the high-affinity, low-capacity component (Km1) was not very different between rats and dogs, but several times larger than for humans. The Vmax value of that component (Vmax1) differed markedly among species, being 444 and 9.3 times more in rats and dogs, respectively, compared with humans.
Immunoinhibition of YM796 metabolism.
Because we have already found that CYP3A4 was predominantly responsible for the metabolism of YM796 in humans (Iwatsubo et al., 1997b), the effects of anti-rat CYP3A2 sera on YM796 metabolism in rat and dog liver microsomes were examined. Anti-rat CYP3A2 sera inhibited the formation of total metabolites of YM796 by up to approximately 70 and 50% in rats and dogs, respectively (fig. 5).

Effects of anti-rat CYP3A2 serum on the formation of total metabolites of YM796 in microsomes prepared from rat and dog livers. Rat or dog liver microsomes (0.1 mg MS protein/ml) were preincubated for 30 min at room temperature with 10 to 80 μl of anti-rat CYP3A2 sera or control sera per mg MS protein. Each point represents the mean ± S.D. of three experiments. ⋄, Control sera (YM796 1 μM) in dog microsomes. ♦, Anti-rat CYP3A2 sera (YM796 1 μM) in dog microsomes. ▵, Control sera (YM796 1 μM) in rat microsomes. ▴, Anti-rat CYP3A2 sera (YM796 1 μM) in rat microsomes.
YM796 metabolism in the small intestine.
No metabolites of YM796 could be detected in rat microsomal samples prepared from the upper intestine and incubated with YM796 for 5 and 20 min. The plasma concentration-time profiles of unchanged YM796 in the portal vein and systemic artery after administering drug to the small intestinal loop in rats are shown in figure 6. The plasma concentration of YM796 in the portal vein was constantly higher than in the systemic artery, and this concentration difference in unchanged YM796 was considered to reflect the absorption of YM796 into the portal vein through the small intestine. The AUC values of unchanged YM796 for the portal vein and systemic artery were 15.1 and 0.193 μg · min/ml, respectively, resulting in a figure for the estimated fraction of YM796 absorbed through the small intestine of 88% based on equation 14.

Concentration-time profiles of YM796 in the portal vein and femoral artery after administration into the intestinal loop. After preparing the proximal jejunal loop, YM796 solution was administered via the loop at a dose of 1 mg/kg. Blood samples were collected simultaneously from the portal vein (•) and femoral artery (○) at defined time points after administration. Unchanged YM796 concentrations in plasma were determined by TLC and a BAS-2000 system. Each point represents the mean ± S.D. of three experiments.
Comparison of CLint,in vitro and CLint,in vivo among rats, dogs and humans.
To calculate CLint,in vivo, the fp and RB of YM796 were measured for rats and dogs. The fp values were approximately 0.7 for both animals, similar to the value reported for humans, and almost constant irrespective of the YM796 concentration, ranging from 0.5 to 2500 μM (table 2). The RBvalues were 1.10, 1.07 and 1.11 for rats, dogs and humans, respectively, showing no marked species difference or concentration-dependence. The calculated CLint,in vitro under linear conditions was 38.8 and 2.6 ml/min/g liver for rats and dogs, respectively, being approximately 40 and 3 times more than for humans (tables 3 and5). The CLint,in vivo calculated from the in vivo pharmacokinetic data in rats and dogs was 30.4 and 3.4 ml/min/g liver, respectively, comparable with the CLint,in vitro in each species, being 40 and 5 times more than the human value (table 5). Although only two animal species were available, the CLint,in vivo in humans was also predicted by animal scaling based on equation (12). The coefficient (a) and exponent (b) of the allometric equation were 645 ml/min/kg and 0.475, and the CLint,in vivo in humans was estimated to be 69.3 ml/min/kg (i.e., 2.85 ml/min/g liver) indicating significant overestimation, when compared with the CLint,in vivo (17.7 ml/min/kg, i.e., 0.73 ml/min/g liver) calculated from the observed in vivo data in humans. When corrected by MLP based on equation (13), the CLint,in vivo predicted for humans became comparable (25.0 ml/min/kg, i.e., 1.03 ml/min/g liver at a′ = 25.8 × 10⁵ l/MLP/kg, b′ = 0.825) with that obtained from the in vivo human data as well as that predicted from the in vitro metabolism data in humans (22.8 ml/min/kg, i.e., 0.94 ml/min/g liver).
Prediction of in vivo CLint from in vitro metabolic data using liver microsomes prepared from each species
Discussion
Eadie-Hofstee plots for the formation of total YM796 metabolites in rat liver microsomes were linear, while they appeared curved in dog liver microsomes, suggesting that a single component and multiple components contributed to the metabolic reactions of YM796 in the liver of rats and dogs, respectively (fig. 4). Thus, the metabolism data derived from dog liver microsomes were fitted to equations based on each of the following models to obtain the kinetic parameters: 1) one saturable and one nonsaturable components (equation (2), 2) two saturable components (equation (3), 3) two saturable and one nonsaturable components (equation (4). The calculated AIC value for each model was -27.6, -31.7 and -35.5, indicating that equation (4) gave the best fit to the data (table 4). We have already reported that the metabolism data in human liver microsomes were also described by multiple component kinetics and that model 3 was the most appropriate for data fitting as was the case with dogs (Iwatsubo et al., 1997b). For both dogs and humans, the formation of YM796 metabolites could be described by three components: 1) high-affinity with low-capacity, 2) low-affinity with high-capacity and 3) nonsaturable. The contribution of the high-affinity component under linear conditions was 100% (single component) in rats and approximately 80 and 51% in humans and dogs, respectively (table 3). Furthermore, anti-rat CYP3A2 sera inhibited YM796 metabolite formation in rat liver microsomes by up to more than 70% as also reported for human liver microsomes (Iwatsuboet al., 1997b), although up to 50% inhibition was observed in dog liver microsomes (fig. 5). Thus, CYP3A seemed to make the predominant contribution to YM796 metabolism in all species examined. As described previously, the contribution of the high-affinity component to CLint,all was predominant for both rats and humans, although it was as low as 50% for dogs. These facts suggest that it is possible that the high-affinity component for YM796 metabolism was primarily inhibited by anti-rat CYP3A2 sera in both dog and human liver microsomes.
The CLoral after oral administration of YM796 to rats and dogs at a dose of 1 mg/kg was 3330 and 205 ml/min/kg, respectively, indicating that there is a pronounced interspecies difference in the in vivo metabolic clearance of YM796. The CLoral for humans after an oral dose (5 mg/body) was 11.1 ml/min/kg (Iwatsubo et al., 1997b), the lowest among the species used, which corresponded to approximately 1/300 and 1/18 that for rats and dogs, respectively. The CLint,in vivo calculated from the CLoral for rats, dogs and humans based on the dispersion model, taking into consideration Qh, fp and RB values was 30.4, 3.4 and 0.73 ml/min/g liver, respectively. The CLint,in vivo in humans predicted based on the animal scaling method using CLint,in vivo values in rats and dogs was 2.85 ml/min/g liver which was several times higher than that estimated above. When the correction by MLP was introduced into the animal scaling, the predcited CLint,in vivo became closer to the observed value. On the other hand, the CLint,in vitrocalculated from Km , Vmaxand CLns derived from the in vitrometabolism studies in rat, dog and human liver microsomes, was 38.8, 2.6 and 0.94 ml/min/g liver being comparable with the CLint,in vivo. Thus, the marked species difference in the metabolic clearance of YM796 among rats, dogs and humans observed in vivo was also reflected in the in vitro metabolism data. From these results, the method for predicting in vivo metabolic clearance from in vitro data seems to be as available as the animal scaling method with correction by MLP. The Km1estimated from the in vitro metabolism studies using liver microsomes of each species was lowest in humans (1.7 μM) with metabolic clearance being the lowest, although there was no major difference between rats and dogs (13.4 and 8.1 μM). In addition, the Vmax (Vmax1) values for rats and dogs were 520 and 10.9 nmol/min/g liver, respectively, which were approximately 400 and 8 times more than in humans (1.2 nmol/min/g liver), suggesting that the large interspecies difference in thein vitro and in vivo metabolic clearances observed in our study was predominantly attributable to a species difference in the metabolic capacity of the enzyme (Vmax).
In the calculation of CLint,in vivomentioned above, the bioavailability (F) was considered to be the product of Fa and Fh.
In conclusion, although the kinetics of YM796 metabolism differed markedly among species (rats, dogs and humans), the large species difference in the metabolic clearance observed in vivo could be reproduced in the in vitro experiments using liver microsomes prepared from each animal, and it was found that such differences may be ascribed predominantly to the large difference in Vmax. In addition, the absolute values of CLint,in vitro and CLint,in vivo were comparable for each animal examined, suggesting the usefulness of predicting the in vivo metabolic clearance of a drug from in vitro metabolism data obtained using liver microsomes. It should be noted, however, that the application of this method is restricted to drugs that are eliminated from the body mainly by hepatic microsomal metabolism, with no significant intestinal metabolism and insignificant or predictable renal elimination.
Acknowledgments
The authors thank Dr. K. Chiba, Chiba University, Dr. T. Ishizaki, Research Institute, International Medical Center of Japan and Dr. N. Shimada, Daiichi Pure Chemical Co., Ltd. for providing kind advice and valuable discussion in conducting our study.
Footnotes
-
Send reprint requests to: Dr.Yuichi Sugiyama, Faculty of Pharmaceutical Sciences, The University of Tokyo, 7–3-1, Hongo, Bunkyo-ku, Tokyo 113, Japan.
- Abbreviations:
- AUCoral
- area under the plasma concentration-time curve after oral administration
- CLh
- hepatic clearance
- CLint,all
- overall intrinsic metabolic clearance (intrinsic hepatic clearance)
- CLint,in vitro
- overall intrinsic metabolic clearance estimated from the in vitro study
- CLint,in vivo
- overall intrinsic hepatic clearance calculated based on the in vivopharmacokinetic information
- CLns
- intrinsic metabolic clearance for the nonsaturable component
- CLoral
- oral clearance (= Dose/AUCoral)
- CLr
- renal clearance
- CLtot
- total body clearance
- CYP
- cytochrome P-450
- DN
- dispersion number
- Fa
- the fraction absorbed from the intestinal tract
- Fh
- hepatic availability
- fb
- unbound fraction in blood
- fp
- unbound fraction in plasma
- GC
- gas chromatography
- Km,i
- Michaelis-Menten constant for the i-th component of the metabolic reaction
- MS
- microsomal
- MS-MS
- tandem mass spectrometry
- Qh
- hepatic blood flow rate
- RB
- blood-to-plasma concentration ratio
- TLC
- thin-layer chromatography
- Vmax,i
- maximum metabolic rate for the i-th component of the metabolic reaction
- Received January 29, 1997.
- Accepted July 8, 1997.
- The American Society for Pharmacology and Experimental Therapeutics


