


Abstract
Two catechol-O-methyltransferase (COMT) inhibitors, entacapone and tolcapone, were compared in the rat to elucidate the actual differences between their pharmacokinetics and pharmacodynamics after single and repeated administration. Their inhibitory potencies were also compared in vitro. After intravenous administration (3 mg/kg), the elimination half-life (t1/2β) of entacapone (0.8 h) was clearly shorter than that of tolcapone (2.9 h). The striatum/serum ratio of tolcapone was 3-fold higher than that of entacapone. After a single oral dose (10 mg/kg), both entacapone and tolcapone produced an equal maximal degree of COMT inhibition in peripheral tissues, but tolcapone inhibited striatal COMT more effectively than did entacapone. After the 7-day treatment (10 mg/kg twice daily), COMT activity had recovered to a level of 67 to 101% of control within 8 h after the last dose of entacapone. In tolcapone-treated animals, there was still extensive COMT inhibition present in peripheral tissues, and the degree of inhibition was higher than that attained after a single dose. The pharmacokinetic-pharmacodynamic modeling revealed that a plateau of COMT inhibition near the maximal attainable inhibition was reached already by plasma concentrations below 2000 ng/ml, both with entacapone and tolcapone. Entacapone and tolcapone inhibited equally rat liver COMT in vitro with Ki values of 10.7 and 10.0 nM, respectively. In conclusion, tolcapone has a longer duration of action and a better brain penetration than entacapone. The results also suggest that peripheral COMT is inhibited continuously when tolcapone is dosed at 12-h intervals, but this was not seen with entacapone.
The second-generation catechol-O-methyltransferase (COMT, EC2.1.1.6) inhibitors, entacapone and tolcapone, are indicated as adjuncts to standard levodopa-dopa decarboxylase inhibitor therapy in Parkinson's disease. They increase the bioavailability of levodopa by inhibiting its peripheral metabolism to an inactive metabolite, 3-O-methyldopa. COMT inhibitors improve the efficacy of the levodopa-dopa decarboxylase inhibitor therapy by prolonging the duration of action and the clinical benefit of levodopa (Männistö and Kaakkola, 1999; Kaakkola, 2000).
Entacapone and tolcapone apparently behave differently both in experimental animals and humans. However, as a rule, entacapone and tolcapone have been studied only individually; their pharmacokinetics and pharmacodynamics have not been compared thoroughly after single and repeated dosing. Actually, very little is known about their pharmacodynamics in different tissues after repeated dosing. Furthermore, only the relationship between the plasma drug concentration and COMT activity in erythrocytes has been studied previously (Dingemanse et al., 1995, 1996; Forsberg et al., 2002).
A few available studies on entacapone and tolcapone in rats suggest that entacapone is eliminated faster than tolcapone and its oral bioavailability is lower than that of tolcapone. After intravenous administration of 10 mg/kg tolcapone, thet1/2 was 0.9 h and total clearance 470 ml × h−1 × kg−1. The oral bioavailability was 48% for 20 mg/kg and 56% for 40 mg/kg (Funaki et al., 1994, 1995). After administration of 5.7 mg/kg entacapone intravenously, thet1/2 and total clearance were 0.4 h and 829 ml × h−1 × kg−1, respectively. The oral bioavailability of entacapone (5.7 mg/kg) seems to depend on the entacapone formulation; a bioavailability of only about 10% is seen after administration of suspension, but about 35% has been achieved by giving entacapone as a solution (Savolainen et al., 2000).
The time course of COMT activity in different tissues has been studied in experimental animals after oral administration of entacapone or tolcapone but at very different doses (Zürcher et al., 1990b,1991; Nissinen et al., 1992). These previous results suggest that tolcapone generally has a longer duration of action, but the pharmacodynamic properties of entacapone and tolcapone have been compared generally only in one single-dose (30 mg/kg) study published during the preparation of this article (Learmonth et al., 2002).
On the basis of COMT inhibitor studies in experimental animals, it has been proposed that tolcapone penetrates to the brain, whereas entacapone has a mainly peripheral action (Zürcher et al., 1991;Kaakkola and Wurtman, 1992; Männistö et al., 1992; Nissinen et al., 1992), but to date, there are no numeric data based on actual drug concentrations.
In healthy volunteers the elimination half-life (t1/2β) of tolcapone (1.3 h) is clearly longer than that of entacapone (0.4 h), and the total clearance of tolcapone (7.1 l/h) is much smaller than that of entacapone (51.9 l/h) (Jorga et al., 1998; Heikkinen et al., 2001). At therapeutic oral doses, both drugs are rapidly eliminated with an apparentt1/2 of 1.6 to 3.4 h, but tolcapone generally has a longer duration of action as assessed by inhibition of COMT activity in erythrocytes (Keränen et al., 1994; Dingemanse et al., 1995). These apparent differences in the duration of action of entacapone and tolcapone have led to different treatment strategies; entacapone is recommended to be given with each dose of levodopa, whereas tolcapone is given three times a day in an attempt to keep COMT continuously inhibited (Männistö and Kaakkola, 1999).
In this study, the pharmacokinetic and pharmacodynamic properties of entacapone and tolcapone were compared in the rat to elucidate actual differences in their behavior. First, 3 mg/kg of each drug was given intravenously to determine the basic pharmacokinetic parameters of entacapone and tolcapone and to assess their penetration into the brain by actual drug concentrations. Second, entacapone and tolcapone (10 mg/kg) were given orally either once or repeatedly every 12 h for 7 days to assess the differences in their pharmacokinetics and pharmacodynamics, both in the periphery and the central nervous system. Furthermore, the relationship between plasma drug concentration and COMT activity in different tissues was studied with the inhibitoryEmax model. Finally, the in vitro potencies of entacapone and tolcapone were compared under equal conditions using a low concentration of rat liver COMT. The IC50 values observed for tight binding inhibitors, such as entacapone and tolcapone, vary with the total enzyme concentration at a fixed substrate concentration (Lotta et al., 1995; Borges et al., 1997; Copeland, 2000). Therefore, the enzyme concentration in the sample must be taken into consideration when IC50 or Ki is determined (Copeland, 2000).
Materials and Methods
Drugs and Reagents
Entacapone was obtained from Orion Pharma (Espoo, Finland). Tolcapone was synthesized by Dr. Aino Pippuri (Orion Pharma, Espoo, Finland). For intravenous administration, entacapone and tolcapone were dissolved in phosphate buffer (pH 7.4). The entacapone and tolcapone suspensions for oral administration were prepared by mixing an appropriate amount of drug in potassium biphthalate buffer (pH 3.0, USP 23).
3,4-Dihydroxybenzoic acid,S-adenosyl-l-methionine, EDTA disodium salt (Na2-EDTA), vanillic acid (4-hydroxy-3-methoxybenzoic acid), isovanillic acid (3-hydroxy-4-methoxybenzoic acid), and MOPS were purchased from Sigma-Aldrich (St. Louis, MO). Saccharose was purchased from BDH Laboratory Supplies (Poole, Dorset, UK), dithiothreitol from Merck (Darmstadt, Germany), and MgCl2 from Riedel-de Haën (Seelze, Germany). All chemicals were reagent grade. Ultrapure water was produced with a Maxima HPLC unit (Elga LabWater, High Wycombe, Buckinghamshire, UK).
Animals
Male Han/Wistar rats, supplied by the National Laboratory Animal Centre (Kuopio, Finland), were housed in stainless steel cages and kept on a 12-h light/12-h dark cycle (lights on at 7:00 AM) at an ambient temperature of 22 ± 1°C. Pelleted food (Lactamin R36; Lactamin AB, Södertälje, Sweden) and tap water were available ad libitum. Animals were fasted before the administration of a single dose and before the last dose of the 7-day treatment. Animals were 8 to 9 weeks old and weighed 169 to 305 g (n = 168). In the intravenous study, 26 animals were used. Ten untreated rats (aged 11–12 weeks) weighing 277 to 370 g were sacrificed to obtain liver samples for the in vitro studies.
All procedures with animals were reviewed and approved by the Animal Ethics Committee at the University of Kuopio in conformance with current legislation.
Drug Administration and Sampling
Intravenous Administration.
The rats were anesthetized with chloral hydrate (350 mg/kg i.p., given as a dilute solution of 1 ml/100 g). Vasodilatation of tail veins was induced by placing the rat's tail in a water bath (+40°C) for 2 min, and then a 5-s bolus injection of entacapone or tolcapone (3 mg/kg) was given via a tail vein. Drugs were administered on a mass basis since this has been standard practice in most animal studies and in all human studies. If the doses are converted to moles per kilogram, the dose of entacapone (10 μmol/kg) is approximately 10% lower than that of tolcapone (11 μmol/kg). This difference, slightly favoring tolcapone, was considered insignificant in this comparative study.
Before injection, a blood sample (250 μl) was taken from the retrobulbar plexus using nonheparinized glass capillaries. The following blood samples were taken at 5, 10, 15, 30, 60, or 120 min after the injection of the COMT inhibitor. Maximally, three retrobulbar samples were taken from one rat, and the final sample was collected after decapitation. Sampling times were randomized between successive rats. The blood was allowed to clot and serum was separated by centrifugation. The samples were kept frozen until analyzed.
For determination of entacapone and tolcapone concentrations in the perfused striatum, the blood samples were taken from the retrobulbar plexus at 14 min and 59 min after the intravenous injection of entacapone and tolcapone (3 mg/kg). After the 14-min blood sample, the thorax was opened, and 0.9% saline infusion was started via the left ventricle using a large needle. Simultaneously, the right auricle was cut open and the blood was drained out. After 3 min of perfusion, the outcoming fluid was clear. The rats were decapitated and the striata were dissected.
Oral Administration.
In the single-dose study, entacapone or tolcapone (10 mg/kg, equivalent to 33 μmol/kg entacapone and 37 μmol/kg tolcapone) was given orally as a suspension (pH 3.0) to rats (n = 6 in each group). In the 7-day treatment study, entacapone or tolcapone (10 mg/kg) was administered repeatedly at 12-h intervals. Drugs were given by gavage in a volume of 0.5 ml/100 g animal weight. Controls received 0.5 ml/100 g potassium biphthalate buffer (pH 3.0).
Animals were decapitated 0.5, 1, 2, 4, 6, and 8 h after administration of a single dose or after the last dose of the 7-day treatment. Blood samples were taken in tubes containing Na2-EDTA and plasma was separated by centrifugation for 10 min at 1500g at +4°C. The plasma samples were transferred into plastic tubes and stored at −70°C until analyzed. After dissection, the tissue samples (striatum, duodenum, cortical part of the kidney, liver) were frozen in liquid nitrogen and stored at −70°C until assayed. The duodenum samples were rinsed with 0.9% NaCl to remove intestinal contents and the unabsorbed drugs from the lumen.
Inhibition of Rat Liver COMT in Vitro
To compare the inhibitory potency of entacapone and tolcapone against the rat liver COMT, three sets of experiments were carried out. First, rat liver total COMT was incubated in the presence of varying concentrations of entacapone or tolcapone and the IC50 value was determined. The amount of protein used was the same as in the determination of COMT activity of liver samples. Second, the apparent inhibitor constant (Kiapp) and the active enzyme concentration were determined. Also,Km and maximum reaction velocity (Vmax) of rat liver total COMT were measured. Finally, the IC50 values of entacapone and tolcapone were also compared using soluble (S-COMT) and membrane-bound (MB-COMT) COMT preparations. The effect of 60 min of preincubation at room temperature on the IC50values was also investigated.
Liver samples taken from 10 untreated animals were homogenized in a MOPS buffer (pH 7.4) containing 0.32 M saccharose and 0.5 mM dithiothreitol. Homogenates were fractionated according to the method of Nissinen et al. (1988) and Ellingson et al. (1999). Briefly, the first halves of the homogenates were centrifuged for 10 min at 900g at +4°C and the supernatants were pooled. After dilution, the 900g supernatant containing both S- and MB-COMT isoforms was used as a total COMT preparation (total protein concentration ∼0.7 mg/ml). The other halves of the homogenates were centrifuged for 20 min at 15,000g, and the supernatants were centrifuged further for 60 min at 100,000g at +4°C. High-speed supernatants, enriched with S-COMT, were pooled, diluted, and used as a S-COMT preparation (total protein concentration ∼0.3 mg/ml). The microsomal fraction enriched with MB-COMT was washed twice, resuspended in homogenization buffer, and used as a MB-COMT preparation (total protein concentration ∼5.5 mg/ml).
Determination of COMT Activity
The COMT activity assay was performed according to the method described by Reenilä et al. (1995) for rat striatal samples. In brief, tissue samples were homogenized in a MOPS buffer (pH 7.4) containing 0.32 M saccharose and 0.5 mM dithiothreitol. Homogenates were centrifuged for 10 min at 900g at +4°C, and the supernatants were used as the enzyme preparation containing both S- and MB-COMT isoforms (i.e., total COMT). The supernatants of kidney and liver homogenates were first diluted with homogenization buffer.
A total of 100 μl of the enzyme preparation (total COMT, S-COMT, or MB-COMT) was incubated for 30 min at +37°C in 0.1 M phosphate buffer (pH 7.4) containing 200 μMS-adenosyl-l-methionine, 5 mM MgCl2, and 240 μM 3,4-dihydroxybenzoic acid (the substrate) in a total volume of 250 μl. In COMT inhibition experiments in vitro, varying concentrations (3 × 10⁻¹¹ to 3 × 10⁻⁵M, final concentrations) of entacapone or tolcapone were added to the incubation medium. When determining Kmand Vmax values, the 3,4-dihydroxybenzoic acid concentration was varied from 60 to 420 μM.
The reaction was stopped by transferring the samples to an ice bath and by adding 25 μl of ice-cold 4 M perchloric acid. After 10 min, the samples were centrifuged for 10 min at 5400g at +4°C. The supernatants were filtered, diluted (1:10) with ultrapure water, and stored at −70°C until analyzed.
The reaction products (vanillic and isovanillic acid) were quantitated according to the method of Reenilä et al. (1995). Only minor modifications were made to optimize the chromatographic separation and the detection of the analytes. Briefly, 10 μl of the diluted samples were injected into a HPLC system which consisted of an isocratic Waters 510 pump (Waters, Milford, MA), a Waters 717 plus autosampler with cooler (Waters), a Purospher RP-18e 4 × 125 mm column with Purospher RP-18e 4 × 4 mm precolumn (Merck), ESA Coulochem 5100A electrochemical detector (ESA, Chelmsford, MA), and Shimadzu C-R6B Chromatopac integrator (Shimadzu, Kyoto, Japan). The detector was equipped with a 5021 conditioning cell and a two-channel (Det 1 and Det 2) 5011 analytical cell. The potentials applied were +0.47, +0.20, and −0.25 V for conditioning cell, Det 1, and Det 2, respectively. The sensitivity of Det 2 was set at 12 × 100. The mobile phase consisted of 0.1 M disodium hydrogen phosphate, 0.15 mM Na2-EDTA, and 15% methanol (v/v). The pH was adjusted to 3.2 with phosphoric acid. The flow rate was set at 1.1 ml/min.
The concentrations of both vanillic acid and isovanillic acid in the samples were calculated from peak heights utilizing a standard curve constructed by linear regression. The protein contents of the samples were measured spectrophotometrically with Hitachi U-2000 spectrophotometer (Hitachi, Tokyo, Japan) using a Bio-Rad protein assay kit (Bio-Rad, Hercules, CA). Specific COMT activities were expressed as pmol vanillic acid × min−1 × mg protein−1.
Validation of COMT Assay
The linearity of vanillic acid production was followed as a function of time up to 70 min with rat striatum, duodenum, kidney, and liver total COMT preparation, and all COMT preparations used in in vitro experiments. The reaction was highly linear (r > 0.98) at least up to 50 min in all cases. Within-day and between-day coefficient of variation, calculated from repeated determinations of COMT activity of liver sample pool, were 7.6% (n = 14) and 9.4 to 14.5% (n = 28), respectively.
Determination of Entacapone and Tolcapone Concentrations in Plasma, Serum, and Striatal Homogenates
Entacapone and tolcapone concentrations in rat plasma after oral administration were determined as previously described (Savolainen et al., 2000). Only minor modifications were made to optimize chromatographic separation. The Agilent HPLC 1100 Series chromatographic system (Agilent Technologies Inc., Wilmington, DE) consisted of a binary gradient pump, a vacuum degasser, an autosampler, a thermostatted column compartment, a diode-array detector, and Agilent ChemStation software (Agilent Technologies Inc., Wilmington, DE). The separation was performed with a Zorbax SB-C18 reversed-phase column (150 × 4.6 mm, 5 μm) with a guard cartridge (12.5 × 4.6 mm) purchased from Agilent Technologies. Entacapone was detected at 304 nm and tolcapone at 280 nm.
Serum and striatal homogenate concentrations of entacapone and tolcapone after intravenous administration were determined according to the method described by Karlsson and Wikberg (1992) for entacapone. Only minor modifications were made in the sample volumes. In brief, 100 μl of phosphate buffer (pH 7.2) were added to 200 μl of serum. After mixing, the sample was acidified with 100 μl of 1 M HCl, and the analytes were extracted from the serum into 5.0 ml ofn-hexane/ethyl acetate (1:1, v/v) by mixing for 2 min. After centrifugation, 4.0 ml of the organic phase were evaporated and the residue was dissolved in 200 μl of mobile phase. The striata were homogenized in 500 μl of 50 mM phosphate buffer (pH 7.2) and then treated as the serum samples.
Calculations and Statistics
Animal Studies.
Specific COMT activities were transformed as percentages of control (mean ± S.E.M.). For calculation of area under the effect-time curve (AUE), the percentages of COMT inhibition were calculated by the equation (baseline activity − activity)/baseline activity × 100%. AUE and area under the plasma drug concentration-time curve (AUC) values (% × h and ng × h × ml−1, respectively) from 0 to 8 h after dosing entacapone or tolcapone orally were calculated by Prism 3.02 software (GraphPad Software, San Diego, CA) using the trapezoidal rule.
In the intravenous study, a two-compartment model (C =Ae−αt +Be−βt) was fitted to plasma drug concentration-time data, and initial plasma concentration (C0), AUC0–∞, total clearance, and t1/2β were calculated by Kinetica 2000 v3.1 software (InnaPhase Corporation, Philadelphia, PA).
The inhibitory Emax modelE = E0 − (Emax ×C)/(EC50 + C) was used to describe the relationship between plasma drug concentration (C) and COMT activity in peripheral tissues (E) after oral administration of entacapone and tolcapone (Holford and Sheiner, 1981; Dingemanse et al., 1995; Forsberg et al., 2002). The specific COMT activities (pmol vanillic acid × min−1 × mg protein−1) were plotted against corresponding concentration values (ng/ml); the baseline COMT activity (E0), maximum attainable COMT inhibition (Emax), and the concentration producing 50% of the maximum attainable inhibition (EC50) were fitted as free parameters; and the 95% confidence intervals were calculated using GraphPad Prism 3.02 software.
The statistical significance of differences between COMT activity profiles (from 0.5 to 8 h) and plasma drug levels (from 0.5 to 6 h) after oral administration of entacapone and tolcapone were tested using two-way factorial analysis of variance after logarithmic transformation. Also, the effect of the 7-day treatment on COMT activity profile and plasma drug levels was tested (single dose versus 7-day treatment). The time required for full recovery of COMT activity was predicted by linear regression from log-transformed data (0.5–8 h). An independent-samples t test was applied to test the significance of differences in maximal effects.
In Vitro Studies.
The COMT activities measured in the presence of varying concentrations of entacapone or tolcapone were plotted against log concentration of an inhibitor, and the IC50 value was determined by nonlinear regression using the sigmoidal dose-response equation.Kiapp and active enzyme concentration (E) were calculated by fitting the Morrison equation
Results
Entacapone and Tolcapone Levels in Serum/Plasma
Intravenous Administration.
The serum tolcapone levels were clearly higher than serum entacapone levels (Fig.1A). In the tolcapone group, AUC0–∞ was 3-fold higher than that obtained in the entacapone group (15,200 and 4,630 ng × h × ml−1, respectively). TheC0 estimates for entacapone and tolcapone were 22,700 and 29,300 ng/ml, respectively. Thet1/2β of tolcapone (2.9 h) was more than 3-fold longer than that of entacapone (0.8 h). Total clearances of entacapone and tolcapone were 648 ml × h−1× kg−1 and 197 ml × h−1 × kg−1, respectively.
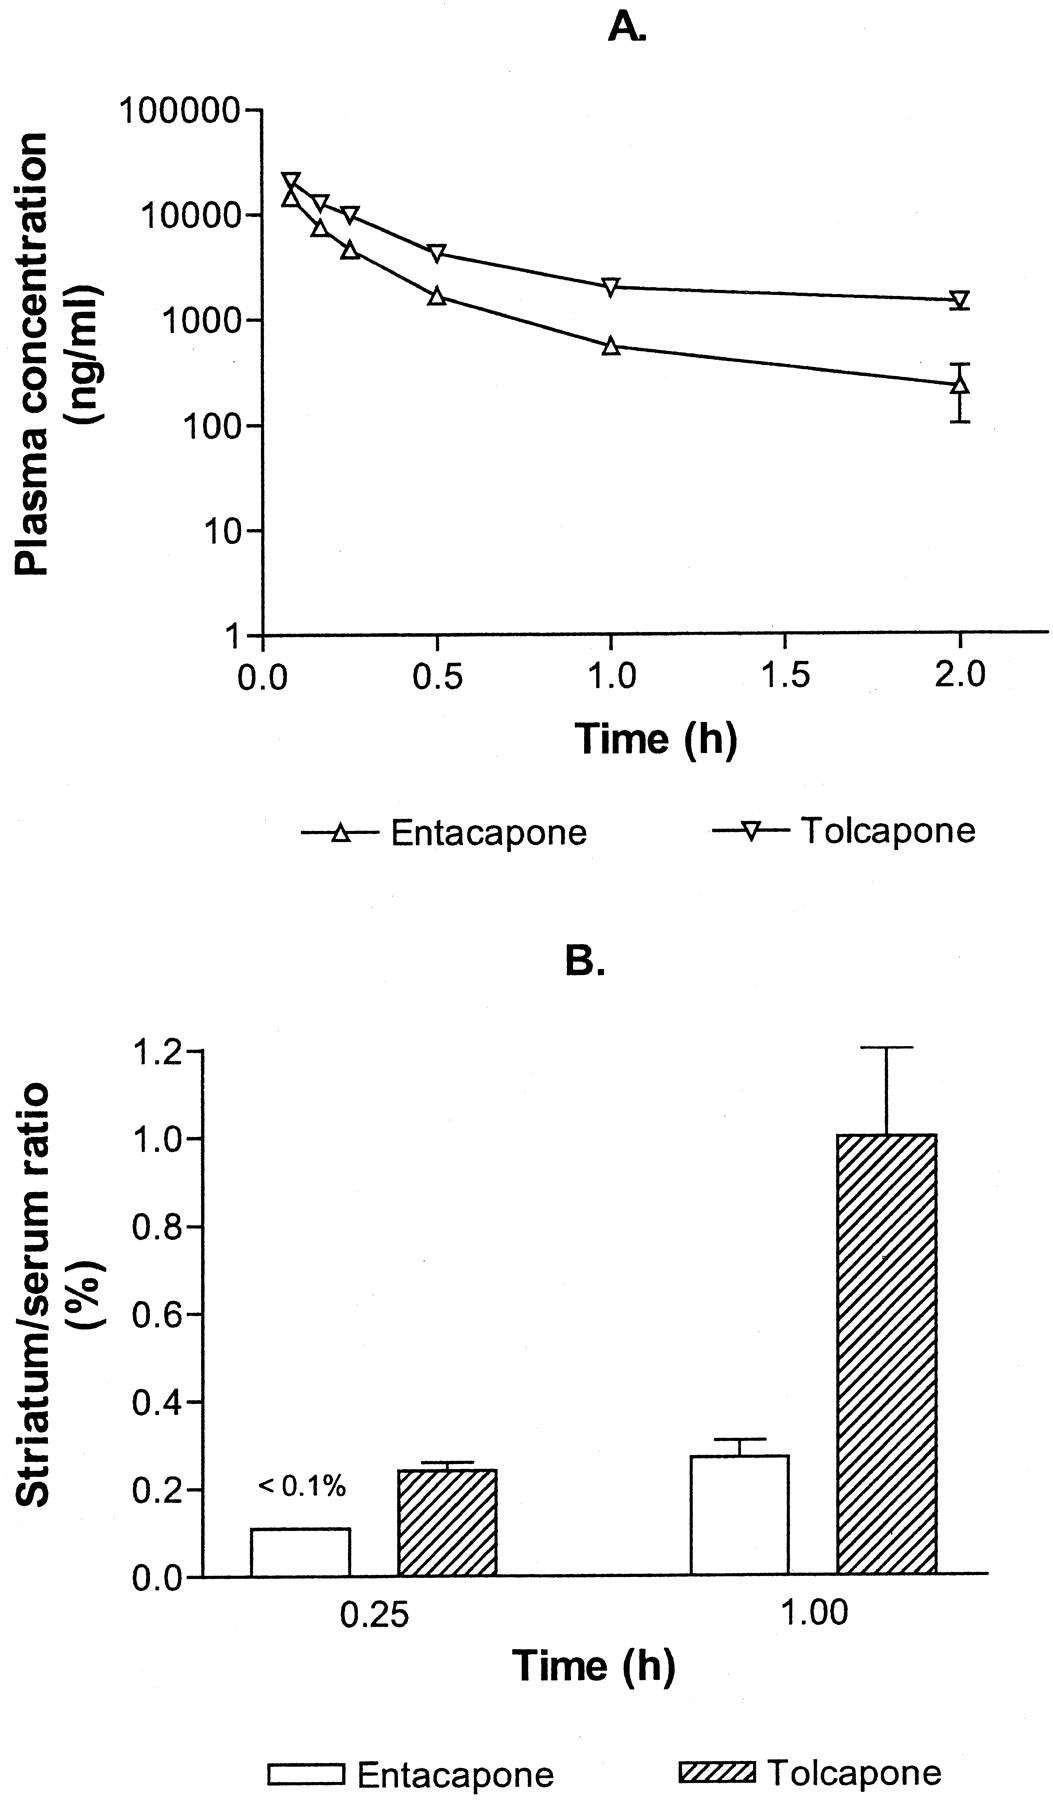
The plasma entacapone and tolcapone concentration-time curves (A) and the striatum/serum ratios of entacapone and tolcapone (B) after intravenous administration of a single dose (3 mg/kg, equivalent to 10 μmol/kg entacapone and 11 μmol/kg tolcapone; in panel B entacapone 1 h, 10 mg/kg, equivalent to 33 μmol/kg). In panel A each point represents the mean ± S.E.M. of 2 to 8 animals. In panel B the striatum/serum ratios are mean ± S.E.M. of 4 to 10 animals.
Oral Administration.
The plasma entacapone and tolcapone concentration-time curves after administration of a single dose and twice daily for 7 days are shown in Fig.2. After administration of a single dose, the plasma tolcapone levels were time dependently higher (P < 0.05) than plasma entacapone levels; the AUC value of tolcapone was 6-fold higher (18,000 and 2,990 ng × h × ml−1 for entacapone and tolcapone, respectively). After the 7-day treatment period, the plasma entacapone and tolcapone concentrations and AUC values were at about the same level as after a single dose.

The plasma entacapone and tolcapone concentration-time curves after oral administration of a single dose and repeatedly twice daily for 7 days (dose 10 mg/kg, equivalent to 33 μmol/kg entacapone and 37 μmol/kg tolcapone). Each point represents the mean ± S.E.M. of five to six animals.
Striatum/Serum Ratios of Entacapone and Tolcapone
The striatum/serum ratios of entacapone and tolcapone are presented in Fig. 1B. Fifteen minutes after intravenous administration of 3 mg/kg entacapone, the plasma entacapone concentration was 5980 ± 885 ng/ml (mean ± S.E.M., n = 5), but the entacapone concentration in the striatum was close to the limit of detection (∼5 ng/g) and, hence, the striatum/serum ratio remained less than 0.1%. Therefore, some striatal samples were collected also at 60 min after 10 mg/kg entacapone. Now the serum entacapone concentration was 3170 ± 986 ng/ml (n = 7) and the striatal entacapone concentrations were above the limit of detection. The calculated striatum/serum ratio was 0.27%.
In the tolcapone group, the intravenous dose of 3 mg/kg resulted in a plasma concentration of 10,300 ± 1,930 ng/ml (n = 4) at 15 min and 1580 ± 260 ng/ml (n = 10) at 60 min. The corresponding striatal concentrations were 24.9 ± 2.2 and 14.5 ± 1.6 ng/g, giving striatum/serum ratios of 0.24 and 1%, respectively.
These results are based on the direct assays of the drug in the perfused, blood-free brains. Although operating close to the detection limit of entacapone, they indicate that the brain penetration of tolcapone is about 3 times higher than that of entacapone. Furthermore, the penetration of both compounds into the brain appears to be time-dependent.
Inhibition of COMT in Different Tissues
In the single-dose study, the basal COMT activities (mean ± S.E.M.) in striatum, duodenum, kidney, and liver were 33.9 ± 1.1, 185 ± 19.4, 1550 ± 77.1, and 2120 ± 124 pmol of vanillic acid × min−1 × mg protein−1, respectively (n = 12). In the 7-day study, the basal COMT activities in striatum, duodenum, kidney, and liver were 26.1 ± 2.0, 149 ± 10.7, 1270 ± 44.4 and 1550 ± 21.4 pmol vanillic acid × min−1 × mg protein−1, respectively (n = 12).
Single Dose.
The COMT activities (percentage of control, mean ± S.E.M.) in rat tissues after oral administration of entacapone and tolcapone are presented as a function of time in Fig.3. The AUE values are presented in Table1. Both entacapone and tolcapone produced a high degree of COMT inhibition in peripheral tissues (duodenum, kidney, liver) after a single dose. The COMT activity profiles in the entacapone and tolcapone groups differed in a time dependent manner (P < 0.05); the maximal degree of inhibition produced by entacapone and tolcapone did not differ in the periphery, but the COMT activity recovered faster in entacapone-treated animals than in tolcapone-treated animals. The AUE values were 20 to 43% higher after administration of tolcapone. In entacapone-treated animals, peripheral COMT activity had recovered fully within 8 h in duodenum and liver; in kidney, the estimated time was 10.5 h. In tolcapone-treated animals, clear inhibition was still present in the periphery; the activity was predicted to recover fully within 10.3 to 15.7 h. Both drugs were less effective in the striatum than in the periphery, but tolcapone had generally about a 2-fold better effect than entacapone (P < 0.001). Also, the AUE value was more than 2-fold greater in the striatum of tolcapone-treated animals.

The COMT activities (percentage of control) in rat striatum (A), duodenum (B), kidney (C), and liver (D) after oral administration of entacapone and tolcapone (10 mg/kg, equivalent to 33 μmol/kg entacapone and 37 μmol/kg tolcapone) as a function of time. Each point represents mean ± S.E.M. of five to six animals.
AUE and EC50 values of entacapone and tolcapone after oral administration of a single dose and repeated doses twice daily for 7 days (dose 10 mg/kg, equivalent to 33 μmol/kg entacapone and 37 μmol/kg tolcapone)
Seven-Day Treatment.
In the peripheral tissues, the COMT activity profiles were at a significantly (P < 0.001) lower level in the tolcapone group than in the entacapone group. The AUE values (Table 1) were 30 to 72% higher in the peripheral tissues of tolcapone-treated animals. At 0.5 h after the last dose, the degree of COMT inhibition was slightly higher (P < 0.05) in the liver and kidney of tolcapone-treated animals. In entacapone-treated animals, COMT activity had recovered to a level of 67 to 101% of control within 8 h after the last dose of the 7-day treatment period. In the kidney, the activity was predicted to recover fully within 9.9 h. In tolcapone-treated animals, there was still extensive COMT inhibition present at 8 h; the time estimated to achieve full recovery varied between 11.4 and 19.7 h. Also, after the 7-day treatment period, tolcapone was generally more effective (P < 0.001) than entacapone in striatum. In tolcapone-treated animals, the COMT activity (0.5–8 h) was time dependently at a lower level in striatum, kidney, and liver (P < 0.05; duodenum, P = 0.08) than that obtained after a single dose. The activity also recovered more slowly than after a single tolcapone dose.
Pharmacokinetic-Pharmacodynamic Relationships (InhibitoryEmax Model)
The relationship between the plasma drug concentration and the COMT activity in the liver after oral administration of entacapone and tolcapone is presented in Fig. 4. The EC50 estimates of entacapone and tolcapone after oral administration of a single dose and repeatedly twice daily for 7 days are presented in Table 1. The E0and Emax estimates were very close to the actual values in all tissues for both entacapone and tolcapone (data not shown).

The relationship between COMT activity in the liver and plasma drug concentration after oral administration of entacapone (A) and tolcapone (B) (dose 10 mg/kg, equivalent to 33 μmol/kg entacapone and 37 μmol/kg tolcapone). The inhibitoryEmax model E =E0 − (Emax ×C)/(EC50 + C) was fitted to the data. The baseline COMT activity (E0), the maximum attainable COMT inhibition (Emax), and the concentration producing 50% of the maximum attainable inhibition (EC50) are shown in the inset. Each observation represents a single animal.
Inhibition of Rat Liver COMT in Vitro
The IC50,Kiapp, andKi values of entacapone and tolcapone against rat liver total COMT are presented in Table2. The active enzyme concentration calculated with the Morrison equation was 1.1 nM.Km andVmax of total COMT were 156 and 5210 μM, respectively.
Inhibitory potencies of entacapone and tolcapone against rat liver total COMT
The IC50 values (best least-squares fit values with 95% confidence intervals, n = 3) of entacapone and tolcapone against liver S-COMT were 14.3 (11.1–18.5) and 14.8 nM (10.4–21.3), respectively. The IC50 values of entacapone and tolcapone against liver MB-COMT were 73.3 (58.9– 91.2) and 86.5 (60.0–125) nM, respectively. The 60-min preincubation of enzyme with an inhibitor at room temperature did not change the IC50 values, probably due to the 30-min incubation time (data not shown).
Discussion
The results of this comparative study indicate that entacapone and tolcapone behave differently in rats. After intravenous administration, entacapone was eliminated faster than tolcapone. After oral administration, significantly higher plasma levels and a higher AUC value were attained with tolcapone than with entacapone, a reflection not only of the better bioavailability but also the slower elimination of tolcapone. These results are in parallel with human studies (Keränen et al., 1994; Jorga et al., 1998; Heikkinen et al., 2001).
After a single dose, the COMT activity recovered faster in the peripheral tissues of entacapone-treated animals, which mirrors the plasma concentration data. It was estimated that in tolcapone-treated animals, contrary to entacapone-treated animals, COMT activity did not recover fully within 12 h, suggesting that the inhibitory effect of tolcapone will become intensified during repeated administration at 12-h dosing intervals. Very recently, also, Learmonth et al. (2002) have reported in the rat that at a dose of 30 mg/kg, entacapone has a shorter duration of action than tolcapone.
Interestingly, the maximal degree of COMT inhibition achieved by a single tolcapone dose was at the same level as that reported after administration of a 10-fold higher dose but at a higher level than that reported after 15 μmol/kg (equivalent to 4 mg/kg) (Zürcher et al., 1990b, 1991). Furthermore, the COMT activity in the liver recovered in the same way after administration of 10 mg/kg as after 100 mg/kg, but more slowly than after 4 mg/kg (Zürcher et al., 1990b,1991). These results suggest that oral tolcapone doses above 10 mg/kg are beneficial only in prolonging the duration of its inhibitory action.
The present plasma drug concentration data did not indicate accumulation with repeated dosing with 12-h intervals. In tolcapone-treated animals, however, the higher degree of COMT inhibition and the slower recovery of COMT activity after the last dose of the 7-day treatment than seen after the single dose may indicate accumulation of tolcapone in the kidney and liver. This phenomenon was not observed in entacapone-treated animals. These results also indicate that when 10 mg/kg tolcapone is administered at 12-h intervals, the COMT activity is continuously inhibited in the peripheral tissues.
Also, in single-dose (100 or 200 mg) human studies, tolcapone has a much longer duration of action than entacapone; the COMT activity of erythrocytes has fully recovered within 8 h after dosing entacapone, whereas after administration of tolcapone, the inhibition lasted for over 12 h (Keränen et al., 1994; Dingemanse et al., 1995). During repeated administration of entacapone (Rouru et al., 1999) or tolcapone (Dingemanse et al., 1996), no change was observed in their pharmacodynamics. However, tolcapone seemed to accumulate at doses above 200 mg t.i.d. (Dingemanse et al., 1996).
The entacapone regimen is designed to inhibit COMT only when levodopa is present. A continuous or at least longer-lasting COMT inhibition, such as that seen with the tolcapone regimen, would theoretically be more harmful than the entacapone regimen since continuous COMT inhibition may affect, for example, the metabolism of dietary catechols and catecholestrogens (Männistö and Kaakkola, 1999). It could be argued that it is preferable to allow the COMT activity to recover between levodopa doses. We are not aware of clear evidence why continuous COMT inhibition would produce additional benefits in the levodopa therapy of Parkinson's disease.
The EC50 value of entacapone estimated by the inhibitory Emax model appeared to be lower than that of tolcapone in all tissues. However, the slight difference may result simply from the different distribution of observations and cannot be considered significant due to the overlapping 95% confidence intervals in most tissues. Besides, in the present study, utilizing animal data without individual plasma drug concentration-time and COMT activity profiles, the pharmacokinetic-pharmacodynamic relationship could be studied only by using group data. Furthermore, the trend to lower EC50 values after the 7-day treatment in the tolcapone group can only be viewed as supporting the accumulation hypothesis in tissues.
Most importantly, the Emax modeling revealed that a plateau of COMT inhibition near toEmax is attained already by plasma concentrations below 2000 ng/ml, with both entacapone and tolcapone. This result is in agreement with our previous findings from entacapone studies (Forsberg et al., 2002). First, in the case of tolcapone, this suggests that the maximal degree of inhibition in the periphery could be reached already at a much lower dose. Second, the maximum plasma entacapone concentration reached after oral administration of 10 mg/kg appears to be high enough to produce the maximal achievable COMT inhibition in peripheral tissues. This explains why both entacapone and tolcapone had equal maximal effects in the periphery after a single dose.
The present results indicate that tolcapone penetrates better than entacapone into the brain. The actual striatal tolcapone concentrations and the striatum/serum ratios after intravenous administration were about 3-fold higher compared with the corresponding values of entacapone. Furthermore, tolcapone inhibited striatal COMT more effectively than entacapone. Our results agree with previous animal results from COMT inhibitor studies suggesting that tolcapone penetrates into the brain, whereas entacapone has a mainly peripheral action (Zürcher et al., 1991; Kaakkola and Wurtman, 1992;Männistö et al., 1992; Nissinen et al., 1992; Copeland, 2000). Additionally, the ability of tolcapone (200 mg) to inhibit central COMT in humans has been demonstrated very recently using18F-dopa positron emission tomography (Ceravolo et al., 2002). However, it has not yet been clarified whether central COMT inhibition further potentiates the efficacy of levodopa but tolcapone given alone lacks any antiparkinsonian effect both in rats (Männistö, 1998) and in patients (Hauser et al., 1998).
The published results on the physicochemical properties of entacapone and tolcapone are scarce, but the higher lipophilicity of tolcapone is thought to make it more accessible to the brain than entacapone (Dingemanse, 2000). According to our recent experiments, entacapone is more water-soluble and has a lower apparent partition coefficient than tolcapone at physiological pH (M. Forsberg, M. Huotari, J. Savolainen, and P. T. Männistö, unpublished results, 2002). These differences explain to some extent the differences between the pharmacokinetic and pharmacodynamic behavior of entacapone and tolcapone.
There have been several separate studies assessing the in vitro potency of entacapone or tolcapone and inhibition kinetics of COMT (Schultz and Nissinen, 1989; Zürcher et al., 1990b; Nissinen et al., 1992;Borges et al., 1997; Vieira-Coelho and Soares-Da-Silva, 1999), but only three groups have compared entacapone and tolcapone under equal experimental conditions. According to Learmonth et al. (2002) tolcapone is more potent than entacapone both against rat brain and against liver COMT. However, in that study, the 95% confidence intervals of the IC50 values overlapped. De Santi et al. (1998)reported unexpectedly that entacapone was a significantly more potent inhibitor against human peripheral COMT. On the other hand, theKi values of entacapone and tolcapone did not differ in human recombinant S-COMT, but tolcapone had a lowerKi in MB-COMT than did entacapone (Lotta et al., 1995).
Nitrocatechol-structured COMT inhibitors have been shown to be tight binding inhibitors (Schultz and Nissinen, 1989; Lotta et al., 1995;Borges et al., 1997) that bind to the enzyme with such a high affinity that the amount of free inhibitor molecules is significantly depleted by the formation of the enzyme-inhibitor complex (Copeland, 2000). The IC50 value observed for tight binding inhibitors varies with total enzyme concentration at a fixed substrate concentration; i.e., the higher the enzyme concentration, the higher the observed IC50 value. Therefore, determination of IC50 and Kimust take into consideration the enzyme concentration in the sample (Copeland, 2000). In our experiments, guided by this knowledge, entacapone and tolcapone had equal IC50 values against rat liver total COMT but also against S-COMT and MB-COMT fractions. The Ki values of entacapone and tolcapone in liver total COMT were equal and the same order of magnitude as previously reported in separate studies using rat liver COMT (Zürcher et al., 1990a; Nissinen et al., 1992).
Interestingly, the EC50 values in the liver are 8- to 30-fold higher than the IC50 values in liver total COMT. This gradient between in vitro and in vivo data may generally reflect the poor intracellular penetration of these nitrocatechol-structured COMT inhibitors. However, additional studies are needed to confirm this finding.
In conclusion, tolcapone has a longer elimination half-life, a longer duration of action, and a better brain penetration than entacapone. Our findings also indicate that peripheral COMT is inhibited continuously if tolcapone is given at 12-h dosing intervals, but this was not seen with entacapone. However, both drugs had equal maximal effects in the peripheral tissues at a single dose of 10 mg/kg and equivalent in vitro potency against liver total COMT. Furthermore, theEmax modeling revealed that a plateau of COMT inhibition near to Emax is attained already by plasma concentrations below 2000 ng/ml, both with entacapone and tolcapone. The present results suggest that the differences in the duration of action result from different pharmacokinetic behavior.
Acknowledgments
We thank Dr. Tapio Korkolainen and Orion Pharma for collaboration in analytics. Dr. Ewen MacDonald is acknowledged for revision of the manuscript. We also appreciate the excellent technical assistance of Jaana Leskinen, Helly Rissanen and Anne Riekkinen. Orion Pharma is acknowledged for the generous gift of entacapone and Dr. Aino Pippuri for synthesizing tolcapone.
Footnotes
-
↵1 Present address: Orion Pharma, P.O. Box 65, FIN-02101 Espoo, Finland.
-
This work was supported in part by the Drug Research Foundation (Finnish Pharmacological Society).
-
DOI: 10.1124/jpet.102.042846
- Abbreviations:
- COMT
- catechol-O-methyltransferase
- t1/2β
- elimination half-life (β-phase)
- S-COMT
- soluble catechol-O-methyltransferase
- MB-COMT
- membrane-bound catechol-O-methyltransferase
- AUE
- area under the effect-time curve
- AUC
- area under the plasma drug concentration-time curve
- C0
- initial plasma concentration
- E0
- baseline effect
- Emax
- maximum attainable effect
- Received August 6, 2002.
- Accepted October 4, 2002.
- The American Society for Pharmacology and Experimental Therapeutics


