


Abstract
Induction of drug-metabolizing enzymes and transporters can cause drug-drug interactions and loss of efficacy. In vitro induction studies traditionally use primary hepatocyte cultures and enzyme activity with selected marker compounds. We investigated the use of a novel human hepatocyte clone, the Fa2N-4 cell line, as an alternative reagent, which is readily available and provides a consistent, reproducible system. We used the Invader assay to monitor gene expression in these cells. This assay is a robust, yet simple, high-throughput system for quantification of mRNA transcripts. CYP1A2, CYP3A4, CYP2C9, UGT1A, and MDR1 transcripts were quantified from total RNA extracts from Fa2N-4 cells treated with a panel of known inducers and compared with vehicle controls. In addition, we used enzyme activity assays to monitor the induction of CYP1A2, CYP2C9, and CYP3A4. The Fa2N-4 cells responded in a similar manner as primary human hepatocytes. Treatment with 10 μM rifampin resulted in increases in CYP3A4 mRNA (17-fold) and activity (6-β-hydroxytestoterone formation, 9-fold); and in CYP2C9 mRNA (4-fold) and activity (4′-hydroxydiclofenac formation, 2-fold). Treatment with 50 μM β-naphthoflavone resulted in increases in CYP1A2 mRNA (15-fold) and activity (7-ethoxyresorufin O-dealkylation, 27-fold). UGT1A mRNA was induced by β-naphthoflavone (2-fold), and MDR1 (P-glycoprotein) mRNA was induced by rifampin (3-fold). These preliminary data using a few prototypical inducers show that Fa2N-4 cells can be a reliable surrogate for primary human hepatocytes, and, when used in conjunction with the Invader technology, could provide a reliable assay for assessment of induction of drug-metabolizing enzymes and transporters.
Drug-metabolizing enzymes, including cytochromes P450 (P450s), and transporters are involved in the clearance of drugs. Drug-drug interactions involving drug-metabolizing enzymes and transporters are of increasing interest due to reports of adverse reactions and loss of efficacy (Baciewicz et al., 1987; Spina et al., 1996). During drug development, in vitro assays can be used to avoid inducers, and characterize drug-drug interaction potential due to increased drug clearance by the liver.
P450s are involved in the metabolism of drugs, primarily in the liver. Induction of CYP3A gene expression is caused by a variety of marketed drugs, including rifampin, phenobarbital, clotrimazole, and dexamethasone (Meunier et al., 2000; Sahi et al., 2000; Luo et al., 2002; Madan et al., 2003) and represents the basis for a number of common drug-drug interactions. CYP1A2 is inducible by 3-methylcholanthrene, β-naphthoflavone, and tetrachlorodibenzodioxin (Li et al., 1998; Breinholt et al., 1999; Meunier et al., 2000; Madan et al., 2003). CYP2C9 can be induced by rifampin and phenobarbital; however, the magnitude of induction is less than that for CYP3A4 (Li et al., 1997; Madan et al., 2003). Inducers of the UGT1A family include rifampin, chrysin, and β-naphthoflavone (Abid et al., 1997; Li et al., 1997; Breinholt et al., 1999). The MDR1 gene product P-glycoprotein is an important drug efflux transporter. Inducers of P-glycoprotein include rifampin, phenobarbital, clotrimazole, and dexamethasone (Schuetz et al., 1996; Geick et al., 2001; Sahi et al., 2003).
The pregnane X receptor is the major determinant of CYP3A gene regulation by drugs and other xenobiotics (Bertilsson et al., 1998; Lehmann et al., 1998; Pascussi et al., 2003). In addition, pregnane X receptor mediates induction of P450s 2B6, 2C8/9, and 3A7, as well as the drug transporters MDR1, organic anion transporting polypeptide C, bile salt export protein, and multidrug resistance-associated protein 2 (Pascussi et al., 2003; Tirona et al., 2003). Other nuclear hormone receptors involved in induction of absorption, distribution, metabolism, excretion, and toxicity endpoints include glucocorticoid receptor (CYP2B6, CYP2C8/9, and CYP3A4/5), constitutive androstane receptor (UGT1A, CYP2B6, CYP3A4, and CYP2C9), and peroxisome proliferator-activated receptor (CYP4A) (Ferguson et al., 2002; Pascussi et al., 2003). A cytosolic receptor, the aryl hydrocarbon receptor, is involved in the induction of the CYP1A subfamily (Whitlock et al., 1996).
The ability to evaluate P450 induction in human hepatocytes is highly desirable because several drugs are known to induce P450 enzymes in humans but not rats, and vice versa (Bertilsson et al., 1998; Moore and Kliewer, 2000). For example, pregnenolone 16-α-carbonitrile induces CYP3A in rats but not humans, whereas rifampin is a known inducer of CYP3A in humans but not rats. Primary cultures of human hepatocytes have the distinct advantage of exhibiting species-specific induction of P450 isoforms, but are dependent on the availability of fresh cells and donor-to-donor variability. Cell lines such as HepG2, LS180, and LS174T, have been useful in studying induction of a limited subset of P450s and drug transporters (Schuetz et al., 1996; Li et al., 1998; Geick et al., 2001), but lack adequate response for other inducible targets (Silva and Nicoll-Griffith, 2002).
Induction of drug-metabolizing enzymes and drug transporters can be detected at the mRNA level (Schuetz et al., 1996; Abid et al., 1997; Li et al., 1998; Ferguson et al., 2002). The Invader assay (Kwiatkowski et al., 1999; Eis et al., 2001) quantifies transcript expression from total RNA extracted from cultured cells. It is an isothermal detection of RNA and does not require a polymerase chain reaction amplification step. An overlap between oligonucleotides consisting of an upstream invasive deoxyoligonucleotide and a downstream deoxynucleotide probe are both annealed to the RNA target, followed by cleavage by a 5′ nuclease of the downstream probes. A second cleavage reaction utilizes a fluorescence resonance energy transfer oligonucleotide that further amplifies the signal. This assay can differentiate between closely related RNA transcripts, such as in P450 subfamilies (Eis et al., 2001).
For the current studies, we have used the immortalized human hepatocyte cell line Fa2N-4. We have characterized these cells by studying their drug-metabolizing enzymes, both at the level of the transcript and enzyme activity. We have also studied the induction potential of the Fa2N-4 cells by treating them with a few prototypical inducers of the major drug-metabolizing enzymes and monitoring changes in mRNA and enzyme activities. The present work describes the utilization of the immortalized human hepatocytes Fa2N-4 in combination with the mRNA detection Invader assay as a potential method to predict clinical drug-drug interactions due to increase in the transcription of genes encoding drug metabolizing enzymes or transporters.
Materials and Methods
Chemicals
Phenobarbital (5-ethyl-5-phenyl-2,4,6-trioxohexahydropyrimidine), dexamethasone (9-α-fluoro-16-α-methylprednisolone), β-naphthoflavone (5,6-benzoflavone), rifampin (3-[4-methylpiperazinyliminomethyl] rifamycin SV), clotrimazole (1-[o-chloro-α-,α-diphenylbenzyl]-imidazole), and 1-cyclohexyl-3-(morpholinoethyl) carbodiimide metho-para-toluenesulfonate, testosterone, 6-hydroxytestosterone, 7-ethoxyresorufin, resorufin, hydrocortisone, and diclofenac were purchased from Sigma-Aldrich (St. Louis, MO). 4′-Hydroxydiclofenac was purchased from BD Gentest (Woburn, MA). [13C6]-4′-OH-diclofenac was produced internally at Pfizer Global Research and Development.
Induction of Fa2N-4 Cells
This cell line originated from human hepatocytes isolated from a 12-year-old female donor and were immortalized via transfection with the simian virus 40 large T antigen. Fa2N-4 cells (Fig. 1) were obtained from MultiCell Technologies (Warwick, RI) and cultured as follows. For RNA analysis, multiwell plates were precoated with a rigid collagen complex composed of 2.75 mM 1-cyclohexyl-3-(morpholinoethyl) carbodiimide metho-para-toluenesulfonate and 4% (v/v) Vitrogen 100 purified collagen (Cohesion, Palo Alto, CA) in sterile saline (0.9% NaCl). Excess collagen was removed before cell plating. For enzyme activity analysis, Biocoat type I collagen plates were used (BD Biosciences, Bedford, MA). Fa2N-4 cells were plated at confluence in MFE media (MultiCell Technologies) supplemented with 100 units/ml penicillin, 100 μg/ml streptomycin, and 10% fetal bovine serum (Invitrogen, Carlsbad, CA). Media was replaced with serum-free MFE media supplemented with 100 units/ml penicillin and 100 μg/ml streptomycin after cell attachment (approximately 3 h). Cells were kept in an incubator set at 37°C, 5% carbon dioxide, and 95% relative humidity. Media were replaced with fresh serum-free MFE media supplemented with 100 units/ml penicillin and 100 μg/ml streptomycin every 24 h. Treatment of cells with drug was initiated 48 h after plating. For RNA quantification, cells were exposed to drug for 48 h. For enzyme activity studies, cells were exposed to drug for 72 h.

Fa2N-4 cells. Phase contrast image of confluent Fa2N-4 cells plated in 96-well Biocoat type I collagen plates (BD Biosciences) in MFE media (MultiCell Technologies) at 200× magnification.
RNA Analysis
Total RNA was extracted from cells using the mini RNeasy kit according to instructions provided by the manufacturer (QIAGEN, Valencia, CA). RNA (100 ng) was analyzed using the Invader RNA assay reagent kits according to instructions provided by the manufacturer (Third Wave Technologies, Madison, WI). Statistical analysis for increased levels of RNA in samples compared with vehicle-treatment was conducted using the two-sample, unpaired Student's t test with p < 0.05 indicating significant differences. Statistical analysis for increased levels of RNA to compare multiple treatments (more than two samples) was conducted using analysis of variance with p < 0.05 indicating significant differences, for the purpose of rank ordering multiple inducers.
Enzyme Activity
CYP3A4. Activity was determined by measuring the extent of 6β-hydroxytestosterone formation from testosterone by mass spectrometry, essentially as described by Wood et al. (1983), Sonderfan et al. (1987), and Sonderfan and Parkinson (1988), with the following modifications. Test drugs were washed from cells by removing dosing media, replacing with fresh media, and incubating cells for 1 h. After removing wash media, reactions were started with the addition of 250 μl of MFE media containing 200 μM testosterone to the tissue culture well. At 30 min, aliquots were removed for analysis via HPLC or LC/MS/MS. For LC/MS/MS analysis, the aliquot was mixed with 1 volume of acetonitrile spiked with 250 ng/ml hydrocortisone. Mass spectrometry was carried out with a PerkinElmer 200 HPLC system and a Micromass Quattro II detector. Samples were injected and were ionized using the electrospray positive ion mode in a mobile phase of 70:30 methanol/trifluoroacetic acid 0.02% (v/v) at 0.20 ml/min (isocratic) and a Keystone Aquasil C18, 100 × 2.1-mm, 5-μm particle size column. Some of the studies used an HPLC-UV assay for testosterone metabolism, as follows: 200 μl of medium was mixed with 5 μl of internal standard solution (20 μg/ml prednisolone in acetonitrile) and evaporated to approximately 50 μl. Samples (20 μl) were then injected on an Agilent 1100 HPLC system using an Agilent Zorbax Eclipse XDB-C8 column (4.6 × 150 mm) with UV detection at 254 nm. Mobile phase A consisted of 10 mM ammonium phosphate in water, and mobile phase B consisted of 100% acetonitrile. Initial conditions were 35% B for 3 min, increasing to 65% B over 2 min, and then at 10 min, returning to 35% B, for a total run time of 15 min. Retention times were 2.8, 3.0, and 7.0 min for 6-β-hydroxy-testosterone, prednisolone, and testosterone, respectively. The standard curve for 6-β-hydroxy-testosterone was linear from 25 ng/ml to at least 1000 ng/ml. Peak area for 6-β-hydroxy-testosterone was normalized to internal standard, and reported as fold-change from DMSO-treated cells.
CYP2C9. Activity was determined by measuring the extent of 4′-hydroxydiclofenac formation using the method of Leemann et al. (1993), modified as follows. Test drugs were washed from cells by removing dosing media, replacing with fresh media, and incubating cells for 15 min. After removing wash media, reactions were started with the addition of 250 μl of MFE media containing 7.5 μM diclofenac to each well. Aliquots were removed at 60 min for LC/MS/MS analysis. Mass spectrometry was carried out with a PerkinElmer 200 HPLC system and a Micromass Quattro II detector. Samples were injected and were ionized using the electrospray positive ion mode in a mobile phase of 50:50 acetonitrile/0.1% formic acid in water (v/v) at 0.27 ml/min (isocratic) and a Phenomenex, Synergi Max RP, 50 × 2.0-mm, 4-μm particle column.
CYP1A2. Activity was determined by measuring the extent of O-dealkylation of 7-ethoxyresorufin using the fluorometric method of Burke et al. (1985), with minor modifications (Rodrigues and Prough, 1991). Test drugs were washed from cells by removing dosing media, replacing with fresh media, and incubating cells for 15 min. After removing wash media, reactions were started with the addition of 250 μl of MFE media containing 7-ethoxyresorufin (20 μM) to each well. Aliquots were removed at 15 min for fluorometric analysis.
Metabolites were quantified by comparing measurements to standard curves. The concentration of protein for each cell treatment was determined with Bio-Rad DC reagents (Hercules, CA) according to instructions provided by the manufacturer, using bovine serum albumin as standard. Values were used to calculate enzyme activities as picomoles of metabolite per milligram protein per minute of incubation.
Results
Inductive Response of Fa2N-4 Cells to Known Inducers of Drug-Metabolizing Enzymes and Drug Transporters. As illustrated in Fig. 2, Fa2N-4 cells are useful for monitoring several endpoints, including CYP1A2, CYP2C9, CYP3A4, UGT1A, and MDR1 using the known inducers rifampin (induces CYP2C9, CYP3A4, UGT1A, and MDR1), phenobarbital (induces CYP2C9, CYP3A4, and MDR1), dexamethasone (induces CYP3A4 and MDR1), and β-naphthoflavone (induces CYP1A2 and UGT1A). Increases in transcripts can be observed for all positive controls. In comparison with the vehicle control, CYP1A2 transcript was increased 15-fold after treatment with 10 μM β-naphthoflavone, but not significantly increased with other inducers. CYP2C9 transcript was increased 3.8-fold with 10 μM rifampin, 2.6-fold with 1 mM phenobarbital, and not induced by treatment with 50 μM dexamethasone, nor 10 μM β-naphthoflavone. CYP3A4 transcript was increased 17-fold with 10 μM rifampin, 9.2-fold with 1 mM phenobarbital, and 1.3-fold with 50 μM dexamethasone. UGT1A transcript was increased 2.1-fold with 10 μM β-naphthoflavone, and not induced by treatment with 1 mM phenobarbital, nor 50 μM dexamethasone. Rifampin induction of UGT1A was not statistically significant (p = 0.08). MDR1 transcript was increased 3.1-fold with 10 μM rifampin, 2.3-fold induction with 1 mM phenobarbital, 1.3-fold induction with 50 μM dexamethasone, and there was no MDR1 induction by 10 μM β-naphthoflavone. Table 1 summarizes the induction data in Fa2N-4 cells for three P450s expressed as fold increase in mRNA compared with published data in primary hepatocytes.

Induction of CYP1A2, CYP2C9, CYP3A4, UGT1A, and MDR1 transcripts in Fa2N-4 cells. Fa2N-4 cells were plated in 24-well plates and exposed to 0.1% DMSO vehicle (open columns), 10 μM rifampin (red columns), 1000 μM phenobarbital (blue columns), 50 μM dexamethasone (green columns), and 10 μM β-naphthoflavone (black columns) for 48 h. The levels of transcripts were quantified from total RNA isolated from the treated cells. Plot represents the mean ± S.D. from the data of quadruplicate samples. Asterisk denotes statistically significant increase in transcript versus vehicle control treatment (Student's t test, p < 0.05). CYP3A4 inducers were significantly different from each other using analysis of variance (p < 0.05).
Summary of reported inductive response in Fa2N-4 cells compared with response of primary human hepatocytes
P450 Enzyme Activity in Fa2N-4 Cells. CYP3A4 activity increased 8.9-fold and 2.1-fold, as assessed by increases in formation of the 6-β-hydroxytestosterone with 10 μM rifampin and 50 μM dexamethasone, respectively, compared with vehicle-treated control (Fig. 3A). Formation of 4′-hydroxydiclofenac for assessment of CYP2C9 activity was increased approximately 2-fold for treatments with 10 μM rifampin and 1 mM phenobarbital (Fig. 3B). Fold changes in the ethoxyresorufin O-dealkylase assay for CYP1A2 were 27-fold with 10 μM β-naphthoflavone (Fig. 3C).

Measurement of induction by cytochromes 450 enzyme activity. Induction of CYP3A4, CYP2C9, and CYP1A2 enzyme activity in Fa2N-4 cells after 72 h exposure to 0.1% DMSO vehicle (VEH) or inducer. Study was conducted using a 12-well plate format. Data represents enzyme activity in terms of metabolite formed per milligram of total Fa2N-4 protein per minute of incubation with parent compound. Data are from duplicate assays denoted by open and closed columns. A, measurement of CYP3A4 activity by formation of the testosterone metabolite 6-β-hydroxytestosterone in cells induced with vehicle, 10 μM rifampin (RIF), and 50 μM dexamethasone (DEX). B, measurement of CYP2C9 activity by formation of the diclofenac metabolite 4′-hydroxydiclofenac in cells induced with vehicle, 10 μM RIF, and 1000 μM phenobarbital (PB). C, measurement of CYP1A2 activity by O-dealkylation of 7-ethoxyresorufin in cells induced with vehicle or 50 μM β-naphthoflavone (BNF).
In addition to examining the inductive effect of a single concentration of drug, the Fa2N-4 cells can also be used to look at dose-response relationships. For example, EC50 values were calculated based on the response of Fa2N-4 cells dosed with multiple concentrations of rifampin ranging from 100 nM to 50 μM. Figure 4 contains EC50 plots for Fa2N-4 cells using increased CYP3A4 transcript values (Fig. 4A), as well as increased CYP3A4 enzyme activity (Fig. 4B). The calculated EC50s were 0.43 μM (r2 = 92) and 0.77 μM (r2 = 94), for the transcript and enzyme activity, respectively. In addition, the calculated maximum induction (Imax) values were 13-fold for the transcript endpoint and 9.7-fold for the enzyme activity endpoint.

Dose-response dependence of CYP3A4 induction by rifampin in Fa2N-4 cells. Measurement of induction of CYP3A4 was performed in Fa2N-4 cells treated with 100 nM to 50 μM rifampin. Data were fitted using SigmaPlot (version 8) using a 3-parameter sigmoidal curve. A, total RNA was analyzed to determine level of CYP3A4 transcript and then compared with vehicle control to determine fold induction. Data represents mean ± S.D. from the data of triplicate samples. B, CYP3A4 activity was measured by formation of the testosterone metabolite 6-β-hydroxytestosterone and then compared with vehicle control to determine fold induction. Data represents mean ± S.D. from the data of triplicate samples.
Fa2N-4 Inductive Response over Multiple Passages. Multiple passages of the Fa2N-4 cells have been tested for CYP3A4 induction. Figure 5 shows response of multiple passages of Fa2N-4 cells to a CYP3A4 inducer with a weak response (50 μM dexamethasone) and a CYP3A4 inducer that exhibits a strong response (10 μM rifampin). Treatment with dexamethasone increased CYP3A4 transcripts, 1.6-fold and 1.5-fold at passages 21 and 36, respectively. Treatment with 10 μM rifampin increased CYP3A4 transcripts, 17-fold and 16-fold at passages 21 and 36, respectively (Fig. 5A). CYP3A4 enzyme activity was increased 2.1-fold and 2.0-fold for dexamethasone and 8.9-fold and 4.9-fold for 10 μM rifampin at passages 28 and 36, respectively (Fig. 5B).

Induction of CYP3A4 in different passages of Fa2N-4 cells. Various passages of Fa2N-4 cells were plated in 24-well plates and exposed to 0.1% DMSO vehicle (open columns), 50 μM dexamethasone (striped columns), and 10 μM rifampin (black columns). A, levels of CYP3A4 transcripts were quantified from isolated total RNA. Plot represents the mean ± S.D. from the data of quadruplicate samples. B, CYP3A4 activity was measured by formation of the testosterone metabolite 6-β-hydroxytestosterone. Plot represents the mean of duplicate samples. All compounds showed statistically significant increase in transcript versus vehicle control treatment (Student's t test, p < 0.05).
Capacity for HTS with Fa2N-4 Cells and Invader Assay.Fig. 6 compares various multiwell plate formats. Regardless of the plate format, Fa2N-4 cells exhibit substantial CYP3A4 inductive response to rifampin. Fold changes in CYP3A4 transcript were 17.1-fold when using a 24-well plate, 6.6-fold when using a 24-well plate, and 5.7-fold for when using a 96-well plate.
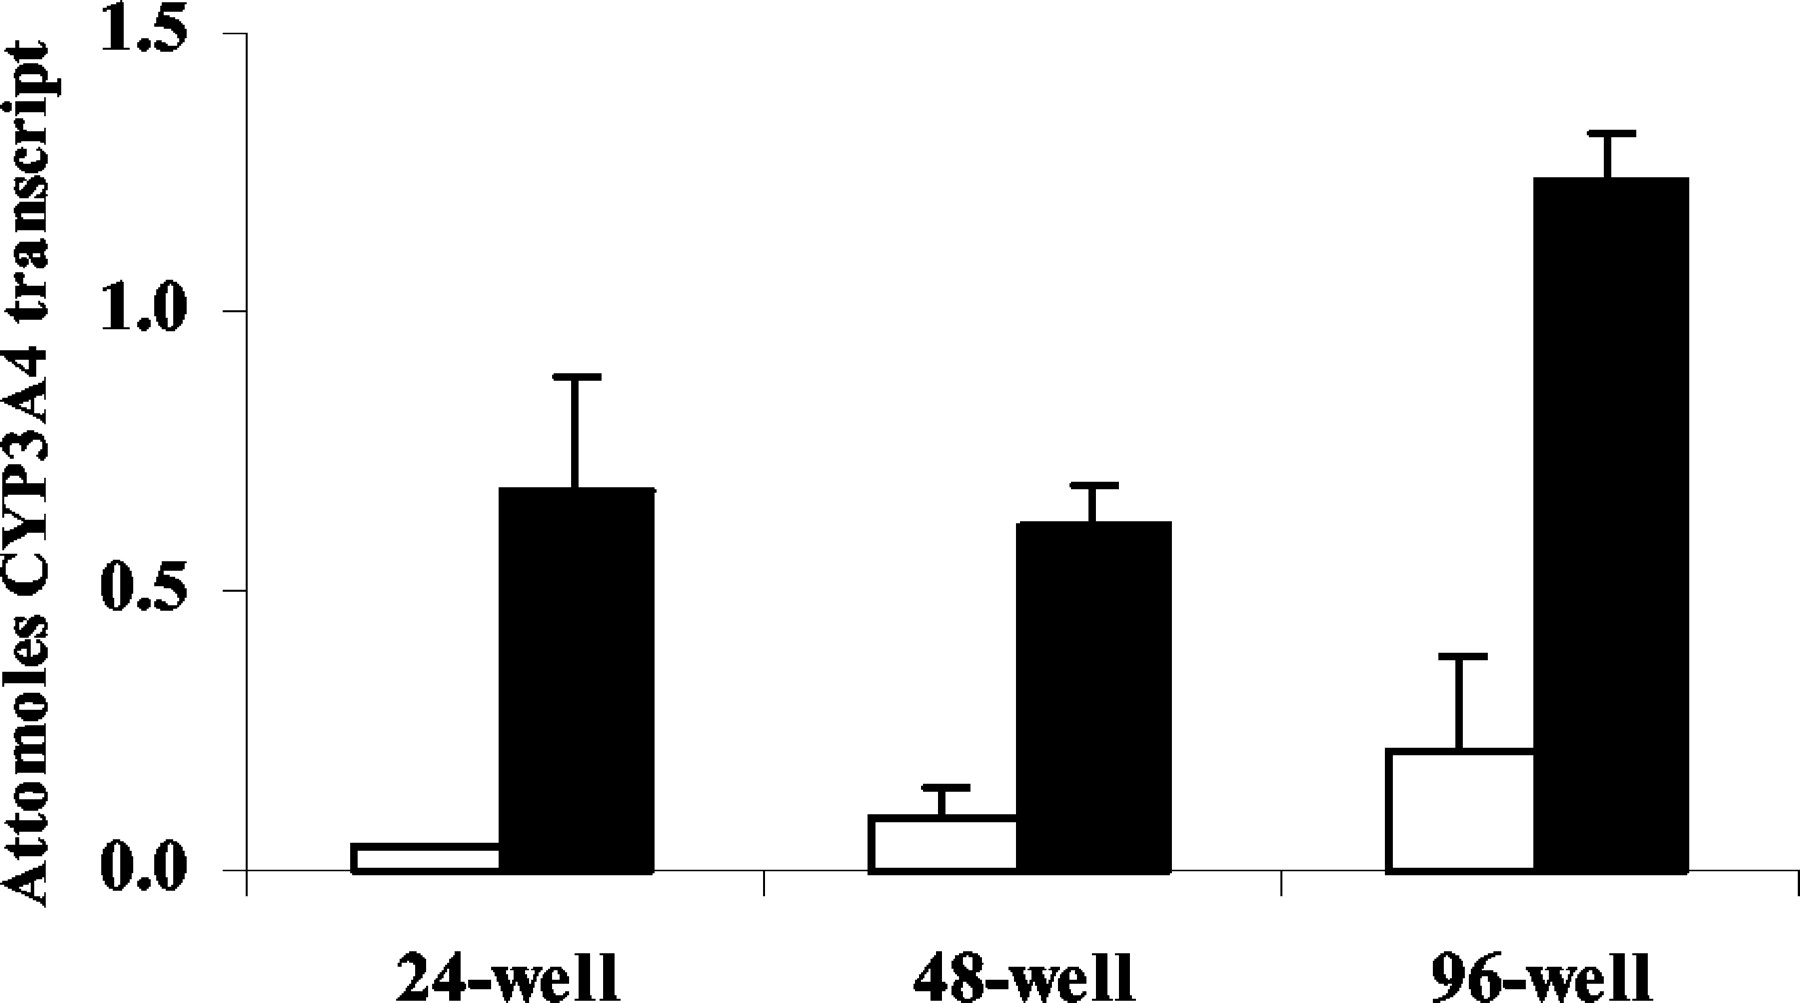
Comparison of CYP3A4 induction in various multiwell plate formats. Induction of CYP3A4 transcript in Fa2N-4 cells after 48-h exposure to 10 μM rifampin (closed columns) in comparison with vehicle (open columns). Data are from studies conducted in each multiwell plate format as indicated. Plot represents the mean ± S.D. from the data of quadruplicate samples. All compounds showed statistically significant increase in transcript versus vehicle control treatment (Student's t test, p < 0.05).
Discussion
The Fa2N-4 cells have the ability to induce CYP1A2, CYP2C9, CYP3A4, UGT1A, and MDR1 mRNA in response to known inducers. Using CYP3A4 transcript as an endpoint, we have demonstrated the ability of the assay to rank inducers according to potency and demonstrate dose-response for rifampin as observed previously in primary human hepatocytes (Li et al., 1997; Sahi et al., 2000). In addition to distinguishing inducers from noninducers, this assay has a wide dynamic range for some endpoints such as CYP3A4 and CYP1A2, enabling rank ordering for induction potency. The same decreasing potency for CYP3A4 inducers (rifampin > phenobarbital > dexamethasone) has been previously reported in the literature for studies in primary human hepatocytes using both mRNA and enzyme activity endpoints (Luo et al., 2002). Our results using mRNA induction in Fa2N-4 cells are in good agreement with the publication by Madan et al. (2003), who reported the effects of prototypical inducers for CYP1A2, CYP2C9, and CYP3A4 in cultured primary human hepatocytes by measuring enzyme activity in microsomes preparations from treated cells (Table 1). The rank order for CYP3A4 induction potency for rifampin and phenobarbital expressed as fold induction over vehicle controls was the same in both studies. CYP2C9 was also induced, albeit to a lesser extent than CYP3A4, and CYP1A2 had the highest response in both systems. Another study (Sahi et al., 2000) using primary human hepatocytes reported the EC50 for rifampin in CYP3A4 induction, using an activity assay. Those results are also in good agreement with our own EC50 results using the Fa2N-4 cells and mRNA measurements.
This immortal hepatocyte clone was identified in a screen of several of clones where the best response to rifampin induction of CYP3A4 was the selection criteria. Hence, the most appropriate utilization of this assay is for CYP3A4 induction. Further characterization of this clone indicated that it had high response to a CYP1A2 inducer, enabling also the detection of this endpoint in a screening format. The dynamic range of the responses to CYP2C9 and MDR1 were smaller, but they were in the same proportion as the inductive response found in fresh hepatocytes (Li et al., 1997; Madan et al., 2003; Sahi et al., 2003)
Although the average UGT1A transcript was higher in rifampin-treated Fa2N-4 cells than in vehicle-treated cells, the level of induction was not statistically significant. Previous induction studies in primary human hepatocyte cite interindividual variation in the effects of rifampin, using 1-naphthol glucuronidation as an endpoint. Abid et al. (1997) reported that the variability may be attributed to differential induction of two UGT1A isoforms. The Invader UGT1A oligos used here span a common region in the RNA among all isoforms, and measurement of mRNA is a sum of all UGT1A isoforms. Thus, the inductive effect on rifampin could have been minimized by the noninduced UGT1A isoforms. It is likely that probes designed for individual UGT1A isoforms would be able to detect significant increases in their mRNA.
Induction in the Fa2N-4 cells is not limited to mRNA and can also be assessed at the enzyme activity level. The extent of induction using mRNA quantified with Invader correlated well with enzyme activity data as indicated by similar rank order for several prototypical inducers. The ability to induce P450 enzyme activity provides further evidence on the expression of a comprehensive array of P450s in the Fa2N-4 cells. In addition, it shows the potential of these cells for alternative applications, such as P450 inhibition or metabolite generation.
The Invader assay can adequately quantify induction based on mRNA level increases. Advantages of the mRNA endpoint include increased throughput and target specificity. For enzyme activity, a separate well in a multiwell plate must be used for each enzyme activity endpoint, whereas a single well can be used to assess multiple mRNA targets. The recovery of RNA from each sample (24-well plate) is high enough to run up to 50 separate mRNA endpoints. The Invader assay is able to discriminate among closely related P450s, whereas enzyme activity assays are not always specific. For example, O-dealkylation of 7-ethoxyresorufin characterizes the combination of CYP1A1 and CYP1A2, and 6-β-hydroxytestosterone can also be formed by both CYP3A4 and CYP3A5 (Williams et al., 2002).
In contrast to fresh human hepatocytes, Fa2N-4 cells are readily available. Because accessibility to fresh human hepatocytes is reliant on availability of a suitable liver tissue donor, it can take a long time to conduct experiments using hepatocytes isolated from three different livers to verify that a certain compound is an inducer. In addition, plating efficiency of fresh hepatocytes is unpredictable, so it is not uncommon to have a suitable donor, but find that the cells are not usable due to poor plating efficiency or substandard cell health. Fa2N-4 cells can be passaged and used over several passages while retaining activity of the major drug-metabolizing enzymes. With fresh human hepatocytes, cells can only be used one time, making it difficult to compare data between studies. Plateable cryopreserved primary human hepatocytes are an improvement by theoretically allowing multiple experiments at different times from a single donor, or potentially the use of multiple donors at one time. However, plateable cryopreserved primary human hepatocytes are in limited supply. Both fresh primary human hepatocytes and plateable cryopreserved primary human hepatocytes have donor-to-donor variability, based on the influence of genetics, the environment, and comedications. There are vast differences seen in the drug-metabolizing enzyme profile of donors, leading to the current recommendation of obtaining data from three donors before reaching a conclusion for induction potential of a chemical. In addition, some authors cite the necessity for potency indexes to compare data between donors (Silva and Nicoll-Griffith, 2002). The potency index standardizes data between donors by reporting the ratio of induction response (i.e., fold induction) of the test compound to that of a prototypical inducer.
Thus, our preliminary data using a few prototypical inducers demonstrates that Fa2N-4 cells can be a suitable substitute for fresh human hepatocytes in induction studies, and provide the additional attribute of being amenable for higher throughput studies. Fa2N-4 cells are superior to previously published immortal cell lines, as they show induction of a varied number of genes. These cells can be used to determine the induction potential of a drug, with findings consistent with monitoring increased enzyme activity in primary human hepatocytes. Higher throughput cell culturing and analysis via mRNA endpoint enables more compounds to be tested and reduces the cost per compound; two favorable traits for drug discovery assays. Future studies will focus on expanding the number of inducers and absorption, distribution, metabolism, and excretion endpoints tested. Pending more extensive evaluation, this induction assay has the potential of becoming a useful tool for pharmaceutical companies to eliminate compounds with drug-drug interaction potential and to understand the likelihood and extent of drug-drug interaction for compounds in development.
Acknowledgments
We thank Ronald A. Faris, Jin Liu, Stephanie Cascio, Henry Santangini, Kathy Garcia, and Paul Silva of MultiCell Technologies for the Fa2N-4 clone and the scientific collaborations; Sharon Ripp of Pfizer Groton Laboratories for contribution to CYP3A4 enzyme activity data; Teresa Jenkinson and Mike Banker of Pfizer Groton Laboratories for the photomicrograph of the Fa2N-4 cells; Kelly Longo of Pfizer Strategic Alliances for support; and Bo Feng, Ronald Scott Obach, and Ted Liston of Pfizer Groton Laboratories for suggestions and critical reading of this manuscript.
Footnotes
-
DOI: 10.1124/jpet.103.061713.
-
ABBREVIATIONS: P450, cytochrome P450; MDR1, multidrug resistance 1; HPLC, high-performance liquid chromatography; LC/MS/MS, liquid chromatography/tandem mass spectrometry; DMSO, dimethyl sulfoxide.
- Received October 15, 2003.
- Accepted December 5, 2003.
- The American Society for Pharmacology and Experimental Therapeutics


