


Abstract
The regulatory mechanism responsible for a paradoxal, rapid drop in the erythropoietin (EPO) plasma level seen 2 to 4 days after acute, phlebotomy-induced anemia was investigated in seven adult sheep. To introduce acute anemia, each sheep underwent two phlebotomies where the hemoglobin (Hb) was reduced to 3 or 4 g/dl over 4 to 5 h. The phlebotomies were spaced 4 to 6 weeks apart in three animals, and 8 days apart in four other animals. EPO plasma levels, reticulocyte count, Hb, and p50 for oxygen-Hb dissociation were determined from frequent blood samplings throughout the study period. EPO's disposition pharmacokinetic (PK) and plasma clearance were determined from i.v. bolus injections of tracer amounts of a recombinant human EPO tracer. The controlled drop in Hb resulted in a rapid increase in plasma EPO to 836 ± 52 mU/ml (mean ± coefficient of variation percentage) that was followed by a paradoxical rapid drop 2 to 4 days after the phlebotomy while the animals were still very anemic (Hb = 4.3 ± 15 g/dl). The rapid drop in plasma EPO level could not be explained by the up-regulated clearance (clearance increased by a factor of less than 2.5) or by physiological adaptation (no change in p50, p > 0.05, second phlebotomy to Hb = 3g/dl inadequately stimulated the EPO production). The PK/pharmacodynamic (PD) analysis supports the hypothesis of a limited sustained high EPO production rate in acute anemia, which indicates an apparent deficiency in the regulation of EPO production in acute anemia. The hypothesis was supported by a PK/PD feedback inhibition model that showed good agreement with the data (r = 0.973 ± 1.57).
Erythropoietin (EPO) is a 34-kDa glycoprotein that is the primary hormone regulator of erythrocyte production. The main objectives of the present study are to elucidate quantitatively the kinetic regulatory mechanisms responsible for the rapid drop in EPO plasma level seen 2 to 4 days after phlebotomy-induced acute anemia while the Hb is still very low and to identify kinetic parameters of importance in EPO's production to provide a scientific basis for optimal use of EPO. Addressing these two objectives will provide a better understanding of the many factors affecting the erythropoiesis that should lead to more effective clinical use of EPO. Previously, we published a PK/PD analysis that simultaneously linked EPO plasma level, reticulocyte, and Hb responses (Veng-Pedersen et al., 2002). However, a PK/PD analysis of the physiology of EPO production under induced phlebotomy anemia has not been reported. Therefore, this work extends our previous work by kinetically analyzing the next step in the erythropoiesis, namely, EPO production and its regulation.
This physiology-oriented analysis is done through a comprehensive, integrated PK/PD analysis, which simultaneously quantitatively links the Hb concentration, EPO production, and plasma level responses. Of particular interest of the proposed kinetic model is its ability to estimate a number of physiologically important parameters and to provide a kinetic foundation for better estimating and understanding the parameters important in the production of EPO. The analysis, although primarily focusing on the regulatory aspects of EPO production, also takes into account the well established role of saturable receptor-mediated elimination as an example of target-mediated drug disposition (Levy, 1994). Physiological modeling approaches to receptor-mediated endocytosis have been described for some protein drugs (Kato et al., 1996; Sata et al., 1996; Sugiyama et al., 1999) in addition to a general model for target-mediated kinetics (Mager and Jusko, 2001). In agreement with our own published work, these models enable nonlinear disposition properties to be considered such as receptor-based mechanisms for up- and down-regulated drug clearance, and regulation of the receptor population. However, as pointed out in this work, we have found these receptor-based mechanisms insufficient in explaining the magnitude of the apparent paradoxal regulation of the EPO production observed in acute, phlebotomy-induced anemia. The present PK/PD analysis deviates from previous receptor-based analysis by investigating other factors important in the regulation of the EPO production.
Materials and Methods
Study Animals. All surgical and experimental procedures received prior approval by the local institutional animal care review committee. Seven healthy normal young adult sheep were selected. The animals were 2 months old and weighed 22.2 ± 10 kg (mean ± coefficient of variation percentage) at the beginning of the experiments. The animals were housed in an indoor, light- and temperature-controlled environment. All animals were in good health. Jugular venous catheters were placed under anesthesia using pentobarbital. Intravenous ampicillin (1 g) was administered daily for the first 3 days after surgery.
Study Protocol. An increase in endogenous EPO was induced by controlled phlebotomy performed using the jugular venous catheter. Animals were bled to hemoglobin levels of between 3 and 4 g/dl over a 4- to 5-h period. To maintain a constant blood volume during the procedure, equal volumes of 0.9% NaCl solution were infused for each volume (∼2 liters) of blood removed. Each animal underwent two such phlebotomies performed either 4 to 6 weeks (n = 3) or 8 days (n = 4) apart. No extra iron supplementation other than through food was given to any subjects in this study. Unit impulse response (UIR) functions (Veng-Pedersen, 1988) and EPO plasma clearances were determined 7 to 10 times over the span of the kinetic study in each sheep from intravenously bolus administrations (<30 s) of a tracer dose of biologically active 125I-rhEPO (14 × 104 ± 18 cpm/kg, equivalent to 0.1 ± 18 mU/kg). Ten to 15 plasma samples were drawn over the 7- to 8-h study period after each EPO tracer dosing. To minimize erythrocyte loss due to frequent blood sampling, plasma was removed by centrifugation and the red blood cells were reinfused. One or two i.v. bolus 125I-rhEPO tracer PK studies were done before each phlebotomy to determine baseline EPO plasma clearances.
Laboratory Analysis. EPO concentrations, reticulocyte counts, Hb, and p50 for oxygen-Hb dissociation were measured on one to four blood samples per day drawn throughout the study period. Plasma EPO concentration was measured in triplicate using a double antibody radioimmunoassay procedure as described previously (Widness et al., 1986). Linear assay values for EPO concentrations are obtained between 10 and 450 mU/ml in the sheep RIA. Plasma samples were assayed for 125I-rhEPO using a sensitive and specific double antibody immunoprecipitation assay developed in our laboratory (Widness et al., 1992) with a lower level of detection of 0.04 mU/ml. All samples were measured in the same assay to reduce assay variability.
The number of reticulocytes was determined by flow cytometry (FACScan; BD Biosciences, San Jose, CA) as described by Peters et al. (1996). Hb was measured spectrophotometrically using a CO-Oximeter (IL482; Instrumentation Laboratory, Watham, MA). p50 was measured according to the International Federation of Clinical Chemistry guideline (Wimberley et al., 1990).
PK/PD Analysis. A mechanistic mathematical model was developed to describe the acute anemia-induced changes in the EPO plasma level considering our proposed feedback inhibition mechanism for EPO's production that is aimed at explaining the paradoxal drop in the EPO plasma occurring while the animals are still very anemic (∼4 g/dl Hb).
The proposed model (Fig. 1) used to asses the regulatory mechanism for EPO production consists of three compartments, namely, 1) an EPO production compartment labeled mRNA; 2) a central EPO sampling compartment labeled CEPO, representing the blood plasma being sampled for the plasma concentration of EPO (CEPO); and 3) a distribution compartment (not shown), representing the reversible distribution space (Fig. 1, double arrow), reached from the sampling compartment. The rate of change of CEPO in the sampling compartment is determined fundamentally by three rate processes: 1) the rate of EPO production defined as the rate of input of new EPO into the sampling compartment (Fig. 1, K2 pathway); 2) the rate of generalized elimination (irreversible elimination + elimination due to distribution, represented by the three exit arrows from sampling compartment; Fig. 1); and 3) the rate of return of EPO from the distribution space. The model proposes that the rate of irreversible elimination of EPO from the sampling compartment occurs via two routes, namely, a route with a nonlinear elimination following Michaelis-Menten kinetics (represented by Michaelis-Menten parameters VM and KM, Fig. 1), and a route with a linear elimination following a regular first-order elimination kinetics (Fig. 1, rate parameter K1). This proposed elimination kinetics is consistent with our previous finding (Veng-Pedersen et al., 2003) that EPO is eliminated nonlinearly via a saturable erythropoietic mechanism and linearly via an apparent nonerythropoietic mechanism. The distribution effect in the PK model is represented by a distribution function (G·e-γt) according to disposition decomposition analysis principles (Veng-Pedersen, 1984).

The production compartment is defined as the compartment that in a first-order manner (K2) input new CEPO into the sampling compartment proportional to the quantity of mRNA coded for EPO production. The formation of mRNA is presented by a zero-order formation rate parameter (Fig. 1, K0) that is up-regulated by activation from the oxygen sensor(s) and down-regulated by an unknown endogenous factor (R). It is assumed that the R is also up-regulated by the phlebotomy-induced anemia. The model incorporating the above-proposed mechanisms is described by the following integro-differential equations: 
 where K0 is a zero-order formation constant, R is a negative modulator of EPO mRNA, and the effect of compound R on EPO mRNA level is given by two parameters, R50 and φ. The effect of oxygen sensing is represented by the variable ΔHb(t) (eq. 3) and the Hill equation parameters C50, K′, and λ.
  Hb(0) represents the Hb concentration at baseline and Hb(t) is the Hb concentration at time t. Baseline Hb concentration was predetermined by averaging five to eight points before the phlebotomy started. In eq. 2, KM and VM are Michaelis-Menten parameters, K1 is a first-order elimination rate constant, G and γ are distribution function parameters, and * denotes convolution.
The unknown endogenous factor R, which modulates the production of the mRNA (eq. 1), is up- and down-regulated according to the following proposed model:  Because the sheep were only 2 months old at the beginning of the experiments, they underwent a significant normal developmental weight gain over the study period (30.9 ± 102% increase). Accordingly, when we initially ignored this weight gain in our analysis we observed changes in some disposition PK parameters over time. By subsequently correlating these parameter changes with the weigh gain, we were able to identify a suitable covariate model for the effect of the weight gain. This covariate model is given by the w(t) term in eq. 5, where w(t) is the relative weight gain defined as follows:
  Although the relatively large weight gain is considered by incorporating w(t) into the model, it also makes it more difficult to probe the physiological mechanisms behind the changes in the EPO concentrations.
Equation 2 is conveniently converted to the following equivalent equations (eqs. 6–7). These new equations are simpler to deal with computationally because they do not involve a convolution operation. Equations 6 and 7 are ordinary first-order differential equations that in contrast to the original equation (eq. 2) can be solved numerically by regular first-order differential equation software. 
 The above-mentioned “dummy” variable Z introduced in the conversion accounts for the distribution effect originally expressed by the convolution term in eq. 2. Equations 1, 4, 6, and 7 were used to estimate the PK parameters by curve fitting. A cross-validation cubic spline (Hutchinson and deHoog, 1985) fitted to the Hb data was used to represent nonparametrically the Hb concentration versus time profile [Hb(t)] in eqs. 1 and 3 in the fitting to the EPO data.
Data Analysis. The numerical solution of eqs. 1, 4, and 6, with components defined by eqs. 3 and 7, was fitted to the EPO data using the interactive WINFUNFIT, a Windows version of the general nonlinear regression program FUNFIT (Veng-Pedersen, 1977), written for the Windows (Microsoft) platform.
The pharmacokinetics analysis of EPO plasma concentration profile from a single intravenous 125I-rhEPO bolus dose was well described by a biexponential disposition function in agreement with our previous findings (Chapel et al., 2001; Veng-Pedersen et al., 2003). The clearances, including various PK parameters, were calculated from the biexponential disposition function using the computer program PERDIS (Veng-Pedersen and Gillespie, 1987).
EPO production rate was determined by deconvolution using the WinNonlin Professional software package (Pharsight, Mountain View, CA). The UIR used in the deconvolution was determined from the 125I-rhEPO PK studies done before the EPO plasma level drops to its baseline value. All statistical tests were done using SAS/STAT (SAS Institute, Cary, NC).
Results
Hemoglobin Recovery in Phlebotomized Sheep. The baseline preanemic plasma EPO concentration, reticulocyte count, and Hb were 15 ± 21 mU/ml, 0.3 ± 90%, and 10.9 ± 10.0 g/dl, respectively. Baseline EPO clearance was 48 ± 43 ml/h/kg and increased by a factor of less than 2.5 (Fig. 2). Phlebotomy-induced anemia to Hb < 4 g/dl resulted in an immediate, rapid increase in plasma EPO concentrations with mean peak concentration 836 ± 52 mU/ml at 1.5 to 3.7 days after the phlebotomy (Fig. 2). The phlebotomy-induced increase in plasma EPO is maintained only over a few days. A paradoxical rapid drop consistently starts as early as 2 to 4 days after the phlebotomy, in spite of a continued very low Hb at that time (4.3 ± 15 g/dl).
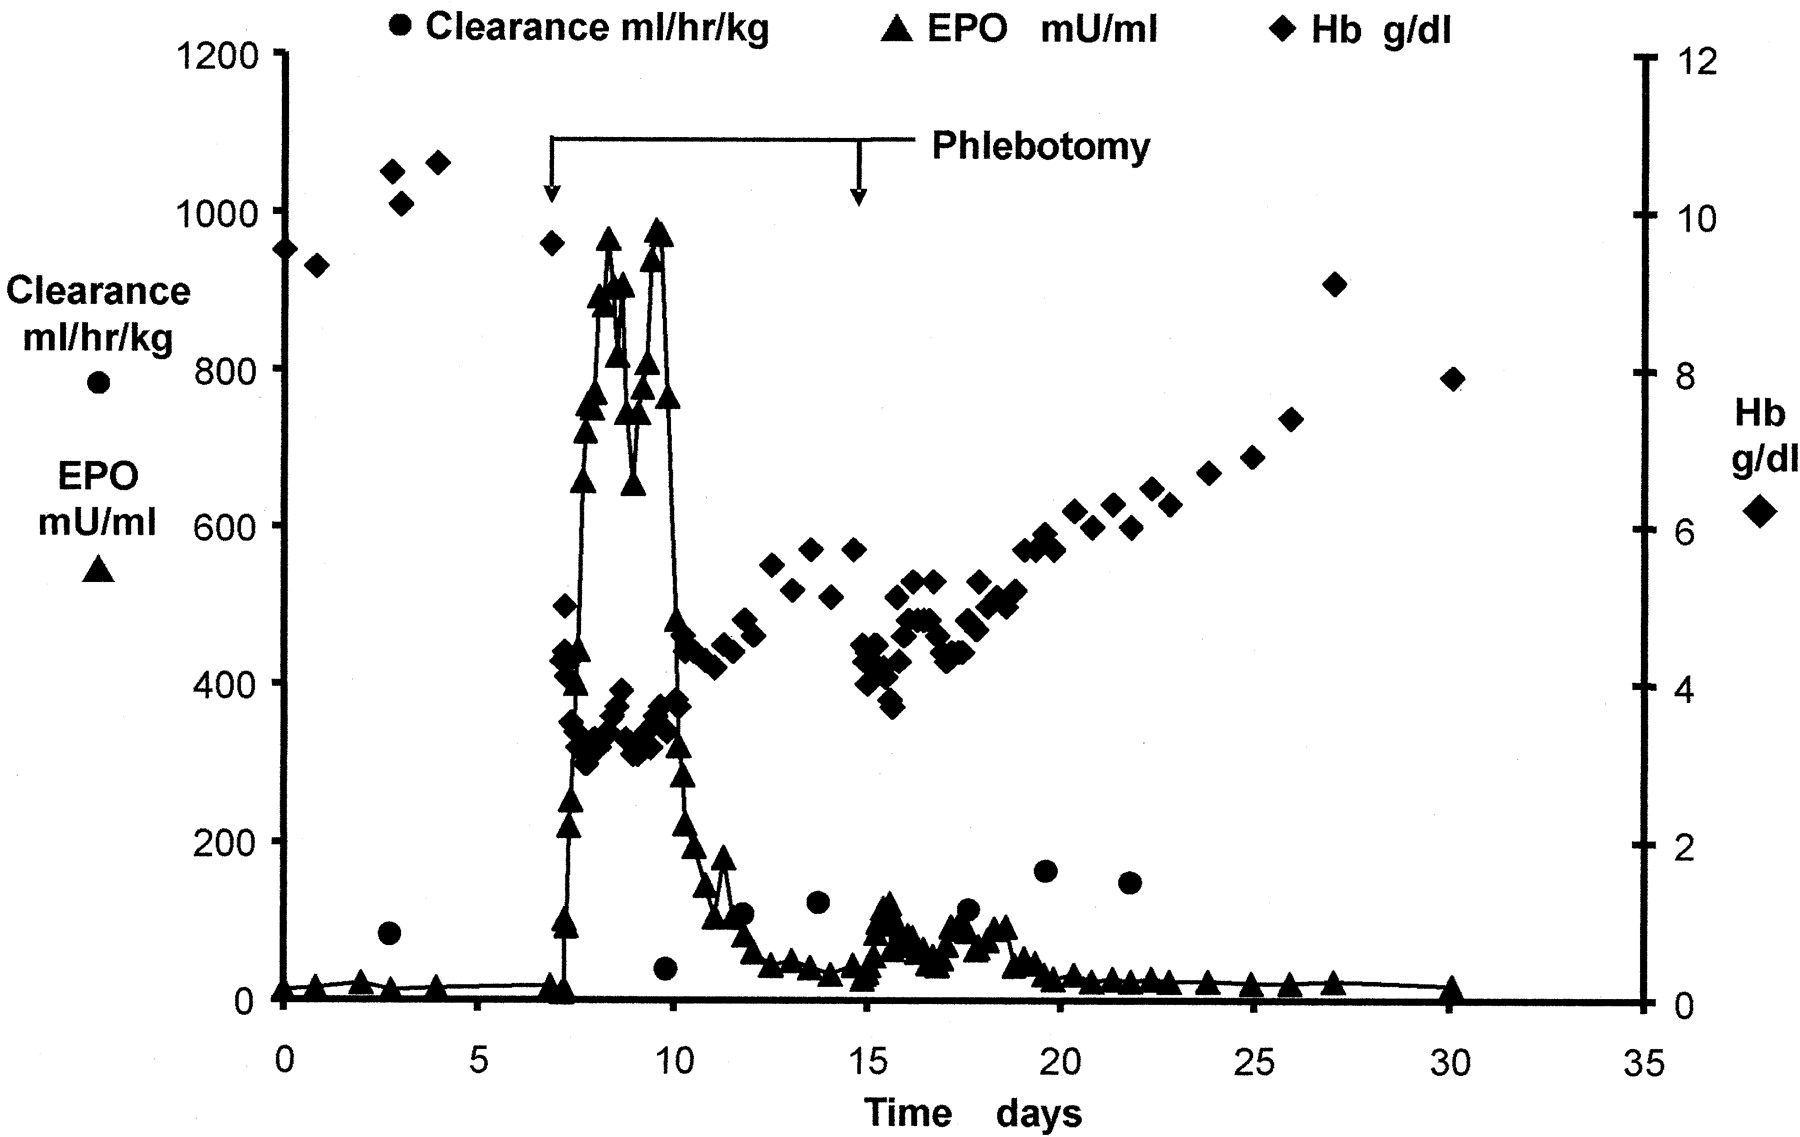
Changes in EPO and total hemoglobin resulting from a severe phlebotomy-induced anemia. The first phlebotomy was performed at day 0.
The time between the first and the second phlebotomies (8 days versus 4 weeks) affected EPO production rate. The transient EPO plasma level response is reproduced in the second phlebotomy done after a 4-week recovery period with no statistically significant difference between the first and second EPO plasma level responses in each animal (p < 0.05). On the other hand, the initial EPO production rate response to anemia is not reestablished by the second phlebotomy when the second phlebotomy is done close to the first phlebotomy, i.e., 8 days later (Fig. 2). In fact, even when the second phlebotomy in one animal was more severe (Hb brought down to 3 g/dl) than the first 8 days earlier (Hb brought down to 4 g/dl), the EPO production rate response from the second phlebotomy was less that that from the first phlebotomy. The maximum relative percentage of retic counts ranged between 5.5 and 13.7% at 2.5 to 5.1 days after the start of the phlebotomy. The onset of the increase in retics showed a delay with a lag time of 0.2 to 2.0 days relative to the commencement of phlebotomy. The elevated retic counts returned to baseline values within 10 to 15 days after the phlebotomy.
Hb production continues at constant rate for several days (for about 12 days in the second phlebotomy) in spite of the substantial drop in the plasma EPO level. No major change in the p50 was observed throughout the study (p > 0.05).
PK/PD Analysis. The fitted model (Fig. 1) showed good agreement with the observed data (r = 0.973 ± 1.57). Figure 3 provides representative plots of such fittings, and Table 1 summarizes the parameter estimates of the fitted PK/PD model. In Fig. 3, two examples of the curve fitting are shown, one with the two phlebotomies separated by 8 days (Fig. 3, column A) and the other with the two phlebotomies separated by 4 weeks (Fig. 3, column B). The primary parameters estimated directly in the fitting were K0, K1, K2, VM, KM, C50, K′, λ, φ, G, γ, EmaxR, C50R, KLoss, and θ (Table 1). The initial conditions of the variables mRNA, R, and Z are calculated from the estimated parameters as given by eqs. 1, 4, and 7, respectively, whereas the initial concentration of EPO for eq. 2 was fixed and equal to the average calculated from the prephlebotomy EPO concentrations. The KR and R50 parameters are not uniquely identifiable in contrast to their ratio KR/R50, which is instead reported as a parameter in Table 1. This nonuniqueness stems from the fact that substitution of R with R/R50 in eqs. 1 and 4, together with a substitution of KR with KR/R50 in eq. 4, will not change the solution to these equations. Similarly, it is evident from this that it is not possible to determine the magnitude of the R(t) curve, only the shape. Accordingly, the values used for the right axis in Fig. 4 are not to be interpreted in an absolute sense, but rather in a relative sense. The representative shape of R(t) estimated according to eq. 4 seen in Fig. 4 correlates well with the drop in the EPO data, illustrating the inhibitory effect of R in agreement with the model equations and Fig. 1. Table 1 presents the summary values for the (ΔHbMax/C50)λ/(1 + (ΔHbMax/C50)λ) ratio. According to eq. 1, this ratio is useful for assessing the maximum degree of saturation experienced in the oxygen sensor(s) stimulation of the mRNA up-regulation rate. Thus, a value close to 1 for this ratio represents a maximum possible ΔHb-based stimulation in the up-regulation rate of the mRNA that is proposed to be the determinant for the EPO production rate (Fig. 1).

Two representative plots of the model equations simultaneously fitted to EPO and hemoglobin data. The two controlled phlebotomies are separated by either 8 days (column A) or 4 weeks (column B).
Summary of PK/PD parameters estimated from fitting the model equations to the EPO data
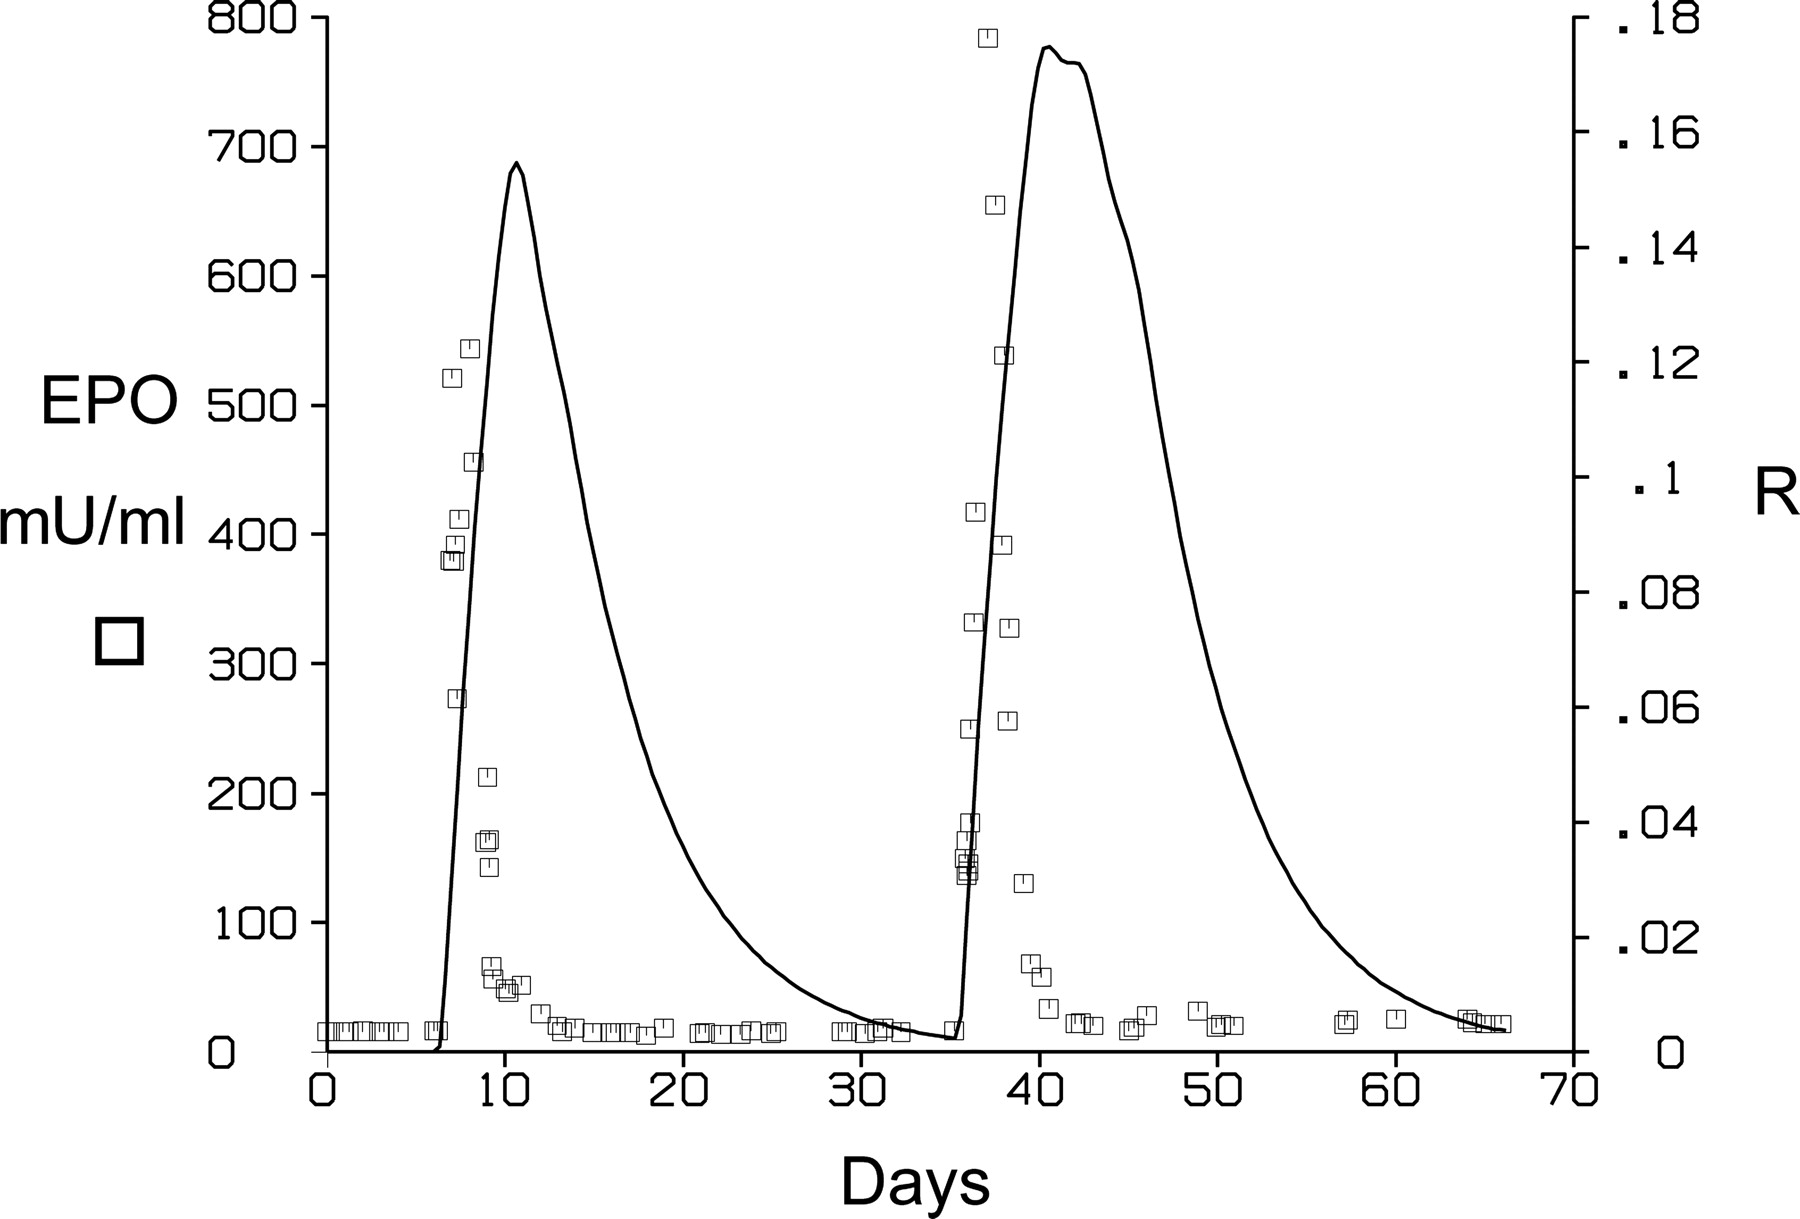
Changes in the endogenous factor R that modulates the formation rate of the mRNA required in the EPO production (Fig. 1). The EPO plasma level data from the double phlebotomy are included for reference.
An individual estimation of the C50 parameter could not be determined in one case (Table 1, sheep 3) because the following expression (eq. 7), which is a part of eq. 1, collapsed to an expression merging the K′ and the C50 parameters, thus not allowing C50 to be reliably determined (eq. 8): 
Discussion
EPO Regulation and PK/PD Modeling Rationale. In the kidneys, which are considered to be the dominant organ for EPO production in adults, EPO is produced in inverse relation to availability of oxygen relative to oxygen delivery requirements. When the level of oxygen in the renal oxygen sensor cell is reduced below normal physiological levels, increased renal production of EPO occurs (Bauer and Kurtz, 1989). Moreover, Because the rate of EPO production is increased under conditions of diminished oxygen supply such as anemia or hypoxia, it becomes evident that the primary determinant of EPO formation is the oxygen content of the blood (Bauer and Kurtz, 1989).
The major control mechanisms for EPO production seem to operate at the level of its mRNA (Bondurant and Koury, 1986). Renal EPO mRNA in mice increased within 1.5 h postanemia and reached a maximum value by 4 to 8 h (Bondurant and Koury, 1986). The maximum level of mRNA correlated with the severity of the anemia, indicating that the regulation of the EPO production occurs through its mRNA. Accordingly, the rise in plasma EPO in hypoxia results from mRNA formation controlling the EPO synthesis. The modulation of EPO mRNA level is in part mediated through changes in the transcription rate of the EPO gene. Several regulatory DNA sequences have been identified, in the vicinity of the EPO gene, which stimulate and suppress EPO gene activity (Beck et al., 1991; Maxwell et al., 1993; Eckardt, 1995; Gupta and Goldwasser, 1996). It has been suggested (Goldberg et al., 1991) that EPO mRNA levels are determined by both the rate of gene transcription and posttranscriptional events. Accordingly, we investigated this alternative mechanism through another PK/PD model where the rate of mRNA formation depends on nuclear factors that stabilize the mRNA. However, this alternative model was not statistically favored over the present model (Fig. 1) according to the Akaike criteria (Akaike, 1974).
The proposed PK/PD integro-differential model describes quantitatively the kinetic mechanism governing EPO's production and regulation. Once the level of oxygen falls below physiological level, the oxygen sensor will be activated. The effect of the oxygen sensor on EPO production is described mathematical by an empirical Hill function. The transcription rate of EPO gene and mRNA formation are proportionally related to the severity of anemia. Moreover, EPO mRNA level is also modulated by an inhibitory unknown endogenous factor (R) that down-regulates the EPO gene transcription and mRNA level.
Michaelis-Menten Parameters, Nonlinearity, and K1 Parameter. Several studies have reported nonlinearity in EPO's PK in which its plasma clearance decreases with increasing EPO doses (Veng-Pedersen et al., 1995, 1999; Kato et al., 1997, 1998; Yoon et al., 1997) consistent with a Michaelis-Menten type elimination kinetics. An increasing amount of evidence suggests that the metabolic fate of EPO is largely depending on EPO receptor (EPOR) carrying progenitor cells primarily located in the bone marrow that eliminate EPO through endocytosis of the EPOR-EPO complex followed by lysosomal degradation (Sawyer and Hankins, 1993). Ablation of the bone marrow changes the elimination kinetics from nonlinear (linear + nonlinear) to purely linear, which supports the hypothesis that the nonlinear elimination kinetics is due to elimination via the EPOR pool located in the bone marrow (Veng-Pedersen et al., 2003). The present model provides further evidence to that hypothesis and estimates the Michaelis-Menten parameters (Fig. 1, VM and KM) that describe the change in the EPOR pool as result of the changes in the EPO plasma level caused by the phlebotomy-induced anemia. It is well recognized that EPOR exist in many tissues other than bone marrow (Yasada et al., 1993; Yamaji et al., 1996; Juul et al., 1998, 2001; Nagai et al., 2001). The first-order elimination rate constant, K1, accounts for the linear elimination taking place outside the bone marrow (Veng-Pedersen et al., 2003). The role of these nonhematopoietic receptors is not well understood. Recent reports, however, have indicated that at least some of these receptors seem to have a neuroprotective role in protection from hypoxemic ischemia (Juul, 2002).
The mean value for the nonhematopoietic receptors, K1, estimated in this work was 0.176 ± 55.1 h-1 (Table 1), which is comparable and not statistically different (p = 0.21) to the estimate 0.128 ± 17.9 h-1 from our previous work in adult sheep (Veng-Pedersen et al., 2003).
Paradoxal Limited Sustained EPO Production. In all of our experiments, it was noticed that the initial high EPO production rate observed in response to a phlebotomy is only maintained over few days. A rapid drop consistently starts as early as 2 to 4 days after the phlebotomy, in spite of a continued very low Hb at that time (∼3.4–5.5 g/dl). The same phenomena have been observed in several animals, including humans (Reynafarje et al., 1964; Abbrecht and Littell, 1972; Miller and Howard, 1979). The EPO plasma level is affected by both by EPO production and elimination. We have determined that the EPO plasma clearance can increased by a factor of up to 2.5, resulting from the up-regulation of the EPOR pool. However, this increase is not large enough to explain the extent and rate of the drop in plasma EPO level consistently seen few days after the phlebotomy (Fig. 2). The 125I-rhEPO tracer PK studies confirmed, by a deconvolution analysis that corrects for a change in the clearance, that the rapid reduction in the EPO plasma level is explained by a reduction in the EPO production rate, rather than by an increase in the clearance of EPO. The EPO production rate (Fig. 5) obtained by deconvolution corresponds to a total production of about 400 U/kg over the first 1-week period, which is comparable with a clinical dosing of 450 U/kg (150 U/kg three times per week).

EPO production rate obtained by deconvolution using population UIR from tracer PK studies.
Several studies (Fried et al., 1980; Fried and Barone-Varelas, 1984; Eckardt et al., 1990) showed that the decline in the EPO production is not due to feedback inhibition from circulating plasma EPO, because the injection of large doses of the hormone in rats did not suppress the hypoxia-induced EPO production. Eckardt et al. (1990) showed in rats that the decline in EPO plasma level under severe hypoxia (7.5% O2) was paralleled by a marked reduction in renal EPO mRNA. They also claimed that the reduction in renal EPO mRNA was due to diminished capability for EPO production. However, they did not consider that the mRNA reduction was due to a negative feedback inhibition resulting from an enlarged erythroid cell mass or from other causes.
The possibility exists that adaptation to anemia may explain why the EPO production rate is not sustained and not reestablished in a second (closely spaced) phlebotomy. Physiological adaptation to hypoxia could create a diminished signal transduction for EPO mRNA in the kidney. A decrease in the oxygen affinity of Hb is one of the adaptation mechanisms that helps to compensate for anemia by facilitating the release of oxygen to the tissue. Accordingly, we measured the p50 at baseline and at the time when the largest rate of EPO drop occurred in the postphlebotomy phase. Surprisingly, no major change in the p50 was observed, indicating no significant adaptation via a change in the oxygen-Hb dissociation.
K′, C50, and the K′/C50 Ratio. The analysis makes use of the full Hill equation (a sigmoid EMax model) (eq. 7) for the PK/PD transduction function, which has shown great utility in many PK/PD analysis situations. The estimation of the Hill equation parameters becomes troublesome in cases with C50 values that are high relative to the concentration range used in the determination. This estimation problem was encountered in one case in this study (Table 1, subject 3), which required a fitting using a reduced two-parameter, rather than four-parameter, PK/PD transduction function (eq. 7). Thus, in this case the ratio K′/C50λ was estimated as a primary fitting parameter, rather than calculated from individually estimated K′ and C50 parameters as done in the other sheep. The reduced PK/PD transduction function seems to be caused by comparatively large C50 values in this case. The inability to reliably estimate K′ and C50 individually in this case was not a real problem, because the K′/C50 ratio can readily be determined.
In summary, this work has presented a PK/PD mechanistic analysis that provided an explanation for the paradoxal rapid drop of EPO seen 2 to 4 days after acute anemia. Various parameters have been presented enabling EPO's production to be kinetically quantified, providing a rational foundation for understating EPO physiology and regulation. The kinetic model, and the variety of parameters presented also offer an opportunity for an in-depth analysis of the erythropoiesis, useful for identifying and understanding how different factors, cytokines, and pathophysiologic conditions play a role in the erythropoiesis.
Acknowledgments
The recombinant human EPO used in the EPO RIA was a gift from Dr. H. Kinoshita (Chugai Pharmaceutical Company, Ltd., Tokyo, Japan). The rabbit EPO antiserum used in the EPO RIA was a generous gift from Gisela K. Clemens. We gratefully acknowledge the technical help from Lance S. Lowe and the personnel of the Iowa City Veterans Administration Medical Center Pathology and Laboratory Medicine Service for assistance (Barbara Stewart, Beth Greif, and Lisa Alberty) in performing the flow cytometric measurements of reticulocytes.
Footnotes
-
This work is supported by the United States Public Health Service National Institutes of Health Grants P01 HL46925 and R21 GM57367 and Grant RR000359 from the General Clinical Research Center Program, National Center for Research Resources, National Institutes of Health, and by the Veterans Administration Medical Center, Iowa City, IA.
-
DOI: 10.1124/jpet.104.066027.
-
ABBREVIATIONS: EPO, erythropoietin; Hb, hemoglobin; PK, pharmacokinetics; PD, pharmacodynamics; UIR, unit impulse response; rhEPO, recombinant human erythropoietin; RIA, radioimmunoassay; EPOR, EPO receptor.
- Received January 22, 2004.
- Accepted February 26, 2004.
- The American Society for Pharmacology and Experimental Therapeutics


