


Abstract
Human immunodeficiency virus (HIV) protease inhibitors (PIs) are inhibitors of CYP3A enzymes, but the mechanism is poorly defined. In this study, time- and concentration-dependent decreases in activity as defined by maximum rate of inactivation (kinact) and inhibitor concentration that gives 50% maximal inactivation (KI) of CYP3A by amprenavir, indinavir, lopinavir, nelfinavir, ritonavir, and saquinavir were quantified using testosterone 6β-hydroxylation as a marker for CYP3A activity with recombinant CYP3A4(+b5), recombinant CYP3A5, and pooled human liver microsomes (HLMs). All the PIs, except indinavir, displayed inactivation with CYP3A4(+b5) and HLMs. Ritonavir was the most potent (KI = 0.10 and 0.17 μM) and demonstrated high kinact values (0.32 and 0.40 min-1) with both CYP3A4(+b5) and HLMs. Ritonavir was not significantly depleted by high-affinity binding with CYP3A4(+b5) and confirmed that estimation of reversible inhibition was confounded with irreversible inhibition. For CYP3A5, nelfinavir exhibited the highest kinact (0.47 min-1), but ritonavir was the most potent (KI = 0.12 μM). Saquinavir and indinavir did not show time- and concentration-dependent decreases in activity with CYP3A5. Spectrophototmetrically determined metabolic intermediate complex formation was observed for all of the PIs with CYP3A4(+b5), except for lopinavir and saquinavir. The addition of nucleophilic and free aldehyde trapping agents and free iron and reactive oxygen species scavengers did not prevent inactivation of CYP3A4(+b5) by ritonavir, amprenavir, or nelfinavir, but glutathione decreased the inactivation by saquinavir (17%) and catalase decreased the inactivation by lopinavir (39%). In conclusion, all the PIs exhibited mechanism-based inactivation, and predictions of the extent and time course of drug interactions with PIs could be underestimated if based solely on reversible inhibition.
A major advance in the antiretroviral therapy has been the introduction of the HIV protease inhibitors. These HIV protease inhibitors, when administered in high doses and in combination with other antivirals, dramatically reduce HIV levels in the blood (Hammer et al., 2002). Highly active antiretroviral therapy (HAART) generally involves combination therapy and consists typically of three or four drugs for the treatment of disease (Yeni et al., 2002). Despite the effectiveness of HAART, HIV-infected individuals experience a broad array of comorbidities as a result of an impaired immune response and develop metabolic disturbances related to therapy and HIV infection (Fichtenbaum and Gerber, 2002). Consequently, pharmacokinetic interactions are common when HIV protease inhibitors are administered in combination with other AIDS-related therapeutic agents, such as hypolipidemics, macrolide antibiotics, calcium channel blockers, and hormones. For example, in healthy volunteers, simvastatin and atorvastatin exposure increased 3059 and 79%, respectively, after 15 days of combination ritonavir/saquinavir treatment (Fichtenbaum et al., 2002). In a group of HIV-positive men, the exposure of sildenafil increased approximately 4-, 11-, and 3-fold after multiple doses of indinavir (Merry et al., 1999), ritonavir (Muirhead et al., 2000), and saquinavir (Muirhead et al., 2000), respectively. In addition, standard HAART uses intentional drug interactions whereby ritonavir is used to boost concentrations of lopinavir, indinavir, saquinavir, and amprenavir (Yeni et al., 2002). This pharmacoenhancement reflects the fact that the currently available HIV protease inhibitors are both substrates and inhibitors of CYP3A and thus compete for the same metabolic enzyme at both hepatic and intestinal sites (Singh et al., 1996; Eagling et al., 1997; Lillibridge et al., 1998; Kumar et al., 1999). Despite the fact that these HIV protease inhibitors demonstrate highly potent competitive inhibition, predictions of in vivo drug-drug interactions are sometimes underestimated using in vitro Ki values, and the inhibitory effect can persist after discontinuation and protease inhibitor concentrations are below detectable levels (Washington et al., 2003).
These observations suggest that additional mechanisms of inhibition may occur in vivo other than competitive inhibition. Using spectrophotometry, Lin et al. (1995) demonstrated that an analog of indinavir converted approximately 40 to 60% of the cytochrome P450 in human liver microsomes to a metabolic intermediate complex. Thus, HIV protease inhibitors have the potential to inactivate CYP3A enzymes by the formation of a metabolic intermediate complex (MIC). Compounds that inactivate P450 via mechanism-based inactivation are typically substrates for the target enzyme and are converted to an intermediate that inactivates the enzyme, thus removing the enzyme from the pool of P450 (Silverman, 1995). Mechanism-based inactivation is distinguished from reversible inhibition in that decreased enzyme activity persists after the compound has been cleared from the body (Kanamitsu et al., 2000).
This report quantifies the capabilities of several HIV protease inhibitors to act as mechanism-based inactivators at clinically relevant steady-state concentrations through the formation of a metabolic intermediate complex.
Materials and Methods
Chemicals. Amprenavir, ritonavir, nelfinavir mesylate, saquinavir, lopinavir, and indinavir were donated by GlaxoSmithKline (Research Triangle Park, NC), Abbott Laboratories (Chicago, IL), Agouron Pharmaceuticals, Inc. (New York, NY), F. Hoffmann-La Roche (Nutley, NJ), Abbott Laboratories (Chicago, IL), and Merck (White-house Station, NJ), respectively. Testosterone, 6β-hydroxytestosterone, temazepam, catalase, glutathione, deferoxamine, N-acetylcysteine, superoxide dismutase, methoxylamine, and semicarbazide were purchased from Sigma-Aldrich (St. Louis, MO). NADPH was purchased from Roche Diagnostics (Indianapolis, IN). All other reagents were of high-performance liquid chromatography (HPLC) grade.
cDNA-Expressed Human CYP3A4(+b5), CYP3A5, and Human Liver Microsomes (HLMs). Insect cell microsomes containing baculovirus cDNA-expressed CYP3A4(+b5) and CYP3A5 were purchased from BD Gentest (Woburn, MA). Pooled adult HLMs were prepared from five human liver tissues obtained at surgery in accordance with protocols approved by the Institutional Review Board of Indiana University-Purdue University Indianapolis/Clarian (Indianapolis, IN). The handling, preparation, and storage of microsomes have been described previously (Gorski et al., 1994). The total protein concentration of the pooled HLMs was 20 mg/ml and cytochrome P450 concentration was 0.3 nmol/mg protein (Lowery et al., 1951; Omura and Sato, 1964).
Enzyme Inactivation and High-Affinity Binding. Testosterone 6β-hydroxylase activity was determined to quantify time- and concentration-dependent loss of CYP3A activity of microsomes in the presence of protease inhibitors. HIV protease inhibitors in methanol were added to sample tubes and evaporated to dryness before addition of HLMs (50 μg of total protein), CYP3A4(+b5) (20 pmol), or CYP3A5 (50 pmol). Microsomal buffer (100 mM phosphate buffer containing 5 mM MgCl2, pH 7.4) was added to bring the total volume to 45 μl. After equilibration at 37°C for 1 min, inactivation was initiated by the addition of 5 μl of NADPH (10 mM). At the end of the preincubation period, 950 μl of a mixture that consisted of microsomal buffer, testosterone (final concentration 200 μM), and NADPH (final concentration 10 mM) was added to the sample tubes. After a 2-min incubation at 37°C, testosterone metabolism was terminated by the addition of 1 ml of ice-cold acetonitrile. Temazepam (800 ng) was then added to each test tube as an internal standard, and each tube was centrifuged at 2500 rpm for 5 min. The supernatant was removed, placed in a screw cap glass tube, combined with 6 ml of ethyl acetate, and mixed for 30 min. After mixing, each tube was centrifuged at 2500 rpm for 5 min, and the organic phase was removed, placed in a glass culture tube, and evaporated to dryness. The residues were resuspended in 150 μl of the HPLC mobile phase [20 mM phosphate buffer containing 0.1% (v/v) triethylamine adjusted to pH 6.3 with orthophosphoric acid/MeOH [40:60 (v/v)]]. The concentration of 6β-hydroxytestosterone for duplicate samples was determined by HPLC using a 5-μm C18 column (Luna; Phenomenex, Torrace, CA) that was eluted at a flow rate of 1 ml/min and ultraviolet detection at a wavelength of 254 nm, as described previously (Zhao et al., 2002).
To test for depletion of unbound inhibitor by high-affinity binding to CYP3A4(+b5), testosterone (final concentration 200 μM) and ritonavir (0.05, 0.10, 0.20, 0.50, and 1 μM) in methanol were added to sample tubes and evaporated to dryness. CYP3A4(+b5) (10, 20, 50, 100, and 200 pmol) and microsomal buffer were added to bring the total volume to 900 μl. After equilibration at 37°C for 1 min, 100 μl of a 10 mM NADPH solution was added to initiate metabolism. After a 2-min incubation at 37°C, the testosterone metabolism was terminated by the addition of 1 ml of ice-cold acetonitrile. The addition of internal standard and extraction of 6β-hydroxytestosterone were performed as described above. The organic solvents were evaporated to dryness, and residues were resuspended in 150 μl of the HPLC mobile phase [phosphate buffer (pH 6.3)/MeOH (40:60)], and 6β-hydroxytestosterone formation was determined for duplicate samples as described above.
MIC Formation. HLM, CYP3A4(+b5), or CYP3A5 was used to characterize MIC formation associated with the metabolism of the protease inhibitors. MIC formation was observed with dual-beam spectroscopy (Uvikon 933 double-beam UV/VIS spectrophotometer; Research Instruments International, San Diego, CA) by scanning from 380 to 500 nm at 0, 5, 10, 15, 20, 25, 30, 40, 50, and 60 min to monitor the formation of an absorbance maximum at ∼455 nm. Each cuvette contained 1 mg of total protein of HLMs, 200 pmol of CYP3A4(+b5), or 500 pmol of CYP3A5 and 1 mM NADPH. The test sample cuvette contained 10 μM protease inhibitor in vehicle, and the reference cuvette contained vehicle without protease inhibitor. Quantities of protein were chosen to allow detection of MIC formation. All MIC formation experiments were maintained at 37°C with a final volume of 1 ml for each cuvette. The extent of MIC formation was quantified based on a previously reported extinction coefficient (455–490 nm) value of 65 M-1 (Pershing and Franklin, 1982).
Effects of Nucleophilic and Free Aldehyde Trapping Agents, Free Iron, and Reactive Oxygen Species Scavengers. The effects of nucleophilic and free aldehyde trapping agents, free iron, and reactive oxygen species scavengers on the inactivation of CYP3A4(+b5) were determined as described previously (Koenigs et al., 1997). These effects were examined by coincubation of amprenavir (2 μM), ritonavir (0.50 μM), nelfinavir (30 μM), saquinavir (5 μM), or lopinavir (30 μM) in the presence of NADPH, and nucleophilic and free aldehyde trapping agents, free iron, and reactive oxygen species scavengers with CYP3A4(+b5), in the preincubation step as described above. The concentration of each protease inhibitor and preincubation time with CYP3A4(+b5) and NADPH was chosen to produce the maximum inactivation that followed pseudo first-order kinetics as obtained from the enzyme inactivation experiments. Activities in the presence of HIV protease inhibitors and nucleophilic and free aldehyde trapping agents, free iron, and reactive oxygen species scavengers were expressed as percentage of control activity (HIV protease inhibitors alone).
Analysis of Enzyme Inactivation Kinetics. Kinetic parameters for enzyme inactivation were obtained by nonlinear regression without weighting using WinNonlin Professional, version 3.1 (Pharsight, Mountain View, CA). Appropriateness of fit was determined by visual inspection of the lines of best fit and precision of the parameter estimates. Mechanism-based inactivation parameters were obtained from the pseudo first-order decline in the percentage of remaining CYP3A activity after preincubation with protease inhibitors. Preliminary experiments determined inhibitor concentrations and preincubation times that followed pseudo first-order kinetics by plotting the natural logarithm of the percentage of the remaining CYP3A activity for each concentration of protease inhibitor against the preincubation time. Only data that were determined to follow pseudo first-order kinetics, as assessed by a linear decline in activity over time relative to initial enzyme activity, were used. For each inhibitor concentration, the percentage of remaining testosterone 6β-hydroxylase activity versus preincubation time was fit to estimate the observed inactivation rate constant (kobs), using the following equation:  Before addition of inhibitor, percentage of activity of enzyme is 100%, and kobs is related to the inhibitor concentration (I) during the preincubation according to the following relationship:
  where kinact is the maximal inactivation rate constant, KI is the inhibitor concentration at 50% of kinact. Equations 1 and 2 assume that loss of enzyme is solely due to inactivation by the inhibitor, and there is negligible change in I during the incubation period. The mechanism-based inactivation constants kinact and KI were estimated by simultaneously fitting the time-dependent loss of testosterone 6β-hydoxylase activity at all inhibitor concentrations for a given protease inhibitor, substituting kobs in eq. 1 for (kinact × I)/(KI + I) from eq. 2. Preliminary experiments identified inhibitor concentrations that resulted in less than ∼60% of control initial activity. This range of inhibitor concentrations allowed the inactivation rate constants to be accurately estimated despite possible substantial reversible inhibition by some HIV protease inhibitors (ritonavir and indinavir). There were at least three preincubation time points used at a given inhibitor concentration, and the appropriate range of preincubation times were determined from preliminary experiments.
Kinetics for High-Affinity Binding. To address the potential for depletion of unbound inhibitor during preincubations due to high-affinity binding, the effect of P450 concentration on the ritonavir concentration-dependent inhibition of CYP3A was evaluated with CYP3A4(+b5) graphically and by linear regression. If unbound inhibitor was not depleted then the potency of ritonavir as a reversible inhibitor would be independent of protein concentration. The percentage of inhibition was determined as [(1 - vi/vo) × 100], where vi is the velocity of 6β-hydroxytestosterone formation in the presence of inhibitor and vo is the velocity of 6β-hydroxytestosterone formation in the absence of inhibitor. Multiple linear regression analysis using S-PLUS 2000 (Insightful, Seattle, WA) was performed to assess the significance (p < 0.05) of CYP3A4(+b5) concentration on the ritonavir concentration dependent inhibition of 6β-hydroxytestosterone formation, as described previously using log-transformed data (Gibbs et al., 1999). The bound fraction of inhibitor (fb) forming an enzyme-inhibitor complex [EI] was determined as follows: 
 where Et is the total enzyme concentration, and It is the total inhibitor concentration. The apparent equilibrium inhibition constant for reversible inhibition (Ki) of ritonavir was estimated by simultaneously fitting the inhibition data from 10 and 20 pmol of CYP3A4(+b5) in the presence of ritonavir to the following noncompetitive inhibition model (Segel, 1975):
  where I is the concentration of unbound inhibitor estimated from the difference of It and [EI], and E is the unbound concentration of enzyme estimated from the difference of Et and [EI].
Quantitative Predictions of Drug Interactions in Vivo Based on Mechanism-Based Inactivation. Administration of a mechanism-based inactivator reduces the amount of enzyme available to metabolize a coadministered drug that relies on that enzyme for elimination. Thus, predictions of the extent of drug-drug interactions become important in assessing the combined administration of these two drugs. The theoretical background on the prediction of in vivo CYP3A inhibition using mechanism-based inactivation has been described previously (Mayhew et al., 2000; Wang et al., 2004).
Wang et al. (2004) have demonstrated that the extent of a drug-drug interaction can be described by the ratio of oral drug exposure in the inactivated state (AUC′po) over drug exposure in the absence of inhibitor (AUCpo). Assuming the unbound fraction of substrate is not altered in the presence of inhibitor, the extent of interaction can be predicted as follows based on hepatic intrinsic clearance and intestinal wall availability:  where KI is the concentration at 50% of kinact, Iu is the unbound, steady-state inhibitor concentration, fm represents the fraction of the total hepatic elimination that is due to the CYP3A pathway in the absence of inhibitor, FG is the intestinal wall bioavailability in the absence of inhibitor, F′G is the intestinal wall bioavailability in the presence of inhibitor, and kdeg is the endogenous degradation rate constant of the enzyme. After multiple doses of a HIV protease inhibitor, it was assumed that maximal inhibition of intestinal wall CYP3A occurred resulting in complete bioavailability (F′G = 1), and kdeg was assigned values of 0.00128 and 0.00026 min-1 based on rat CYP3A and human CYP3A4 in CaCO-2 cells (Correia, 1991; Malhotra et al., 2001).
Results
Enzyme Inactivation. Coincubation of a protease inhibitor (amprenavir, lopinavir, nelfinavir, or saquinavir) and testosterone for 2 min in the presence of NADPH with HLM, CYP3A4(+b5), or CYP3A5 did not demonstrate any appreciable inhibition of initial activity for the concentrations used to estimate the inactivation rate constants. However, significant loss of initial activity (∼60%) due to inhibition of CYP3A activity with HLM, CYP3A4(+b5), and CYP3A5 was observed in the presence of ritonavir or indinavir at relatively low concentrations (Fig. 1). In the coincubation of ritonavir, the IC50 (concentration that produces 50% inhibition) was approximately 0.05 μM for all tissues (Fig. 1). In the coincubation of indinavir (Fig. 1), the IC50, ∼1 μM with HLM and CYP3A5, was relatively close to the reported KI values that range from 0.2 to 0.9 μM (Unadkat and Wang, 2000), and the IC50 with CYP3A4(+b5) was slightly higher (∼1.5 μM). Therefore, concentrations of ritonavir and indinavir, which upon a 20-fold dilution maintained at least 60% initial activity relative to control before preincubation, were used to estimate the inactivation rate constants.
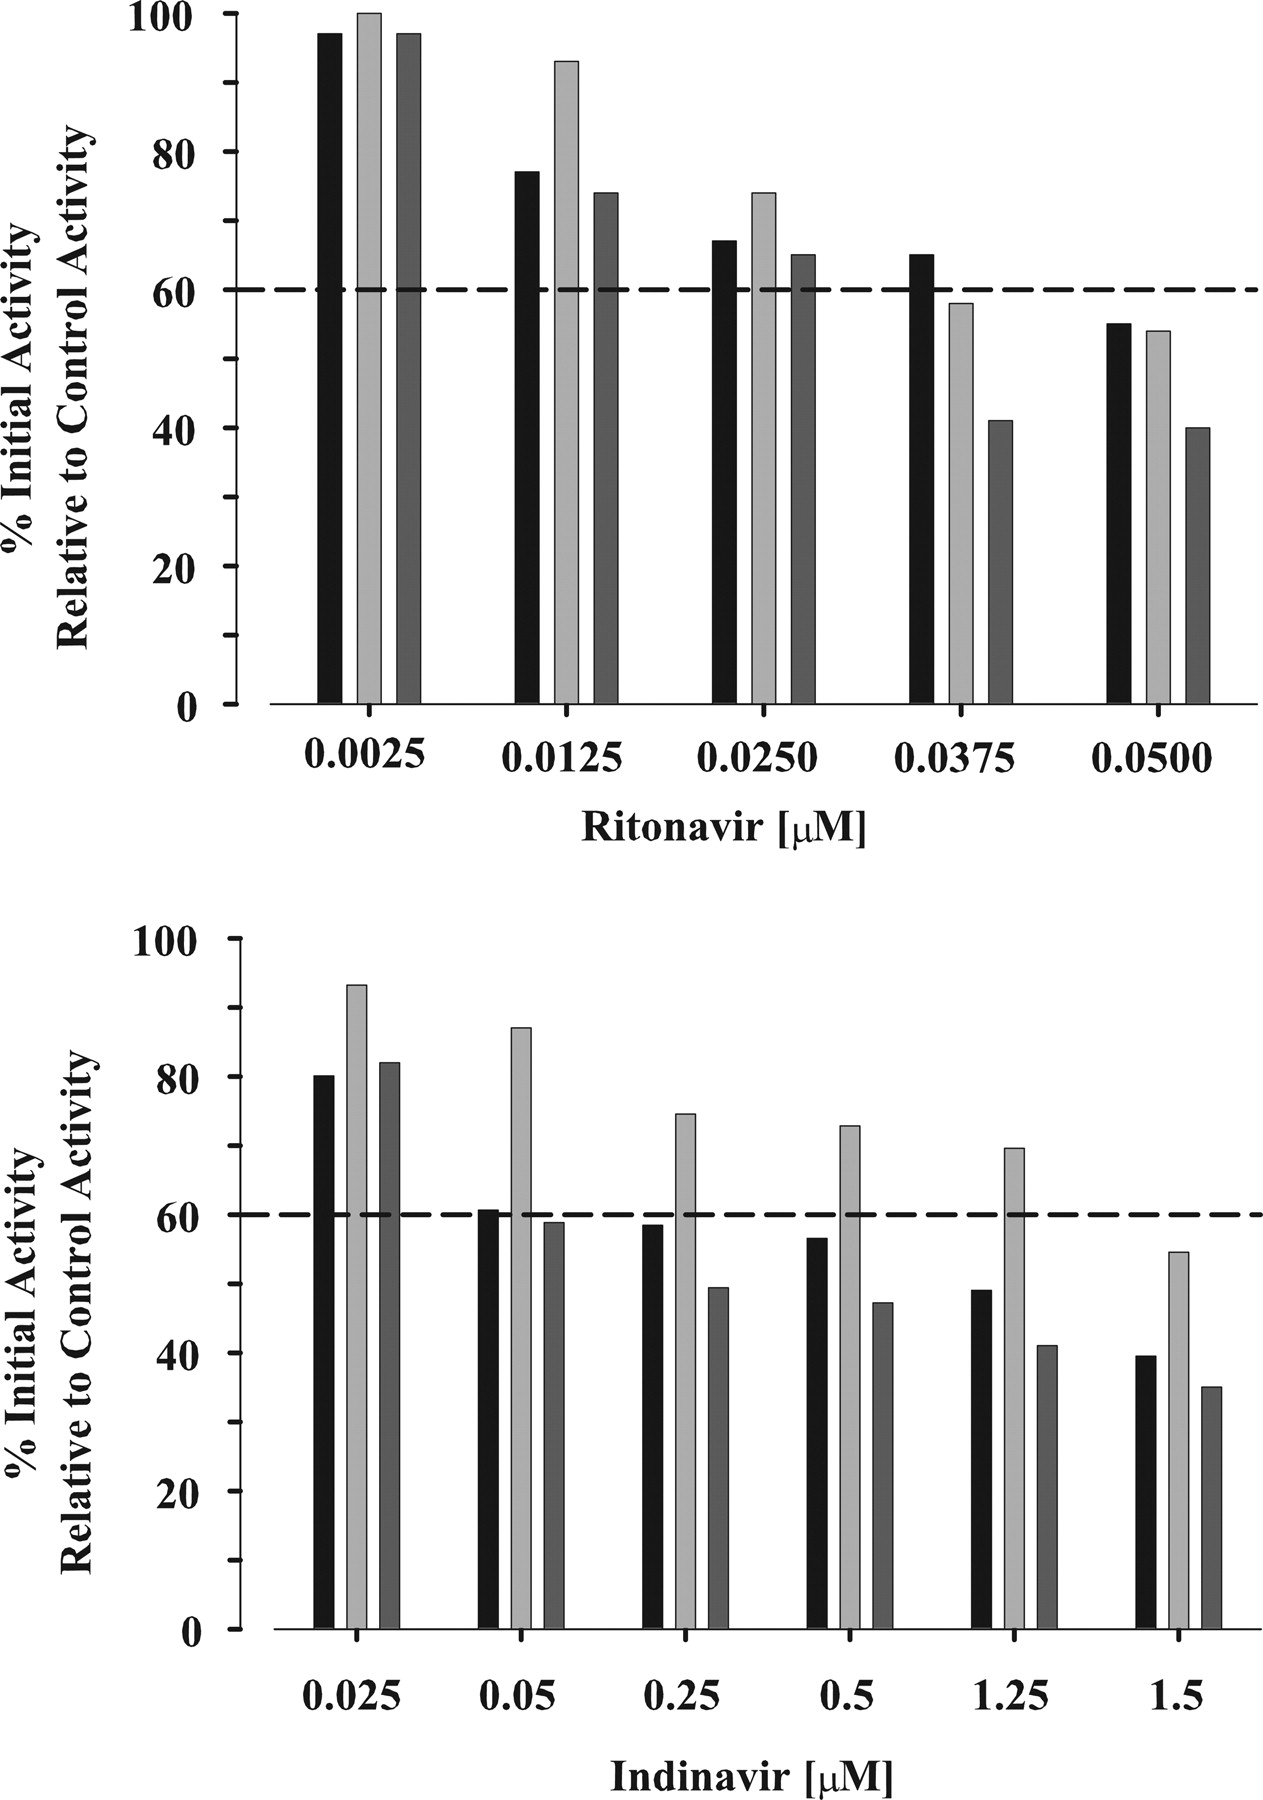
Percentage of control CYP3A activity in the presence of ritonavir or indinavir with HLM (black column), CYP3A4(+b5) (light gray column), and CYP3A5 (dark gray column). Initial testosterone 6β-hydroxylase activity without preincubation (time 0) in the presence of inhibitors (ritonavir or indinavir) was determined and expressed as a percentage relative to control activity (absence of inhibitor). Each column shown represents the mean from duplicate samples.
The loss of CYP3A activity as a function of protease inhibitor concentration and time was determined with HLM, CYP3A4(+b5), and CYP3A5. The initial concentration of the HIV protease inhibitors ranged from 0.03 to 50 μM and preincubation times ranged from 0 to 10 min. The rates of inactivation showed a clear dependence on inactivator concentration and preincubation time. Figure 2, A to C, illustrate the decline in percentage of remaining of testosterone 6β-hydroxylase activity versus preincubation time with HLM, CYP3A4(+b5), and CYP3A5 in the presence of ritonavir. In addition, the expected hyperbolic relationship between kobs values and ritonavir concentration is presented in Fig. 2, D to F, along with the line of best fit from the simultaneous fitting of all data to eqs. 1 and 2. Relatively low concentrations of ritonavir were required to produce the maximal rate of inactivation. Similar decreases in percentage of remaining testosterone 6β-hydroxylase activity versus preincubation time and hyperbolic relationships between kobs values and protease inhibitor concentration were observed for amprenavir, lopinavir, and nelfinavir with HLM, CYP3A4(+b5), and CYP3A5. Saquinavir demonstrated time- and concentration-dependent loss of activity with HLM and CYP3A4(+b5) but not with CYP3A5. The corresponding estimates of kinact and KI are presented in Table 1. For indinavir, the rate of 6β-hydroxytestosterone formation by HLM, CYP3A4(+b5), and CYP3A5 without prior exposure to indinavir, i.e., no preincubation, at concentrations greater than 0.05, 1.25, and 0.05 μM, respectively, was reduced by at least 60% of initial activity (Fig. 1). In addition, at indinavir concentrations that maintain at least 60% of initial activity, concentration- and time-dependent loss of 6β-hydroxytestosterone formation with HLM, CYP3A4(+b5), and CYP3A5 was not observed. Thus, indinavir was a potent reversible inhibitor and due to the limitations of the experimental conditions, the estimation of kinact and KI for indinavir was precluded.
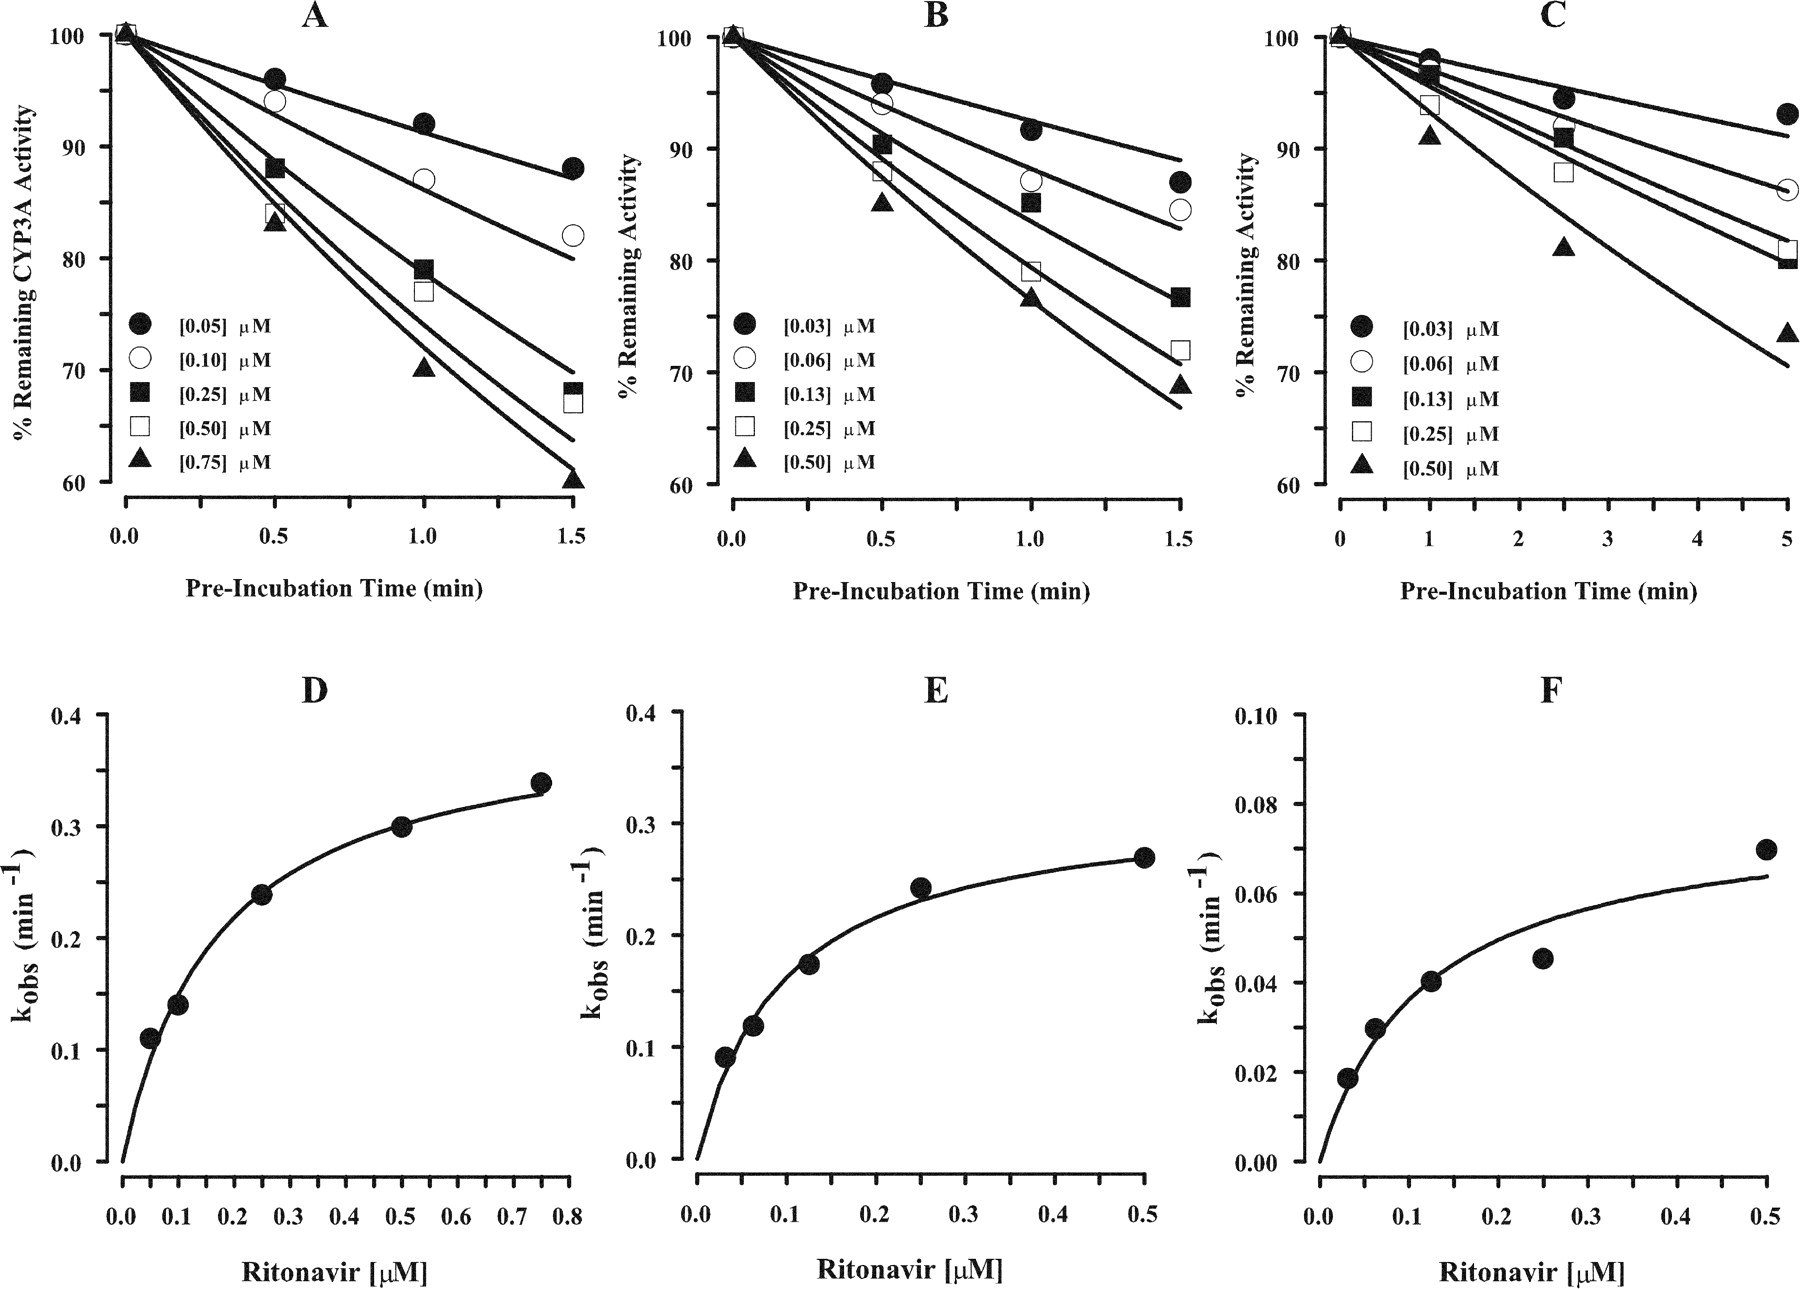
Time- and concentration-dependent inhibition of CYP3A activity by ritonavir with HLM (A), CYP3A4(+b5) (B), and CYP3A5 (C) and hyperbolic plots of kobs versus ritonavir concentration with HLM (D), CYP3A4(+b5) (E), and CYP3A5 (F). A to C, remaining testosterone 6β-hydroxylase activity in the presence of ritonavir concentrations determined and expressed as a percentage relative to control activity. The solid line represents the predicted percentage of remaining activity versus time of preincubation for each ritonavir concentration from the simultaneous fit of all data. Each point represents the mean of duplicate samples. D to F, kobs (•) value for the percentage of remaining testosterone 6β-hydroxylase activity, expressed as a percentage of relative to control activity, for each ritonavir concentration estimated using eq. 1 and plotted against inhibitor concentration. Each point represents the mean of duplicate samples. The solid line represents the predicted kobs values using the estimates of the parameters from the simultaneous fits (eq. 2).
Kinetic Parameters (% coefficient of variation) for enzyme inactivation
Among the HIV protease inhibitors examined in the current study, ritonavir was the most potent (lowest KI) and most efficient inactivator (highest kinact/KI) with HLM, although efficient inactivation was also exhibited by amprenavir, saquinavir, nelfinavir, and lopinavir (Table 1). A similar pattern of inactivation was observed with CYP3A4(+b5) (Table 1), and there was a high correlation between inactivation efficiency values obtained from HLMs and CYP3A4(+b5) (r2 = 0.94; Fig. 3). On average, the inactivation efficiency of HLMs was approximately 60% of that observed with CYP3A4(+b5). Compared with CYP3A4(+b5), there was less efficient inactivation of CYP3A5 by ritonavir, amprenavir, and lopinavir but more efficient inactivation by nelfinavir (Table 1). No correlation between CYP3A5 and HLM or CYP3A4(+b5) was observed.

Correlation of kinact/KI between HLM and CYP3A4(+b5). Ratios of kinact/KI obtained with HLM and CYP3A4(+b5) were plotted for ritonavir (•), amprenavir (○), saquinavir (▪), nelfinavir (□), and lopinavir (▴). Linear regression for the correlation of ratios between HLM and CYP3A4(+b5) was kinact/KI with HLM = 0.59 × kinact/KI with CYP3A4(+b5).
MIC Formation. Spectrophotometric peak absorbance difference at ∼455 nm was examined to identify MIC formation of HIV protease inhibitors with HLM, CYP3A4(+b5), or CYP3A5 and NADPH. The observed MIC formation with CYP3A4(+b5) at 10 μM protease inhibitor increased with time and was close to 95% of the total CYP3A in the sample for amprenavir followed by ritonavir (∼62%), nelfinavir (∼49%), and indinavir (∼47%) after 60 min of incubation. Because the concentration of HIV protease inhibitors were ∼20-fold higher than the KI values obtained during the inactivation experiments, the percentage of MIC formation relative to total CYP3A in the sample correlated closely with the kinact values for amprenavir, ritonavir, and nelfinavir. Thus, amprenavir demonstrated the highest kinact value and the highest percentage of MIC formation. MIC formation with CYP3A5 was only detectable with amprenavir, accounting for ∼23% of the total CYP3A in the sample. The HIV protease inhibitors did not form detectable MIC with HLM, which may be due to low CYP3A content or limit of detection for MIC. The limit of quantification of MIC formation is 23 pmol of enzyme using a 1-ml incubation volume with a 1-cm cuvette. This value corresponds to an absorbance difference of 0.0015 using an extinction coefficient of 65 M-1. The time courses of MIC formation for amprenavir and indinavir with CYP3A4(+b5) are illustrated in Fig. 4. In the absence of NADPH, no characteristic peak at ∼455 nm was observed. These results indicate that for several HIV protease inhibitors inactivation occurred through MIC formation. In addition, these results demonstrate that potent reversible inhibitors such as indinavir may form MIC at concentrations much higher than reported Ki values, even though concentration- and time-dependent experiments could not detect mechanism-based inactivation.

MIC Formation by amprenavir (A) and indinavir (B) with CYP3A4(+b5). The sample cuvette contained CYP3A4(+b5), protease inhibitor in methanol, and NADPH, whereas the reference cuvette contained CYP3A4(+b5), methanol, and NADPH, as described under Materials and Methods. MIC formation with CYP3A4(+b5) was detected spectrophotometrically from the absorbance difference for the incubates with and without inhibitor at wavelengths between 400 and 500 nm. Absorbance was monitored 0, 5, 10, 15, 20, 25, 30, 40, 50, and 60 min. The solid lines represent the smoothed fit of the absorbance from 420 to 495 nm. For the purpose of clarity, only the 5-min and 60-min lines are indicated. The peak absorbance difference was observed at ∼455 nm.
Effect of Nucleophilic and Free Aldehyde Trapping Agents, Free Iron, and Reactive Oxygen Species Scavengers. Agents were tested to determine whether inactivation by HIV protease inhibitors was confined to the active site of the enzyme or through liberation of a reactive metabolite. In assessing the impact of nucleophilic and free aldehyde trapping agents, free iron, and reactive oxygen species scavengers on the capacity to inhibit the ability of HIV protease inhibitors to inactivate CYP3A4(+b5), the concentrations of amprenavir, ritonavir, nelfinavir, saquinavir, and lopinavir were chosen from the previous experiments so the maximum inactivation that followed pseudo first-order kinetics was attained. Nucleophilic and free aldehyde trapping agents, free iron, and reactive oxygen species scavengers failed to protect inactivation (defined as less than a 10% change) of CYP3A4(+b5) by ritonavir, nelfinavir, and amprenavir. Saquinavir inactivation of CYP3A4(+b5) decreased by 17% with the addition of glutathione, and lopinavir inactivation of CYP3A4(+b5) decreased by 39% with the addition of catalase in the preincubation mixture.
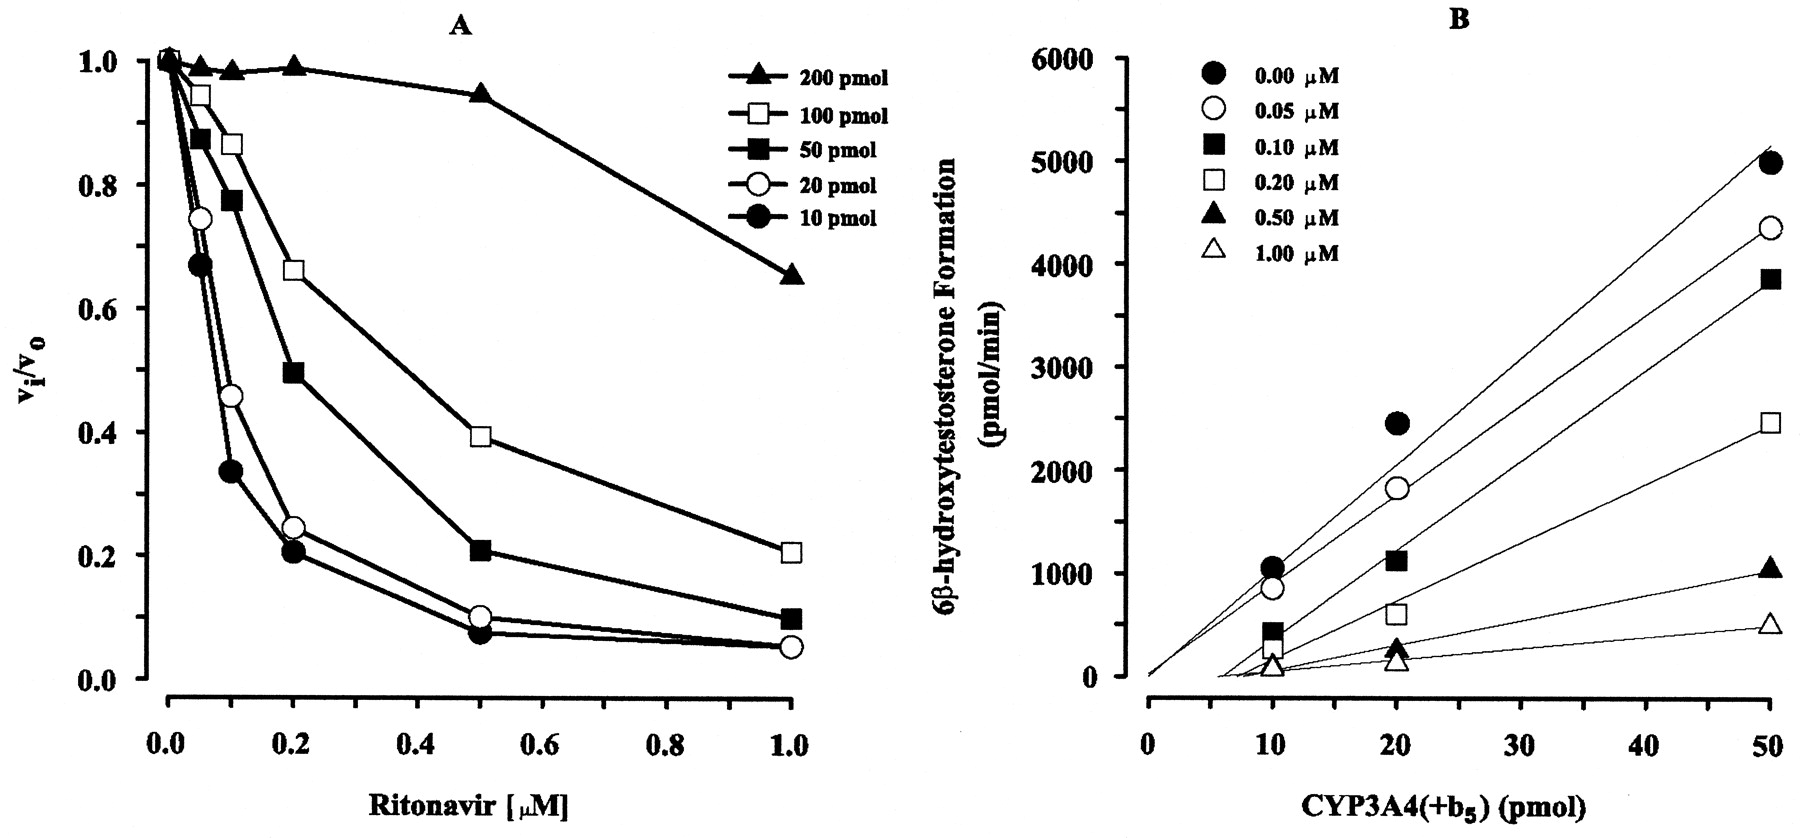
High-Affinity Binding. Ritonavir was characterized by a low IC50 value (∼0.05 μM, vide supra); therefore, the potential for high-affinity binding of ritonavir to CYP3A4(+b5), as this would bias estimates of KI, was investigated. The inhibition of 6β-hydroxytestosterone formation increased with increasing concentrations of ritonavir, and the inhibitory effect, as defined by (vi/vo), decreased with increasing concentrations of CYP3A4(+b5) (Fig. 5A). In the absence of ritonavir, the formation of 6β-hydroxytestosterone was approximately linear from 10 to 50 pmol of CYP3A4(+b5) (Fig. 5B), whereas above 50 pmol of enzyme, the formation of 6β-hydroxytestosterone was nonlinear, which suggests a metabolic depletion of testosterone (data not shown).

vi/vo versus ritonavir concentration (A) and velocity of 6β-hydroxytestosterone formation versus CYP3A4(+b5) (B). A, ratio of vi/vo after a 2-min coincubation of ritonavir and testosterone with CYP3A4(+b5) (picomoles) plotted against ritonavir concentration. The 2-min coincubation was terminated by the addition of 1 ml of ice-cold acetonitrile as described under Materials and Methods. Each point shown represents the mean from duplicate samples. B, velocity of 6β-hydroxytestosterone formation after a 2-min coincubation of ritonavir and testosterone plotted against CYP3A4(+b5) (10–50 pmol). The 2-min coincubation was terminated by the addition of 1 ml of ice-cold acetonitrile as described under Materials and Methods. Each point shown represents the mean from duplicate samples. Linear regression (—) for each ritonavir concentration (micromolar) between 6β-hydroxytestosterone formation and CYP3A4(+b5) was performed.
Multiple linear regression of the ritonavir concentration-dependent inhibition of 6β-hydroxytestosterone formation indicated that amounts of 50 to 200 pmol CYP3A4(+b5) were significant determinants of inhibition (p < 0.05). In contrast, enzyme amounts of 10 and 20 pmol of CYP3A4(+b5) were not significant determinants of inhibition (p < 0.70). Thus, inhibition of 6β-hydroxytestosterone formation by ritonavir with 10 to 20 pmol of CYP3A4(+b5) was not appreciably influenced by P450 concentrations and the calculation of high-affinity binding of ritonavir could be assessed for 20 pmol of CYP3A4(+b5) with minimal nonspecific binding. The impact of the fraction of ritonavir bound [i.e., ∼7% with 20 pmol CYP3A4(+b5)] did not significantly affect the KI value obtained for the mechanism-based inactivation experiments and thus did not violate the assumption that unbound inhibitor was in excess to total enzyme concentration.
By visual inspection, estimates of IC50 values for 10 to 20 pmol of CYP3A4(+b5) were approximately 0.06 to 0.08 μM, respectively (Fig. 5A). Using eq. 5, the Ki of ritonavir, calculated from data obtained for 10 and 20 pmol CYP3A4(+b5), was 0.053 μM assuming only noncompetitive reversible inhibition (Unadkat and Wang, 2000). To confirm that the estimates of reversible inhibition were not influenced by mechanism-based inactivation, linear regression of 6β-hydroxytestosterone formation versus CYP3A4(+b5) from 10 to 50 pmol of CYP3A4(+b5) for each ritonavir concentration was performed (Fig. 5B). Because the slopes change and do not intersect the origin with increased ritonavir and CYP3A4(+b5) concentrations, these results indicate that substantial irreversible inhibition is occurring at ritonavir concentrations above 0.05 μM (Segel, 1975). Therefore, estimation of reversible inhibition by ritonavir with CYP3A4(+b5) was confounded with mechanism-based inactivation inhibition, and accurate estimates of reversible inhibition may not be possible.
Quantitative Predictions of Drug Interactions in Vivo Based on Mechanism-Based Inactivation. Quantitative predictions of drug interactions in vivo are based on the unbound steady-state concentration of the inactivators and the contribution of CYP3A involved in the metabolism of the substrate. Several literature sources used for the predictions did not provide unbound steady-state concentration of ritonavir and these values were estimated from the mean concentration-time profiles. Based on inactivation parameters estimated with HLM and pharmacokinetic properties of each HIV protease inhibitor (de Maat et al., 2003), the predicted increase of AUC′po/AUCpo (Equation. 6) of several coadministered CYP3A substrates in the presence of saquinavir and ritonavir is presented in Table 2.
Pharmacokinetic parameters and predicted extent of interaction of HIV protease inhibitors and CYP3A substrates Predicted values were based on the range of protease inhibitor concentrations, estimated inactivation parameters estimated with HLM, pharmacokinetic properties of each CYP3A substrate, and kdeg values (Correia, 1991; Malhotra et al., 2001).
Discussion
Current HAART is aimed at suppression of viral replication through the use of multiple agents such as protease inhibitors. Yet, this aim is complicated by a variety of drug interactions with coadministration of protease inhibitors. These interactions provide a challenge to optimized therapy. Clinical studies have shown that HIV protease inhibitors inhibit the metabolism of CYP3A substrates, such as rifabutin, clarithromycin, ketoconazole, midazolam, simvastatin, and sildenafil (Hsu et al., 1998; Palkama et al., 1999; Muirhead et al., 2000; Hsyu et al., 2001). In previous attempts to predict the effectiveness of these HIV protease inhibitors as inhibitors of CYP3A in vivo, equilibrium inhibition constants (Ki) for reversible inhibition of CYP3A were determined (Unadkat and Wang, 2000). However, based on the ratio of unbound steady-state plasma concentrations (de Maat et al., 2003) to Ki, conventional reversible inhibition models typically fail to predict inhibition of the metabolism of coadministered CYP3A substrates. In addition, inhibition persists after discontinuation of HIV protease inhibitors when plasma concentrations are below detectable levels (Washington et al., 2003), and a structural analog to the HIV protease inhibitor indinavir demonstrates that cytochrome P450 was inactivated by the formation of MIC (Lin et al., 1995). These factors suggest that in vivo, mechanism-based inactivation may be occurring in addition to reversible inhibition.
In the present study, time- and concentration-dependent decrease of microsomal CYP3A activity with protease inhibitors, except indinavir, provide evidence that inhibition can occur by mechanism-based inactivation (Silverman, 1995). In addition, compared with other inactivators, such as diltiazem, verapamil, and tamoxifen, the studied HIV protease inhibitors are efficient inactivators in vitro as reflected in the ratios of kinact/KI (Jones et al., 1999; Zhao et al., 2002; Wang et al., 2004). For example, the kinact/KI ratio for amprenavir is 40 and 11 times greater than that for (R)-verapamil and (S)-verapamil, respectively. These results indicate that these HIV protease inhibitors are substantially more efficient inactivators than known mechanism-based inactivators that have been reported to cause significant drug-drug interactions.
In some cases, inhibition caused by a mechanism-based inactivator occurs through the formation of a MIC. Ultimately, the inhibitor is catalytically oxidized by the enzyme into the actual inactivating species that coordinates tightly and/or chelates to the prosthetic heme of the enzyme, resulting in a more stable (ferrous) state of iron that can be measured using spectrophotometic methods to detect an absorbance maximum of 445 to 455 nm (Silverman, 1995). It has been shown that primary amines produce MIC formation, although secondary and tertiary amines are appropriate precursors (Franklin, 1977; Bensoussan et al., 1995). In this study, four of the six HIV protease inhibitors—ritonavir, amprenavir, indinavir, and nelfinavir—formed measurable MIC formation with CYP3A4(+b5). The structural moieties that form an MIC may be primary amines present in amprenavir or metabolites from amprenavir and ritonavir metabolism (Singh et al., 1996; Denissen et al., 1997). Metabolites of indinavir, lopinavir, saquinavir, and limited data for circulating metabolites of nelfinavir (Chiba et al., 1997; Kumar et al., 1999; Zhang et al., 2001; Eagling et al., 2002) do not display primary, secondary, or tertiary amines in any of the metabolized structures. However, indinavir and nelfinavir displayed MIC formation. Consequently, the structures for indinavir and nelfinavir that coordinate tightly with the heme cannot be identified. Thus, although data suggest that mechanism-based inactivation is occurring through MIC formation for ritonavir, amprenavir, indinavir, and nelfinavir, the mechanism of inactivation for lopinavir and saquinavir cannot be confirmed through MIC formation.
Relatively few examples in literature of HIV protease inhibitors with good CYP3A substrates are available. However, quantitative prediction of drug interactions in vivo based on unbound steady-state plasma concentrations of saquinavir and ritonavir through the use of a mechanism-based inactivation model (eq. 6) demonstrated that several-fold increases in AUC′po/AUCpo were expected (Table 2). Accurate predictions of the extent of exposure increase in the presence of saquinavir and ritonavir were obtained as estimated values are relatively close to observed values for most substrates. In addition, based on the low, unbound plasma concentrations of nelfinavir (0.07 μM) relative to the reported range of Ki values of 0.31 to 4.8 μM, competitive inhibition predicts an increase of the AUC ratio by only 10 to 20% (Unadkat and Wang, 2000; de Maat et al., 2003), whereas in vivo predictions based on mechanism-based inactivation with nelfinavir anticipate significant interactions such as that observed for simvastatin (5–7-fold) and terfenadine (9-fold) increases in AUC′po/AUCpo (Lillibridge et al., 1998; Hsyu et al., 2001). Thus, these in vivo predictions and observed changes in AUC with HIV protease inhibitors support the use of the mechanism-based inactivation model over simple, competitive inhibition.
An important aspect of this predictive approach was to assume the inhibitor at the active site of the enzyme is equivalent to the unbound concentrations in plasma. But this assumption may be invalid because several HIV protease inhibitors have been shown to be substrates and inhibitors of P-glycoprotein (Alsenz et al., 1998; Kim et al., 1998; Srinivas et al., 1998; Washington et al., 1998). P-glycoprotein functions as an efflux pump that lowers intracellular drug concentrations up to 10-fold in human carcinoma cells (Schuetz et al., 1996). Therefore, the intracellular concentrations of HIV protease inhibitors may be lower than the unbound plasma concentrations. Second, the model assumes the inhibitor has no effect on the rate of CYP3A synthesis. However, nelfinavir, lopinavir, and ritonavir have been reported to induce the rate of expression of CYP3A (de Maat et al., 2003). Because this induction was not included for the predictions, the higher enzyme concentration could decrease the inhibitory effect and the predicted AUC increase will be higher than actually observed. Additionally, unbound KI was assumed equivalent to KI. As assessed in this study, high-affinity binding depleted a small fraction of ritonavir. Because it was assumed the greatest impact for depletion would occur for ritonavir due to the low KI and depletion was negligible, these results would lead to indicate that it is unlikely depletion would occur for the other HIV protease inhibitors. Thus, the approximation that unbound KI is equivalent to KI seems appropriate. In addition, predictions were based on the assumption that the concentration of enzyme at steady-state in the presence of inhibitor (E′ss) was achieved. If E′ss was not achieved, this could explain additional differences noted between predicted and observed AUC increase. The dosing of ritonavir and saquinavir used for several of the predictions might not have been sufficiently long to produce this maximal level of enzyme inactivation. Thus, the predictions would tend to overestimate the extent of interaction. Finally, the predictions are affected by the enzyme degradation rate, kdeg, which was based on rat CYP3A or human CYP3A4 in CaCo-2 cells (Correia, 1991; Malhotra et al., 2001) because a value for the CYP3A4 degradation rate for humans is not available. Thus, these values are likely to be different from humans.
In conclusion, our study demonstrated that in vivo drug interactions with HIV protease inhibitors are most likely due to mechanism-based inhibition of CYP3A. Several of these HIV protease inhibitors demonstrated MIC formation, indicating that a metabolic reactive intermediate complexes with the heme group at the active site of the enzyme. This inactivation of CYP3A is also consistent with the persistent effect observed after discontinuation of therapy. The mechanism-based inactivation model predicted a more accurate increase in exposure of coadministered CYP3A substrates than using conventional reversible inhibition. Understanding the impact of inactivation of CYP3A by these HIV protease inhibitors could lead to better predictions of potential drug-drug interactions.
Footnotes
- Received July 30, 2004.
- Accepted October 26, 2004.
This work was supported in part by National Institutes of Health Grant R01 AG13718 and Food and Drug Administration Grant FD-T-001756-01.
Article, publication date, and citation information can be found at http://jpet.aspetjournals.org.
doi:10.1124/jpet.104.075416.
ABBREVIATIONS: HIV, human immunodeficiency virus; HAART, highly active antiretroviral therapy; MIC, metabolic intermediate complex; P450, cytochrome P450; b5, cytochrome b5; HPLC, high-performance liquid chromatography; HLM, human liver microsome; AUC, area under the plasma concentration time curve.
- The American Society for Pharmacology and Experimental Therapeutics


