


Abstract
Although activation of CYP3A4 is frequently observed in vitro, predictive computational-based models and methods for in vitro-in vivo scaling are scarce. It has been previously shown that in vitro CYP3A4 heteroactivation of carbamazepine (CBZ)-epoxide (ep) formation can be associated with the clinical drug interaction between felbatame and CBZ. The previously reported prediction methodology is applied here to an additional set of in vitro CYP3A4 heteroactivators, some exerting this effect at concentrations relevant in vivo. The antimalarial artemisinin potently increases CBZ-ep formation by a maximum of 500% at 300 μM. Testosterone and progesterone activates by a maximum of 1680 and 920%, respectively, at 150 μM, and quinidine causes a 130% increase at 300 μM. The predicted maximum in vivo decrease in steady-state concentration of carbamazepine (CssCBZ) at saturating effector concentrations is 85 to 90% for testosterone and progesterone, 75% for artemisinin, and 45% for quinidine. The corresponding predicted in vivo increase in CssCBZ-ep is 50, 60, 55, and 30% for artemisinin, testosterone, progesterone, and quinidine, respectively. At effector concentrations relevant in vivo, the CssCBZ change is predicted to ≤20% for testosterone, artemisinin, and quinidine and ≤10% for progesterone, with a concomitant CssCBZ-ep increase of 12% for testosterone and ≤10% for progesterone, artemisinin, and quinidine. Structure-heteroactivation relationships were evaluated by generating a pharmacophore. The model includes two hydrogen bond acceptor features separated by hydrophobic features. Internal predictivity is high, and heteroactivation of an external test set correlate to observed in vitro heteroactivation.
Inhibition of cytochromes P450 is a well known phenomena in vitro and has been shown to translate to decreases in P450-mediated metabolism in vivo, sometimes leading to clinically relevant drug-drug interactions (Lin and Lu, 1998). Quantitative prediction of the in vivo relevance of P450 inhibition based on in vitro data has also become an integral part of drug discovery and is based on methods that are continuously validated by comparison with in vivo observations (Ito et al., 2004). An increased number of attempts have also been made at producing computational models of P450 inhibition (Afzelius et al., 2001; Ekins et al., 2001).
Extensive observations, however, suggest that apart from inhibition, modulation of cytochromes P450 can also occur by activation, a phenomenon that if translated to in vivo events is also a potential source of drug-drug interactions. The in vivo effects of P450 heteroactivation would be observed as an increased clearance of the affected drug, similar to the changes observed by P450 induction, except that the time course of the interaction would not be determined by the rate of synthesis and turnover of P450 enzyme but by the half-lives of the interacting drugs. Activation of CYP3A4 has been extensively studied in vitro and based on site-directed mutagenesis studies (Khan et al., 2002), detailed enzyme kinetics investigations (Shou et al., 1994; Kenworthy et al., 2001; Galetin et al., 2002), and spectroscopic studies (Dabrowski et al., 2002; Yoon et al., 2004), the increase in CYP3A4 activity has been hypothesized to occur by binding of the modulator to one or several binding sites within or near the active site, inducing cooperative effects by either modulation of the active site structure and/or by increasing the catalytic efficiency.
In vivo, P450 heteroactivation has been hypothesized as the cause of the increased clearance of zoxazolamine observed in rats when coadministered with flavone (Lasker et al., 1982, 1984) and of quinidine-induced increases in clearance of diclofenac in rhesus monkey (Tang et al., 1999; Ngui et al., 2000, 2001). In humans, a weak increase (10%) in apparent oral clearance of the CYP2C9 substrate flurbiprofen was observed after 7 days of treatment with dapsone, a heteroactivator of flurbiprofen in vitro (Hutzler et al., 2001). Finally, a clinically observed drug-drug interaction between felbamate and carbamazepine, causing a decrease in steady-state concentrations of carbamazepine (Albani et al., 1991), has been shown to be quantitatively predicted from in vitro human liver microsomal data (Egnell et al., 2003b).
The increase in observations of P450 activation has, however, not been matched by an increase in the number of validated structure- and/or in vitro-based predictive models. A quantitative prediction methodology to assess the in vivo relevance of heteroactivation observed in vitro has been previously proposed (Egnell et al., 2003b). The potential for structure-based prediction of heteroactivators by pharmacophore modeling of CYP2C9 heteroactivation has also been previously indicated (Egnell et al., 2003a).
In this study, the success of predictive models of P450 heteroactivation has been further built upon and assessed. The potential of pharmacophore-based predictions of CYP3A4 heteroactivation was investigated by construction of a pharmacophore model based on heteroactivation of CYP3A4-mediated carbamazepine-epoxide (ep) formation, and its predictability was assessed by use of an external test set from the literature. Furthermore, the previously reported methodology, based on carbamazepine as a sensitive model substrate for prediction of the extent of in vivo heteroactivation from in vitro data (Egnell et al., 2003b), was applied to well known and commonly used CYP3A4 heteroactivators that have not previously been investigated in an in vivo context. The antimalarial artemisinin is also reported here to be a potent heteroactivator of CYP3A4, and enzyme kinetic modeling is applied to compare the characteristics of this heteroactivator with those of the commonly reported CYP3A4 heteroactivator testosterone.
Materials and Methods
Materials
Progesterone, quinidine, α-naphthoflavone, phenobarbital, carbamazepine, carbamazepine-epoxide, β-NADP, isocitric acid, dl-isocitric dehydrogenase, and dimethylformamide (DMF) were from Sigma-Aldrich (St. Louis, MO). Testosterone was from Merck (Darmstadt, Germany), and artemisinin was from Aldrich Chemical Co. (Milwaukee, WI). All other chemicals were of analytical or HPLC grade. Human liver microsomes (HLMs) (from a pool of four livers) were isolated from human livers by differential centrifugation (Raucy and Lasker, 1991). Livers were excess material from partial surgical liver resections at Sahlgrenska University Hospital (Göteborg, Sweden). The local ethics committee approved the collection of all human tissue used in the study.
P450 Activation Studies with Human Liver Microsomes
The effect of testosterone, artemisinin, progesterone, quinidine, α-naphthoflavone, and phenobarbital on the in vitro intrinsic formation clearance of carbamazepine-ep from a therapeutically relevant carbamazepine concentration (20 μM) was characterized with HLM. Microsomes (duplicate samples) were preincubated at a concentration of 1.5 mg/ml with carbamazepine and a range of concentrations (see below) of respective heteroactivators for 5 min at 37°C, and the reaction was started by addition of prewarmed NADPH-regenerating system. Stock solutions of carbamazepine and heteroactivators were in DMF, and the final incubation concentration of this solvent was 0.5%. After 30 min of incubation, the reaction was stopped by addition of ice-cold acetonitrile (40% of incubation volume). Final incubation conditions were 0.1 M KPO4, pH 7.4, 1 mM NADP, 16 mM MgCl2, 7.5 mM isocitric acid, and 1.2 U/ml isocitric acid dehydrogenase. Samples were centrifuged, and supernatants were analyzed for carbamazepine-ep by HPLC-UV.
Concentrations of heteroactivators were chosen to cover a large range of concentrations including reported therapeutic concentrations in humans. Concentrations were 0.25, 0.5, 1, 5, 25, 50, 100, and 150 μM testosterone (reported endogenous in vivo concentration 0.02 μM and up to 0.3 μM when exogenously administered) (Wilson, 1996); 0.25, 1, 10, 50, 100, 150, 300, and 500 μM quinidine (reported in vivo concentration 6–18 μM) (Benet et al., 1996b); 0.01, 0.25, 1, 10, 50, 100, and 150 μM progesterone (reported in vivo concentration <0.05 μM) (Levy et al., 1999); 0.01, 0.25, 1, 10, 50, 100, 150, and 300 μM artemisinin (reported in vivo concentration Cmax 0.1–2 μM) (Chan et al., 1997; Dien et al., 1997; Koopmans et al., 1998, 1999; Svensson et al., 2002); and 0.25, 0.5, 1, 5, 25, 50, 100, and 150 μM α-naphthoflavone (not administered in vivo). Data were analyzed by comparing carbamazepine-ep peak areas (within a linear HPLC-response range) and calculating the degree of heteroactivation as the percent increase in peak area compared with control incubations (absence of heteroactivator).
To allow enzyme kinetic modeling of the effect of artemisinin and testosterone on the formation clearance of carbamazepine-epoxide, these effects were kinetically characterized in more detail with HLM. Carbamazepine concentrations of 0, 10, 20, 30, 40, 50, 100, 150, 300, 600, 900, and 1200 μM were combined with 0, 5, 50, and 500 μM artemisinin and with 0, 1, and 25 μM testosterone. HLMs were used at a concentration of 1 mg/ml. Samples were performed in duplicates with a final DMF concentration of 0.5%. Reactions were preincubated, started with addition of NADPH regenerating system, and stopped by the addition of acetonitrile, as described above. Incubation times were ≤35 min, being lower at higher heteroactivator concentrations to avoid any potentially higher substrate consumption at potent heteroactivation. Substrate consumption was less than 10% and linear with respect to the incubation time used for the different heteroactivator concentrations, as well as for protein concentration. A standard curve for carbamazepine-ep was generated by spiking an incubation matrix identical to that of samples.
To investigate whether artemisinin exhibited auto-activation kinetics, a substrate depletion approach was used since the knowledge of metabolic pattern and the structure of its metabolites is incomplete. Artemisinin at concentrations of 0.25, 0.5, 0.75, 1.0, 2.0, 5.0, 10, 50, and 100 μM were preincubated in duplicates for a minimum of 5 min with human liver microsomes at a final concentration of 1 mg/ml in 0.1 M KPO4, pH 7.4. Reactions were initiated by the addition of NADPH to achieve a final concentration of 1 mM, and samples were withdrawn at sequential time points to vials containing ice-cold MeOH (80 μl MeOH for a 200-μl incubation aliquot). Organic solvent concentration in incubations, from addition of artemisinin from stock solutions, was 0.2% DMF. A standard curve was generated by spiking a matrix identical to that of the samples, except organic solvent concentration was 0.5% and precipitating proteins with ice-cold MeOH before the addition of NADPH. Samples and standards were centrifuged for 10 min at 10,000g at 4°C, and the supernatant was analyzed for artemisinin by HPLC. The data were fitted to first order decay kinetics: C = C0 × e–kt, where C is the concentration at any time (t), C0 is the starting concentration, and k is the first order decay constant, relating to CLint according to: CLint = (k × volume of incubation)/milligrams of microsomal protein.
Analytical Conditions
Carbamazepine-ep was quantified as previously described (Egnell et al., 2003b). A mobile phase consisting of 65% 25 mM K2HPO4 at pH 6, 21% methanol, and 14% acetonitrile was pumped at a flow rate of 1.3 ml/min through a Zorbax-SB-C18 column (4.1 × 15 cm, 5 μm). The analyte was detected by UV at 214 nm. UV response was linear in the range 7 to 714 pmol, and injection volumes of samples were adjusted accordingly. Interassay coefficient of variation was <10% in the concentration range studied. All analysis was performed on a HP-1100 Chemstation (Hewlett Packard, Palo Alto, CA).
There was no interference of the carbamazepine-ep assay by heteroactivators or any potential metabolites formed under the incubation conditions, except for the high-range concentrations of quinidine, in which case extra controls containing quinidine but no carbamazepine were incubated under identical conditions as samples, and interfering peaks were subtracted from those measured in the heteroactivation experiment. The assumption was made that if the interfering peak was due to a metabolite of quinidine, the level of this would not be affected by the presence of the 20 μM carbamazepine used in the assay. Since there was no interfering peak at the concentration of quinidine causing 50% activation, the v150% value used for pharmacophore modeling (see below) was not affected.
Artemisinin was quantified by HPLC using a slight modification of a previously described method (Gordi et al., 2000) employing online postcolumn alkali derivatization of artemisinin to render it UV absorbant. Briefly, a mobile phase consisting of 1:1 acetonitrile/H2O was pumped through a Varian Omnisphere RP C18 column (100 × 3 mm, 5 μm) at a flow rate of 0.5 ml/min. A derivatization solution (0.3 M KOH in 90:10 ethanol/H2O) was connected by a t valve to the flow post column at a rate of 0.45 ml/min. The flow continued through a 5-m-long Teflon coil submerged in a 70°C water bath to allow efficient derivatization before detection by UV at 289 nm. The coefficient of variation was less than 10% within the concentration range used.
In Vitro-in Vivo Correlation
Estimation of potential effects of the observed CYP3A4 heteroactivation on in vivo predicted maximum in vivo decrease in plasma steady-state concentration of carbamazepine (CssCBZ) was performed using the methodology previously reported (Egnell et al., 2003b). Briefly, it can be shown (Egnell et al., 2003b) that following chronic, oral administration, the effect of heteroactivation on plasma steady-state concentrations of parent drug (Css) and its metabolite (Cssmet) can be expressed as: 
 where CLtot is the total in vivo clearance, FH is the fraction escaping first pass metabolism, fa is the fraction absorbed, with subscript met defining the metabolite and subscripts activator and control defining presence and absence of P450 heteroactivator, respectively. For a low-extraction drug like carbamazepine, the effect of heteroactivation on FH will be small unless heteroactivation is potent enough to make the drug a high extraction drug. This was considered unlikely at the degrees of heteroactivation observed in this study and FH was, therefore, assumed to be unaffected. It was further assumed that the heteroactivator does not affect the fraction absorbed or the further metabolism of carbamazepine-ep to carbamazepine-diol. Equations 1 and 2 then reduce to:
 Estimation of the change in in vivo CLtot caused by P450 heteroactivation based on in vitro total CLint by applying the well-stirred model (Pang and Rowland, 1977) requires knowledge or assumptions regarding the contribution of hepatic clearance (CLH) to total clearance and the contribution of other pathways (expressed below as CLrestint) in addition to the one leading to the measured metabolite (expressed below as CLfmetint). In this case, CLfmetint is the in vitro intrinsic formation clearance of carbamazepine-epoxide, and CLrestint is the in vitro intrinsic clearance leading to any other, not monitored, metabolite of carbamazepine. Assuming that CLrestint is not affected by heteroactivation, the change in total in vivo clearance can be expressed as eq. 5:
  where fuplasma and fumic are the free fractions of carbamazepine in plasma and human liver microsomes, respectively.
For a low-extraction drug like carbamazepine, correct experimental estimation of CLrestint is difficult due to low parent drug disappearance rates. A simplified approach is to make use of the relationship:  where the ratio of in vivo formation clearances (CLfmet) of this pathway in the presence and absence of heteroactivation can be estimated by the numerical approximation in eq. 8 that is valid for a low-extraction drug (rationale explained below). Further,
  where FICLfmet is the fractional increase in formation clearance of the metabolite, as has been shown previously to be valid when the magnitude of clearance through alternative pathways is unaffected by the heteroactivator (Egnell et al., 2003b).
  The numerical approximation in eq. 8 is valid for low-extraction drugs regardless of the level of heteroactivation. For a low-extraction drug with low degrees of heteroactivation, even if there are alternative pathways, hepatic clearance will be independent on blood flow, and eq. 8 can be more correctly expressed as:
  However, as heteroactivation increases, in vivo hepatic clearance will start to be influenced by blood flow. Adding the blood flow, as is done in eq. 8, yields a numerical approximation for a case where heteroactivation is low, which is not significantly different from that of eq. 9 but has the advantage of being valid also when heteroactivation is high. As activation increases and formation clearance of the activated pathway exceeds the other low-clearance pathways, the intrinsic formation clearance in the activated state will approach total hepatic intrinsic clearance, making eq. 8 a valid numerical approximation. The largest error introduced by using eq. 8 for a low-extraction drug would occur when the fraction metabolized via the activated pathway is low and activation is not substantial enough to exceed the clearance by alternative pathways.
The values of fumic (0.96), fuplasma (0.36), and intrinsic formation clearance of carbamazepine-ep formation under control conditions have been previously reported (Benet et al., 1996b; Egnell et al., 2003b). The microsomal scaling factor used was 40 mg/g liver, and human hepatic blood flow was set to 23 ml/min/kg. Intrinsic formation clearance of carbamazepine-ep formation was calculated by adjusting that under control conditions by the percent activation seen with HLM. The magnitude of fmcontrol for chronic oral administration was approximated to 0.6, based on calculations from literature data (yielding values of 0.4–0.7 for single dosing, increasing to up to 0.85 for chronic dosing) (Eichelbaum et al., 1985; Sumi et al., 1987; Faigle and Feldmann, 1989; Robbins et al., 1990; Kerr et al., 1994).
Enzyme Kinetics of CYP3A4 Heteroactivation by Artemisinin and Testosterone
Fitting of P450 enzyme kinetic models describing the effect of multiple and cooperative ligand binding to cytochromes P450 to in vitro kinetic data has been reported in a number of studies (Shou et al., 1994, 1999; Korzekwa et al., 1998; Kenworthy et al., 2001; Galetin et al., 2002; Hutzler et al., 2003). Although the underlying assumptions made are based on a number of simplifications regarding the interaction between the P450 and the ligand on a molecular level, these mechanistic models are both useful and robust tools for studying the effects of cooperative binding of substrates and effectors to cytochromes P450 (Shou et al., 1994, 1999; Korzekwa et al., 1998; Kenworthy et al., 2001; Galetin et al., 2002) and have been applied to characterize further the effect of artemisinin and testosterone on carbamazepine-ep formation.
Velocity equations were derived from the model adapted from Kenworthy et al. (2001) (Fig. 1) and were fitted to the velocity versus substrate concentration data for carbamazepine-ep formation with HLM in the absence and presence of different concentrations of artemisinin and testosterone. The model assumes two identical binding sites that can bind either substrate or effector. The positive cooperative effects on CYP3A4 by carbamazepine (Korzekwa et al., 1998; Egnell et al., 2003b) and testosterone (Galetin et al., 2003) are accommodated in the model by the parameter α, which describes the change in affinity caused by binding of a single carbamazepine or testosterone molecule. In contrast, since there was no sign of auto-activation for artemisinin as judged by half-life determinations with HLM in the concentration range 0.25 to 100 μM (Fig. 2), the α accommodating auto-activation was not included when modeling the artemisinin data. For both artemisinin and testosterone, the potential effect on the catalytic efficiency by effector binding is described by the parameter γ. Corresponding velocity equations (Fig. 1) were derived using rapid equilibrium assumptions (Segel, 1975), and the model fitting was performed using the software GraFit (Erithacus Software, Horley, Surrey, UK).

Two-site enzyme kinetic model and corresponding velocity equations describing heteroactivation of metabolite formation (Kenworthy et al., 2001), used for fitting of experimental data showing CYP3A4 heteroactivation by artemisinin and testosterone. E, P450; S, carbamazepine; A, heteroactivator; Kp, catalytic efficiency constant; Ks, dissociation constant for carbamazepine binding; Ka, dissociation constant for heteroactivator binding; α interaction factor describing heteroactivator or substrate binding-induced change in carbamazepine and testosterone affinity; γ interaction factor describing heteroactivator-induced change in catalytic efficiency.

In vitro first order P450-mediated disappearance of artemisinin with human liver microsomes (1 mg/ml) at different starting concentrations of artemisinin. Data are presented as duplicate incubations and are fitted to a first order decay model. Concentrations are starting concentrations of artemisinin. CLint values are in microliters per minute per milligram of microsomal protein.
Pharmacophore Generation
Use of the Concentration Yielding 150% of Control Reaction Velocity (v150%) as Pharmacophore Modeling Parameter. The experimental endpoint used for building the heteroactivator pharmacophore was v150% at a fixed substrate concentration, as has been described previously for a CYP2C9 heteroactivation pharmacophore (Egnell et al., 2003a). A theoretical relationship between v150% and the heteroactivator affinity constant Ka, can be derived if making an analogy to the enzyme kinetic modeling approach discussed above. CYP3A4 mediated carbamazepine-ep formation, and its heteroactivation can be described by the parameters Vmax, Ks, Ka, α, and γ, together with S (substrate concentration) and A (heteroactivator concentration). When A = v150%, then [vactivation/vcontrol] = 1.5, and heteroactivator affinity Ka can be expressed as a function of Vmax, Ks, Ka, α, γ, S, and v150%. Since substrate concentration S was held constant between experiments, and the parameters Vmax and Ks can be regarded as constant between heteroactivators, it follows that if heteroactivators are characterized by the same α and γ, any change in Ka between heteroactivators would be reflected by a change in v150%.
The quantitative relationship between Ka and v150% will differ depending on the mechanism of the protein-ligand interaction. Only in the case where all CYP3A4 heteroactivators interact with the P450 in a similar manner, causing the same maximal change in substrate affinity and catalytic efficiency, will v150% change proportionally with Ka and be a pure reflection of affinity. Without further insight into the molecular mechanisms underlying heteroactivation of CYP3A4, it is prudent to assume that the experimental modeling endpoint v150% contains information on potency.
Molecular Modeling and Pharmacophore Generation. The training set and the respective v150% values used for pharmacophore generation in Catalyst are shown in Table 1. The training set includes felbamate, for which the v150% was deduced from the experimental results previously reported (Egnell et al., 2003b). v150% values were obtained from plots of percent activation versus heteroactivator concentration.
Training set for generation of CYP3A4 heteroactivation pharmacophore
Three-dimensional structures of heteroactivator training and test sets were generated in CONCORD (Tripos, St. Louis, MO) and imported in Catalyst, where all subsequent modeling and pharmacophore generation was performed. Three-dimensional minimization and conformer generation were performed within Catalyst, which uses a force field with a parameter set derived from the CHARMm force field. For each structure, a maximum of 255 conformers were generated using the Best Quality feature of the software to maximize the coverage of conformational space. The generation of conformers in Catalyst is performed using the poling method (Smellie et al., 1995a,b,c), designed to cover the broadest low-energy conformational space possible (Barnum et al., 1996), by introducing a so-called poling function in the force field calculation to favor generation of conformers from previously unexplored conformational space.
Possible features specified for pharmacophore generation were hydrogen bond acceptors, hydrogen bond donors, hydrophobes, positive ionizable features, and aromatic rings. All molecular and pharmacophore modeling was performed on a Silicon Graphics O2 workstation (SGI, Mountain View, CA).
Pharmacophore Validation. Estimation of significance of the pharmacophore was based on the difference in cost between the pharmacophore and the related null hypothesis (the theoretical cost for generating a hypothesis that contains no pharmacophore features and that estimates all activities to be the average activity), as well as on the correlation coefficient (r and r2) of log (observed v150%) versus log (predicted v150%) for the training set (internal predictivity). Statistical validity was further tested by repeating pharmacophore generation using identical conditions except for permutation of v150% values. Permutation was performed by randomizing values, making sure no compound retained its original v150% value.
External predictivity of the model was estimated by challenging the pharmacophore with reported heteroactivators of carbamazepine-ep formation (Nakamura et al., 2002). Due to differences in experimental setup, no v150% values were available for the external test set. However, since the endpoint reported for the external test set—percent activation at 100 μM effector and 100 μM carbamazepine (%act)—was available for several of the compounds for which v150% was measured, these data were used to validate a potential correlation between observed v150% and observed %act. The corresponding correlation between predicted v150% and observed %act for the external test set was used to validate the external predictivity of the model.
Results
P450 Activation Studies with Human Liver Microsomes. As shown in Fig. 2, there are no signs of auto-activation kinetics of artemisinin within the concentration range studied with human liver microsomes, as shown by the lack of increase in CLint with increasing concentrations. Artemisinin, however, potently heteroactivates carbamazepine-ep formation at a therapeutically relevant carbamazepine concentration (20 μM), by a maximum of 500% activation at 300 μM artemisinin. Testosterone and progesterone increased reaction velocity by a maximum of 1680 and 920% at 150 μM, respectively, whereas 300 μM quinidine resulted in a 130% increase. Phenobarbital had no effect on carbamazepine-ep formation (not shown) and was used as a negative control for pharmacophore validation. The percent increase in in vitro clearance caused by the heteroactivators is plotted in Fig. 3A as a function of the heteroactivator concentration. The increased levels of carbamazepine-ep were not due to potential inhibition of further metabolism of carbamazepine-ep, since no disappearance of carbamazepine-ep could be detected at the incubation conditions used (data not shown).

A, in vitro heteroactivation of carbamazepine-ep formation from 20 μM carbamazepine with human liver microsomes. B, predicted potential in vivo effect of heteroactivators on CssCBZ. C, predicted potential in vivo effect of heteroactivators on CssCBZ-ep. Filled circles, testosterone; open circles, α-naphthoflavone; filled squares, progesterone; open squares, artemisinin; filled triangles, quinidine. Data are presented as the mean of duplicate incubations with error bars representing ranges.
In Vitro-in Vivo Correlation. The predicted changes in CssCBZ and CssCBZ-ep resulting from heteroactivation are shown in Fig. 3, B and C, respectively. The theoretical maximum decrease in CssCBZ at a saturating effector concentration is 85 to 90% for testosterone and progesterone, 75% for artemisinin, and 45% for quinidine. The corresponding maximum increase in CssCBZ-ep is predicted to be 50, 60, 55, and 30% for artemisinin, testosterone, progesterone, and quinidine, respectively. Assuming that the effector has a hepatic/blood concentration ratio of 1, the decrease in CssCBZ at concentrations relevant in vivo is predicted to ≤20% for testosterone, artemisinin, and quinidine and ≤10% for progesterone, with concomitant increases in CssCBZ-ep of 12% for testosterone and ≤10% for progesterone, artemisinin, and quinidine.
Enzyme Kinetics of CYP3A4 Heteroactivation by Artemisinin and Testosterone. The effect of artemisinin on carbamazepine-ep formation with HLM is shown in Fig. 4. Testosterone is a more potent activator than artemisinin, with 2400% of control activity at 400 μM testosterone, compared with slightly over 800% of control activity at 500 μM artemisinin using 10 μM carbamazepine. This is in accordance with results from the single concentration carbamazepine-ep heteroactivation assay (Fig. 3A) and is reflected in the difference in v150% values (Table 1).

Auto- and heteroactivation of the in vitro intrinsic formation clearance (V/[S]) of carbamazepine-ep with human liver microsomes in the presence and absence of artemisinin, with data presented as means of duplicate incubations with error bars representing ranges. Mean values are presented as clearance plots (A), Eadie-Hofstee plots, used for diagnosing autoactivation (B), and as the percentage of change caused by heteroactivation (C).
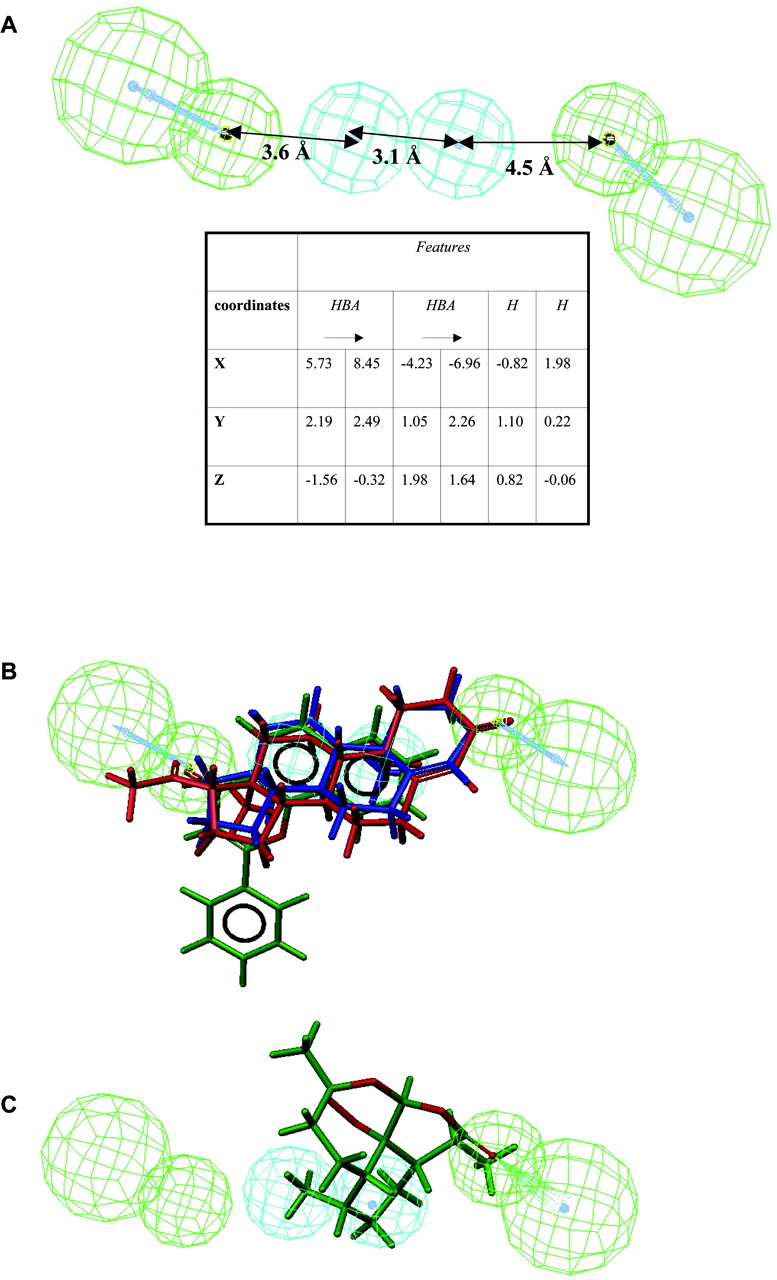
Pharmacophore Generation and Evaluation. The lowest cost pharmacophore generated based on the training set in Table 1 includes two hydrogen bond acceptor features, separated by two hydrophobic features. The pharmacophore is shown with its coordinates in Fig. 5A and superimposed with the most potent training set compounds in Fig. 5B and with the less potent artemisinin in Fig. 5C. The cost for generating the pharmacophore was slightly lower than for the null hypothesis (pharmacophore cost, 31.77; null hypothesis cost, 31.91). Despite the low difference in cost to the null hypothesis, internal predictivity was high (r of log [observed v150%] versus log [predicted v150%], 0.95; r2, 0.90), with all compounds in the training set being correctly classified within 0.65 log units (Fig. 6).

A, CYP3A4 heteroactivation pharmacophore and its coordinates, generated based on v150% values of six carbamazepine-ep formation heteroactivators with human liver microsomes (see Table 1 for training set compounds). B, CYP3A4 heteroactivation pharmacophore fitted with the three most potent heteroactivators in the training set; testosterone in blue (v150% observed, 0.45 μM; predicted, 0.52 μM), α-naphthoflavone in green (v150% observed, 1.5 μM; predicted, 5.3 μM) and progesterone in red (v150% observed, 3 μM; predicted, 1.8 μM). C, pharmacophore fitted with artemisinin (v150% observed, 5 μM; predicted, 6.1 μM). All pharmaco-phore fitting was performed with the Fast Fit feature of Catalyst.

Internal predictivity of the CYP3A4 heteroactivation pharmacophore. Correlation coefficient r, 0.95 (r2, 0.90). Dotted lines define ±1 log unit deviation from unity.
The correlation between v150% and the available heteroactivation endpoint for the external test set, %act at 100 μM effector and 100 μM carbamazepine, was validated by comparison of these endpoints for the compounds for which both parameters were known. Results (Fig. 7A) indicate a high correlation between the logarithms of the two endpoints (r for [log v150%] versus [log %act], 0.96; r2, 0.92).

A, validation of potential correlation between v150% (pharmacophore modeling parameter) and percent activation by 100 μM effector of metabolism of 100 μM carbamazepine (%act) as reported for heteroactivators used for validation of external predictivity of the model. Compounds for which both endpoints were available are artemisinin, testosterone, felbamate, progesterone, and α-naphthoflavone (Nakamura et al., 2002; Egnell et al., 2003b). The linear regression line is shown, correlation coefficient r, 0.96 (r2, 0.92). B, external prediction ability of the CYP3A4 heteroactivation pharmacophore. Open circles, compounds with sulfate- and hydroxyl-group substitutions to potent core heteroactivator structures that renders them almost inactive, which is not recognized by the model, and that were excluded from the correlation analysis as described in the text. Nine data points were used in linear regression, correlation coefficient r, 0.72 (r2, 0.52). Dotted line, regression line shown in A. C, lack of external prediction ability by the pharmacophore generated using permuted v150% values. Compounds plotted are identical to those in B.
Predictivity of the pharmacophore with regard to the external test set, mainly derived from a set of reported steroids (Nakamura et al., 2002), is shown in Table 3. Eighty percent (four of five) of the compounds with %act > 100 were predicted with v150% < 5 μM. Of all activators (n = 12), 75% were predicted with v150% < 20 μM. As seen in Table 3, the model does not recognize the loss in heteroactivation potency caused by addition of a sulfate or a hydroxyl-group to an otherwise potent core structure (e.g., pregnenolone and hydroxy-pregnenolone-sulfate; dehydroepiandrosterone and dehydroepiandrosterone-sulfate). The data for which log-predicted v150% and log %act could be calculated for the external test set are plotted in Fig. 7B. The linear model describing the correlation between predicted log v150% and observed log %act, excluding substituted potent core structures as discussed above, corresponds well with the observed correlation between measured endpoints (Fig. 7, A and B). The correlation coefficient r for [log-predicted v150%] versus [log-observed %act] is 0.72 (r2, 0.52).
External test set for CYP3A4 heteroactivation pharmacophore
Permuting the v150% values yielded a pharmacophore with a similar difference in cost to its null hypothesis as for the original pharmacophore. However, the inability of the permuted pharmacophore to externally predict heteroactivation potency is evident (Fig. 7C).
Discussion
It can be concluded that testosterone, quinidine, progesterone, α-naphthoflavone, and artemisinin are heteroactivators of carbamazepine-epoxide formation with HLM. The effects can not be explained by displacement from microsomal binding sites, since the free microsomal fraction of carbamazepine is 0.96 (Egnell et al., 2003b), or by other known artifacts of in vitro P450 activation (Houston and Kenworthy, 2000). Based on previously published data showing that CYP3A4 is the only isoform capable of carbamazepine-ep formation at the concentrations used in this study (Egnell et al., 2003b), this suggests that the effects are due to an increase in activity of CYP3A4. The results support previous observations that progesterone and α-naphthoflavone heteroactivate carbamazepine-ep formation (Kerr et al., 1994; Ueng et al., 1997). Although testosterone and quinidine have been previously reported to heteroactivate other CYP3A4 substrates (Stresser et al., 2000; Wang et al., 2000; Kenworthy et al., 2001; Galetin et al., 2002), this is to our knowledge the first report of their ability to heteroactivate the metabolism of carbamazepine. Artemisinin has not been previously studied with respect to P450 heteroactivation. Artemisinin is metabolized primarily by CYP2B6 with a probable secondary contribution of CYP3A4 in individuals with low CYP2B6 levels (Svensson and Ashton, 1999). Artemisinin has shown signs of nonlinear pharmacokinetics in humans (Ashton et al., 1998); however, this nonlinearity is probably not a result of positive P450 cooperativity since no sign of autoactivation of artemisinin elimination could be observed in human liver microsomes (Fig. 2).
The heteroactivation increases with concentration for all heteroactivators tested except for α-naphthoflavone (Fig. 3). It cannot be concluded based on the current study whether the sudden drop in activation is due to experimental artifacts such as solubility problems or to an actual decrease in the heteroactivating effect, e.g., by competition with carbamazepine for a common binding site at higher α-naphthoflavone concentrations. However, similar effects have been noted for the interaction of testosterone on diazepam (Kenworthy et al., 2001) and quinidine on felodipine (Galetin et al., 2002).
Clearance versus substrate concentration plots (Fig. 4A) and Eadie-Hofstee plots (Fig. 4B) for the effect of artemisinin on carbamazepine-ep formation suggest loss of sigmoidicity, resulting in hyperbolic kinetics at high effector concentrations, as was also observed with testosterone (data not shown). Such saturation of the heteroactivating effect has commonly been observed for P450 heteroactivators (Houston and Kenworthy, 2000) and is in accordance with suggested mechanistic models (Kenworthy et al., 2001). The two-site mechanistic model, based on the assumption that heteroactivators bind allosterically to the CYP3A4 active site to induce cooperative effects in affinity and/or catalytic efficiency, suggests that both testosterone and artemisinin increase carbamazepine affinity and the catalytic efficiency of carbamazepine-ep formation, as judged by changes in the parameters α and γ (Fig. 1; Table 2). Parameter estimates suggest that the affinity increase for the substrate caused by carbamazepine auto-activation and by artemisinin is extensive, with a 10-fold lowering of the Ks at saturating amounts of carbamazepine or artemisinin. Furthermore, the model indicates that the increase in catalytic efficiency caused by artemisinin (defined by the γ term) is up to 2-fold at saturating activator concentrations. The version of the model taking into account also the reported cooperative CYP3A4 binding of testosterone (Galetin et al., 2003) fits well to the experimental data on the effect of testosterone on carbamazepine-ep formation. Parameter estimates (Table 2) suggest that the increase in affinity for the substrate caused by auto-activation and by testosterone results in a 30-fold lowering of the Ks at saturating amounts of carbamazepine or testosterone. Furthermore, the model indicates that the catalytic efficiency increases up to 4-fold at saturating testosterone concentrations. In accordance with experimental observations, parameter estimates indicate that testosterone activates carbamazepine-ep formation more efficiently than artemisinin (lower α value and higher γ value) and that it has a higher affinity to the P450 (estimated Ka for testosterone = 257 ± 35 μM; estimated Ka for artemisinin = 567.3 ± 133 μM). Parameter estimates obtained from enzyme kinetic modeling are in accordance with the experimental observation that testosterone is a more efficient heteroactivator than artemisinin and suggest that the v150% used for pharmacophore generation is a composite parameter of both potency and affinity.
Parameter estimates (standard error of estimate in parenthesis) from two-site mechanistic modeling of the effect of artemisinin and testosterone on CYP3A4-mediated carbamazepine-epoxide formation in human liver microsomes
Several of the identified heteroactivators increase carbamazepine-ep formation at concentrations corresponding to clinically relevant plasma concentrations. The previously reported prediction approach for estimating the magnitude of change in plasma steady-state concentration Css caused by in vivo P450 heteroactivation (Egnell et al., 2003b) predicts that for the low in vivo concentrations of the heteroactivators studied here, ≤20% decrease in CssCBZ and ≤12% increase in CssCBZ-ep would occur. This is consistent with the lack of in vivo effect of testosterone on carbamazepine clearance (Reith et al., 2000) and with the lack of reports of increases in carbamazepine clearance by any of the other studied compounds.
The CYP3A4 heteroactivation pharmacophore generated in Catalyst suggests that the heteroactivation potency toward carbamazepine-ep formation is correlated to the presence of two hydrogen bond acceptors separated by hydrophobic features, as represented in Fig. 5. Based on a number of experimental approaches, it has been suggested that heteroactivators of CYP3A4 exert their effect by binding to the active site (Shou et al., 1994; Domanski et al., 2000; Hosea et al., 2000; Lu et al., 2001). The importance of hydrogen bond acceptors and hydrophobic features for affinity to the CYP3A4 active site has been suggested previously based on structure based modeling for affinity of CYP3A4 substrates and inhibitors (Lewis et al., 1996; Ekins et al., 1999a,b). A reported pharmacophore based on three CYP3A4 auto-activators also identifies hydrogen bond acceptors and hydrophobes as important features (Ekins et al., 1999b). For binding of CYP3A4 substrates, a hydrogen bond donor has been suggested as an additional important feature (Ekins et al., 1999b).
The CYP3A4 heteroactivation pharmacophore presented in this report successfully identifies the majority of potent heteroactivators from an external set of heteroactivators and nonactives (75% of external heteroactivators predicted to have v150% < 20 μM) (Table 3). It does not, however, recognize the loss in heteroactivation potency caused by addition of a sulfate or a hydroxyl-group to an otherwise potent core structure. This suggests that a more elaborate approach taking into account negative features for binding and inclusion of such compounds in the training set might have to be used to build a model yielding fewer false positives. Furthermore, limited structural diversity in the training and test set, due to the overrepresentation of steroid cores among known CYP3A4 heteroactivators, is a weakness of the current model that can only be overcome as more heteroactivators are identified. However, despite potential interlaboratory differences and different potency endpoints between training set and external test set, externally predicted v150% correlates to observed %act (Fig. 7B). The fact that such a correlation is completely absent for a model built after randomizing v150% values of the training set (Fig. 7C) supports the validity of the presented CYP3A4 heteroactivation pharmacophore.
In summary, the application of a previously reported in vitro-in vivo scaling approach (Egnell et al., 2003b) has been shown on an additional number of oral drugs and endogenous compounds that heteroactivate carbamazepine-ep formation in vitro. The pharmacophore based on the experimental in vitro data suggests that CYP3A4 heteroactivation is correlated to specific structural features, suggesting that prediction of such phenomena may be possible using computational methods.
Acknowledgments
We thank Aleksandra Galetin (School of Pharmacy and Pharmaceutical Sciences, University of Manchester, UK) for helpful discussions regarding the enzyme kinetic modeling and Sara Asimus (Unit for Pharmacokinetics and Drug Metabolism, Göteborg University, Sweden) for skillful quantification of artemisinin.
Footnotes
-
doi:10.1124/jpet.104.078519.
-
ABBREVIATIONS: ep, epoxide; DMF, dimethylformamide; HPLC, high-pressure liquid chromatography; HLM, human liver microsome; MeOH, methanol; CssCBZ, plasma steady-state concentration of carbamazepine; CssCBZ-ep, plasma steady-state concentration of carbamazepine-ep; v150%, concentration of heteroactivator giving 150% of reaction velocity; %act, percent activation caused by 100 μM effector and 100 μM carbamazepine.
- Received September 29, 2004.
- Accepted November 24, 2004.
- The American Society for Pharmacology and Experimental Therapeutics


