


Abstract
The complexity of in vitro kinetic phenomena observed for CYP3A4 substrates (homo- or heterotropic cooperativity) confounds the prediction of drug-drug interactions, and an evaluation of alternative and/or pragmatic approaches and substrates is needed. The current study focused on the utility of the three most commonly used CYP3A4 in vitro probes for the prediction of 26 reported in vivo interactions with azole inhibitors (increase in area under the curve ranged from 1.2 to 24, 50% in the range of potent inhibition). In addition to midazolam, testosterone, and nifedipine, quinidine was explored as a more “pragmatic” substrate due to its kinetic properties and specificity toward CYP3A4 in comparison with CYP3A5. Ki estimates obtained in human liver microsomes under standardized in vitro conditions for each of the four probes were used to determine the validity of substrate substitution in CYP3A4 drug-drug interaction prediction. Detailed inhibitor-related (microsomal binding, depletion over incubation time) and substrate-related factors (cooperativity, contribution of other metabolic pathways, or renal excretion) were incorporated in the assessment of the interaction potential. All four CYP3A4 probes predicted 69 to 81% of the interactions with azoles within 2-fold of the mean in vivo value. Comparison of simple and multisite mechanistic models and interaction prediction accuracy for each of the in vitro probes indicated that midazolam and quinidine in vitro data provided the best assessment of a potential interaction, with the lowest bias and the highest precision of the prediction. Further investigations with a wider range of inhibitors are required to substantiate these findings.
CYP3A4 is the most abundant human P450 enzyme, metabolizing a wide range of structurally diverse therapeutic agents; hence, it is the target for many drug-drug interactions (DDI). A recent Food and Drug Administration report (Yuan et al., 2002) has shown testosterone to be the most commonly used in vitro CYP3A4 probe (50% of reported studies) in contrast to midazolam (15–20% of in vitro estimates of CYP3A4 activity) whereas nifedipine, felodipine, and erythromycin were used in less than 10% of studies. The existence of different substrate subgroups for CYP3A4 was based on correlation and cluster analysis of CYP3A4 inhibition data for a range of modifiers (Kenworthy et al., 1999). This was substantiated by others (Stresser et al., 2000) and further investigated in a number of detailed mechanistic kinetic studies (Houston et al., 2003) that indicated the existence of distinct and preferential binding domains for each substrate subgroup, namely, midazolam, testosterone, and nifedipine. Due to the substrate-differential response observed for CYP3A4, the recommended approach to CYP3A4 DDI analysis is the use of multiprobes (Tucker et al., 2001; Bjornsson et al., 2003) where the lowest inhibition constant (Ki) obtained indicates the “worst case scenario” for a potential interaction. However, an inappropriate selection of a probe substrate may lead to false positive or negative prediction of a DDI.
An additional complicating issue in the assessment of CYP3A inhibition potential is the occurrence of homo/heterotropic cooperativity in vitro. This may result in a sigmoidal kinetic profile (for testosterone), substrate inhibition (for nifedipine), and limited substrate substitution and inhibitory reciprocity (Korzekwa, 2002; Houston et al., 2003). These “atypical” phenomena attributed to the existence of multiple binding sites have been associated with CYP3A4; however recent studies indicate similar behavior for other P450s (Egnell et al., 2003; Hutzler et al., 2003) and UDP glucuronosyltransferase enzymes (Uchaipichat et al., 2004). The incorporation of homo/heterotropic cooperativity in the in vitro-in vivo prediction of either clearance or DDI is not widely adopted. Although their actual in vivo relevance remains questionable, appropriate in vitro analysis is essential for accurate quantitative estimates of both clearance and DDI (Houston and Galetin, 2003).
To provide a link between the in vitro multisite inhibition data and the actual in vivo inhibition interactions, a prediction equation based on the same rapid equilibrium/steady-state assumptions as the single-site inhibition models (Segel, 1975) has been derived (see Appendix). In accordance with previous analysis (Tucker et al., 2001; Ito et al., 2004), the metric for the degree of DDI is the AUCi/AUC ratio for the plasma concentration-time profiles in the presence and absence of the inhibitor, respectively. The complexity of multisite kinetic analysis observed with certain CYP3A4 substrates indicated the need for an assessment of alternative and/or more pragmatic approaches and substrates for the prediction of potential DDI involving this enzyme.
The aim of the current study was to evaluate the importance of substrate selection for predicting a range of reported CYP3A4 drug interactions with ketoconazole, itraconazole, and fluconazole. The in vivo interactions previously reported by Ito et al. (2004) were critically reviewed and 26 studies were selected, including 13 different CYP3A4 substrates from different therapeutic and substrate subgroups. Classifying these studies according to Bjornsson et al. (2003) (Fig. 1) indicated that 50% of interactions were in the range of potent inhibition (AUCi/AUC >5).
The importance of substrate selection (and/or appropriate substitution) was assessed by comparing the extent of predicted AUCi/AUC ratios for a range of CYP3A4 in vivo interactions applying the Ki estimates for either midazolam, testosterone, nifedipine, or quinidine. In addition to the three most commonly used in vitro probes, quinidine was investigated as a “pragmatic” substrate due to its apparent Michaelis-Menten kinetic properties and specificity toward CYP3A4 in comparison with CYP3A5 (Galetin et al., 2004). To minimize experimental variability and provide the least bias in the in vitro estimates, all the inhibition studies were performed under standardized conditions using the same batch of human liver microsomes, low protein concentration, and an appropriate range of concentrations for both the inhibitor and substrate. Detailed inhibitor- (microsomal binding, depletion over incubation time) and substrate-related factors (cooperativity, contribution of other metabolic pathways, or renal excretion) were incorporated into the prediction of DDI.

Classification of the 26 CYP3A4 in vivo studies investigated according to Bjornsson et al. (2003) indicated that 19% of studies were cases of weak inhibition (□, AUCi/AUC < 2), 30% moderate ( , 2 < AUCi/AUC < 5), and the remainder (50%) were potent (▪, AUCi/AUC > 5). The order of in vivo studies shown corresponds to the listing in Table 2.
The current study demonstrates that the “simple” in vitro inhibition profiles of midazolam and quinidine with azoles provide good DDI prediction accuracy and precision. In comparison with other probes (nifedipine and testosterone), they offer a more pragmatic choice of substrate for extrapolation across the range of CYP3A substrates and identification of potential DDI from in vitro data.
Materials and Methods
Chemicals. Midazolam, testosterone, quinidine, nifedipine, 6β-hydroxytestosterone, ketoconazole, fluconazole, prednisone, verapamil, dextromethorphan, NADP, isocitric dehydrogenase were purchased from Sigma Chemical (Poole, Dorset, UK). (3S)-3-Hydroxyquinidine, oxidized nifedipine, itraconazole, and midazolam metabolites were obtained from Ultrafine Chemicals (Manchester, UK). All other reagents and solvents were of high analytical grade. Pooled human liver microsomes (n = 22, testosterone 6β-hydroxylation activity = 6.4 nmol/min/mg protein) were obtained from BD Gentest (Woburn, MA).
In Vitro Inhibition Studies. Interaction studies were performed at incubation times (2.5 min, midazolam; 10 min, nifedipine; and 15 min, quinidine and testosterone), and protein concentrations (0.25 mg/ml) were within the linear range for the each substrate. Microsomes were suspended in phosphate buffer (0.1 M, pH 7.4) with the final incubation volume of 0.25 ml. Samples were preincubated for 5 min in a shaking water bath at 37°C, and each reaction was initiated with an NADPH regenerating system (1 mM NADP+, 7.5 mM isocitric acid, 10 mM magnesium chloride, and 0.2 units of isocitric dehydrogenase). The final concentration of the organic solvent (either methanol or acetonitrile) in incubation media was 0.2% (v/v). The substrate concentrations ranged from 5 to 50 μM (midazolam), 25 to 250 μM (quinidine), 2.5 to 100 μM (nifedipine), and 5 to 200 μM (testosterone). The concentrations of the inhibitors ranged from 0.01 to 10 μM (ketoconazole), 0.1 to 100 μM (fluconazole), and 0.01 to 10 μM (itraconazole). The reaction was terminated by 0.25 ml of ice-cold acetonitrile with 1 μM of the appropriate internal standard. Samples were centrifuged at 13,400g for 10 min and further analyzed by LC-MS/MS.
Microsomal Binding and Inhibitor Depletion. In addition to the effect of multisite binding on Ki estimates, the impact of nonspecific microsomal binding and depletion of an inhibitor during the incubation time on the Ki estimates was assessed. Depletion of azoles was evaluated over the range of substrate concentrations investigated (above and below Km) for each individual substrate.
Binding to Microsomes. The binding of the inhibitors to human liver microsomes was determined by either microfiltration or dialysis, depending upon the extent of nonspecific binding to microfiltration tubes. Fluconazole was incubated (nominally 1 and 10 μM) with microsomes (0.5, 1.0, or 2.0 mg protein/ml) in 0.1 M phosphate buffer (0.5 ml, including 1% acetonitrile from the dilution of fluconazole) at 37°C for 10 min. The incubate was filtered by centrifugation at approximately 10,000g for 10 s through Whatman Anopore 0.05-μm microfiltration tubes (Whatman, Maidstone, UK). Samples of the incubate and filtrate were analyzed by LC-MS/MS. The binding of ketoconazole and itraconazole was determined by dialysis. Cellulose membranes (Dianorm, Munich, Germany) were conditioned overnight in 0.1 M phosphate buffer, at approximately 10°C. The compounds were incubated (nominally at 1 μM) with microsomes (0.01, 0.03, 0.1, and 0.5 mg protein/ml) in 0.1 M phosphate buffer (1.0 ml, including 1% acetonitrile from the dilution of ketoconazole or itraconazole) contained in Dianorm dialysis chambers that were rotated at 37°C for 6 h. Samples of dialysate were collected at 1, 3, and 6 h and analyzed, together with samples of the solution added to the microsomes, by LC-MS/MS.
Determination of Substrate and Metabolite Concentration. The metabolites 1′-hydroxymidazolam, 3-hydroxyquinidine, oxidized nifedipine, and 6β-hydroxytestosterone and the inhibitors ketoconazole, fluconazole, and itraconazole were quantified by LC-MS/MS. For each assay, nine calibration standards with a blank were prepared in a matrix identical to the incubation extracts and included levels at below and above the expected concentrations. Each metabolite, together with either alprazolam (1′-hydroxymidazolam), dextromethorphan (3-hydroxyquinidine and oxidized nifedipine) or prednisone (6β-hydroxytestosterone) as internal standard and either inhibitor (with verapamil as internal standard), were separated on a Luna C18(2) 50 × 4.6 mm 3-μm column (Phenomenex, Macclesfield, Cheshire, UK) at 40°C using either a binary or ternary gradient maintained at 1 ml/min by a Waters Alliance 2795 HT LC system.
For 1′-hydroxymidazolam/fluconazole/ketoconazole, an initial mobile phase of 90% 0.001 M ammonium acetate/10% acetonitrile was ramped immediately to 29% 0.001 M ammonium acetate/42% acetonitrile/29% formic acid at 1 min and immediately to 34% 0.001 M ammonium acetate/66% acetonitrile at 4 min. The initial ratio was immediately reestablished at 5 min and maintained to 6 min. For 1′-hydroxymidazolam/itraconazole, an initial mobile phase of 90% 0.001 M ammonium acetate/10% acetonitrile was ramped linearly to 10% 0.001 M ammonium acetate/90% acetonitrile between 1 and 5 min and maintained for 1 min. The initial ratio was immediately reestablished at 6 min and maintained to 7 min.
For 3-hydroxyquinidine/fluconazole/ketoconazole, an initial mobile phase of 90% 0.001 M ammonium acetate/10% acetonitrile was ramped linearly to 90% 0.01 M formic acid/10% acetonitrile between 1 and 4 min. The initial ratio was immediately reestablished at 4 min and maintained to 5 min. For 3-hydroxyquinidine/itraconazole, an initial mobile phase of 90% 0.001 M ammonium acetate/10% acetonitrile was ramped linearly to 58% 0.01 M formic acid/42% acetonitrile between 1 and 3 min and immediately to 10% 0.01 M formic acid/90% acetonitrile at 3 min. The initial ratio was immediately reestablished at 4 min and maintained to 5 min.
For oxidized nifedipine/fluconazole/ketoconazole/itraconazole, an initial mobile phase of 74% 0.01 M formic acid/26% acetonitrile was ramped linearly to 10% 0.01 M formic acid/90% acetonitrile between 1 and 3 min and maintained to 4 min. The initial ratio was immediately reestablished at 4 min and maintained to 5 min.
For 6β-hydroxytestosterone/fluconazole/ketoconazole, an initial mobile phase of 90% 0.01 M formic acid/10% acetonitrile was ramped linearly to 54% 0.01 M formic acid/46% acetonitrile between 1 and 3 min and immediately to 10% 0.01 M formic acid/90% acetonitrile at 3 min. The initial ratio was immediately reestablished at 4 min and maintained to 5 min. For 6β-hydroxytestosterone/itraconazole, an initial mobile phase of 90% 0.01 M formic acid/10% acetonitrile was ramped linearly to 10% 0.01 M formic acid/90% acetonitrile between 1 and 4 min. The initial ratio was immediately reestablished at 4 min and maintained to 5.5 min.
For fluconazole, ketoconazole, and itraconazole, an initial mobile phase of 90% 0.01 M formic acid/10% acetonitrile was ramped linearly to 10% 0.01 M formic acid/90% acetonitrile between 1 and 3 min and maintained to 4 min. The initial ratio was immediately reestablished at 4 min and maintained to 5 min.
The compounds were detected and quantified by atmospheric pressure electrospray ionization MS/MS using a Micromass Quattro Ultima triple quadrupole mass spectrometer. The LC column eluate was split, and one-fourth was delivered into the MS where the desolvation gas (nitrogen) flow rate was 600 l/h, the cone gas (nitrogen) flow rate was 100 or 300 l/h (6β-hydroxytestosterone only), and the source temperature was 125°C.
Using positive ion mode, protonated molecular ions were formed using a capillary energy of 3.5 kV and cone energies of 36 V (ketoconazole), 56 V (fluconazole), 60 V (prednisone and verapamil), 70 V (6β-hydroxytestosterone, 3-hydroxyquinidine, oxidized nifedipine, and alprazolam), 79 V (itraconazole), 80 V (1′-hydroxymidazolam), and 89 V (dextromethorphan). Product ions formed in argon at a pressure of 2 × 10⁻³ mbar and at collision energies of 10 eV (prednisone, m/z 359.35→341.0), 15 eV (6β-hydroxytestosterone, m/z 305.35→269.0), 17 eV (fluconazole, m/z 307.0→220.0), 20 eV (oxidized nifedipine, m/z 345.0→284.0), 23 eV (3-hydroxyquinidine, m/z 341.15→226.0), 25 eV (alprazolam, m/z 309.05→281.0), 30 eV (1′-hydroxymidazolam, m/z 342.05→203.0; ketoconazole, m/z 531.05→489.0; verapamil, m/z 455.2→165.0), and 40 eV (dextromethorphan, 272.1→170.8; itraconazole, m/z 705.0→392.0) were monitored as ion chromatograms which were integrated and quantified by quadratic regression analysis of standard curves using Micromass QuanLynx 3.5 software.
The accuracy of the method was assumed to be adequate as the concentrations were calculated from calibration standards prepared in the same way as the extracts (spike calibration). Values were accepted if the internal standard ratio was greater than a value equal to the calibration regression intercept plus approximately 10 times the estimated standard deviation of the intercept (lower limit of quantitation). Repeatability precision was considered adequate if duplicate sample values were within 10% of each other.
Analysis of Multisite Inhibition Data. The kinetic parameters were calculated from untransformed data by nonlinear least-squares regression using GraFit 5 (Erithacus Software, Horley, Surrey, UK). The changes in kinetic parameters observed in the presence of various modifiers were significance tested using analysis of variance. For all four sets of data, analysis was based on the application of simple one-site or multisite kinetic models. According to the kinetic properties of the substrate, variations of the generic two-site model (Galetin et al., 2002) were applied to rationalize the inhibition profiles obtained for midazolam, quinidine, and nifedipine. These two-site kinetic models accommodated alterations in binding affinity (δ) and catalytic efficiency upon effector binding (γ). In addition, in case of nifedipine interactions the two-site kinetic model incorporated the substrate inhibition phenomenon defined by the decrease in product formation (Kp) from SES by the factor β (<1). In contrast, the three-site kinetic model was applied for testosterone interactions as positive cooperative binding of testosterone molecules was unaffected by increasing inhibitor concentration, indicating that the inhibitor acts at a distinct effector site. The two- and three-site kinetic models applied and the corresponding equations with the interaction factors were defined in our previous publications (Galetin et al., 2003; Houston and Galetin, 2005). Goodness of fit was determined by visual inspection of the fits, comparison of statistical parameters (χ2 and Akaike information criterion values) between the models and a reduction in the standard errors of the parameter estimates.
DDI Prediction. In vivo studies used as a comparator have been selected from a database previously collated in our laboratory (Ito et al., 2004). In replicate studies (same dose of the inhibitor; Table 2), the weighted mean of the AUC ratios was obtained for further analysis. In all the studies AUC(0-∝) was used for this purpose, the only exception was the ketoconazole and itraconazole interaction with triazolam (Varhe et al., 1994) where the AUC at the last time point was used. Whenever available, the mean ± S.D. estimates of the AUCi/AUC ratio (Fig. 1) were estimated from the individual AUC values reported in vivo; otherwise the sd values were obtained using eq. 1, assuming the normal distribution of the data (Armitage et al., 2002):  where Y represents the mean AUC ratio; X1 and X2 are mean AUC values in the presence and absence of the inhibitor, respectively; and varX1 and varX2 represent their respective variances (var is sd2).
List of observed in vivo and predicted AUCi/AUC ratios for 26 drug interactions with azole inhibitors using midazolam, testosterone, quinidine, and nifedipine as probes
The success of AUCi/AUC ratio prediction for 26 reported CYP3A4 in vivo interactions applying either the Ki estimates for midazolam, testosterone, nifedipine, or quinidine was assessed. When the two-site model was used to obtain the Ki value (e.g., nifedipine), the corresponding two-site equation (eq. 2) was applied in the prediction. In addition to [I]/Ki ratio, this two-site model equation also incorporates changes in the catalytic efficacy (γ) and binding affinity (δ) in the presence of the inhibitor (see Appendix). When γ/δ = 1, the two-site prediction equation is reduced to the simple 1 + [I]/Ki relationship:  where I represents the in vivo inhibitor concentration (either [I]in, input plasma concentration or [I]av, average plasma concentration during the dosing interval; values taken from Ito et al., 2004), whereas Ki estimates are obtained applying the generic two-site model (Houston and Galetin, 2003). When one- or three-site models are applied for the analysis of in vitro data, DDI prediction equation involving the interaction factors is not necessary and the simple 1 + [I]/Ki relationship is adequate (see Appendix, eq. 12).
Range of the predicted AUC ratios was obtained by Monte Carlo simulations (Nestorov et al., 2002) applying [I]av/Ki,u (inhibitor concentrations taken from the in vivo database; Ito et al., 2004). Contribution of parallel pathways (i.e., other P450 enzymes or renal clearance) was assessed by incorporating the fmCYP3A4 values reported by H. S. Brown, K. Ito, A. Galetin, and J. B. Houston (manuscript submitted for publication), using the following equation (Rowland and Matin, 1973): 
The bias of DDI prediction was assessed from the geometric mean of the ratio of predicted and actual value (average-fold error, afe). The mean squared prediction error (mse) (difference between the predicted and observed in vivo value) and the root mean squared prediction error (rmse) provided a measure of precision for the prediction of 26 in vivo DDI using midazolam, testosterone, nifedipine, and quinidine (Sheiner and Beal, 1981; Obach et al., 1997): 

 Of the three itraconazole metabolites reported by Isoherranen et al. (2004) (hydroxy-, keto- and N-desalkyl-itraconazole), only the contribution of hydroxy-itraconazole was included in the prediction. The contribution of the active metabolite (hydroxy-itraconazole) was incorporated as [1 + [I]av/Ki,u)itraconazole + ([I]av/Ki,u)hydroxy-itraconazole], where I and Ki values for the metabolite are literature values (Ito et al., 2004). Microsomal binding was assumed to be the same for the metabolite as determined for the parent.
Results
Ki Estimation for Azole Inhibitors. The inhibitory potency rank order (ketoconazole > itraconazole > fluconazole) was the same for each of the four substrates. Overall, the most potent inhibition was observed when midazolam and quinidine were used as probes, whereas Ki values for nifedipine were 7- to 13-fold higher than values obtained for other CYP3A4 substrates (Table 1). A similar trend in Ki values (midazolam generating the lowest Ki) was observed with a wider range of inhibitors (nifedipine, felodipine, verapamil, diltiazem, and saquinavir; data not shown).
Ki (micromolar) estimates for ketoconazole, itraconazole, and fluconazole obtained in human liver pooled microsomes using midazolam, testosterone, quinidine, and nifedipine as probes Ki values for ketoconazole and itraconazole were corrected for the microsomal fraction unbound (0.71 and 0.056, respectively) at the protein concentration used in the study (0.25 mg/ml).
In all substrate incubations, ketoconazole and itraconazole concentrations were depleted less than 20% over the incubation times applied, whereas no depletion was observed for fluconazole. The trend observed was constant across the substrate concentration range investigated and was greatest at higher concentrations of the inhibitor; hence, no corrections in Ki estimates were incorporated. Corrections for microsomal binding were applied for ketoconazole and itraconazole Ki values, with microsomal fraction unbound values of 0.71 and 0.056, respectively, at the protein concentration used in the study (0.25 mg/ml), whereas no correction was made for fluconazole (microsomal fraction unbound 0.95).
Significance of Multisite Modeling Approach for Azole Interactions.Ki estimates for midazolam, quinidine, testosterone, and nifedipine were obtained using both single site (competitive or noncompetitive) and multisite inhibition models (either two- or three-site) (Galetin et al., 2002).
For interactions with midazolam and quinidine (Fig. 3, A and B, respectively) noncompetitive and competitive inhibition models, respectively, gave comparable Ki estimates to the generic two-site kinetic model (e.g., ketoconazole-midazolam, 0.06 and 0.07 μM, respectively). In addition, the two-site kinetic analysis of these interactions generated γ/δ ratio values close to 1 (0.9–1.1).
For testosterone, all azoles caused changes in the rate of product formation rather than the binding affinity and did not alter the cooperative binding of testosterone molecules (Fig. 3C). The three-site model applied for the analysis of the multisite inhibition interactions with azoles was the same as described previously for the effect of progesterone and quinidine on this CYP3A4 substrate (Galetin et al., 2002). However, the binding affinity of azoles inhibitors was significantly higher (Houston and Galetin, 2005), and the nonproductive complexes (SEI and SESI) are formed at lower concentrations of the modifier in contrast to quinidine and progesterone. One-site inhibition models provided a poor fit that showed no agreement with the data observed, particularly at low substrate concentrations, where positive cooperative behavior was evident.
Nifedipine is a prototypical substrate reported to show negative homotropy; therefore, a two-site kinetic model with substrate inhibition was applied for the analysis of its interaction data (Galetin et al., 2003). A 3-fold range in the γ/δ ratio was observed for the three azoles (Fig. 2), mainly as a result of their effect on the rate of product formation (γ), because similar changes in the binding affinity (defined by δ = 0.11–0.14) were observed. In contrast to midazolam and quinidine, a noncompetitive inhibition model was not adequate, resulting in a significant difference in Ki values obtained (3- to 12.4-fold). Figure 3D illustrates the relationship between Ki, dissociation constant (Ks), and the interaction factors defining product formation from SES and ISE (βKp and γKp, respectively) on the maintenance of negative cooperativity in the presence of the modifier. In cases when γ is comparable to β and Ki < Ks (up to 10-fold, e.g., itraconazole; Fig. 3D) or Ki > Ks (e.g., fluconazole-nifedipine; data not shown), substrate inhibition is maintained at low concentrations of the modifier. However, if Ki << Ks (e.g., 50- to 100-fold), the complex with the modifier (ISE) is rapidly formed, and no substrate inhibition is noted even at very low inhibitor concentrations (example not shown).
Assessment of DDI Potential. The AUC increase in the presence of ketoconazole ranged from 1.2 for tacrolimus to 24-fold for nisoldipine (Table 2). In vivo, the effect of itraconazole showed a 19-fold difference among 12 studies, whereas a 2.7-fold range was observed for fluconazole (six studies). The utility of each of the four CYP3A4 probes for predicting drug-drug interactions via the AUC ratio was investigated using 26 selected CYP3A4 in vivo interactions. The AUC ratios were predicted by Monte Carlo simulations applying [I]av/Ki,u (Houston and Galetin, 2005), and the mean values obtained are presented in Table 2. For each correlation set (Fig. 4, A–D), the Ki values for only one substrate were used, i.e., midazolam testosterone, nifedipine, and quinidine, respectively. The fmCYP3A4 values for the corresponding substrates involved in the in vivo interaction were used (H. S. Brown, K. Ito, A. Galetin, and J. B. Houston, manuscript submitted for publication) and are listed in Table 2.
Evaluation of Midazolam as a Probe. Of the 26 interactions investigated, 77% of AUCi/AUC ratios predicted from Ki estimates using midazolam as a probe were within the 2-fold range of the in vivo value (Fig. 4A). Midazolam successfully predicted the interactions with all benzodiazepines, in contrast to testosterone, where 71% of the interactions were within 2-fold (Fig. 5). Incorporation of the fmCYP3A4 values for quinidine, alprazolam, and cerivastatin (0.76, 0.8, and 0.37, respectively) reduced the overprediction of the interactions with these substrates by 2.6-, 3.8-, and 5.2-fold, respectively, whereas the impact of such information was of less significance for other substrates (fmCYP3A4 range, 0.9–0.99).

Lack of association between the Ki and γ/δ ratio obtained for the interaction of nifedipine with azole inhibitors.
Evaluation of Testosterone as a Probe. Testosterone Ki values predicted interactions with cyclosporine within 2-fold of in vivo value, whereas other probes overestimated the degree of interaction with cyclosporine up to 4-fold. In contrast to midazolam, testosterone underpredicted 29% of reported studies with benzodiazepines. These findings were consistent with substrate substitution within the same CYP3A4 substrate subgroup (Houston and Galetin, 2005). Of 26 interactions investigated, 69% of AUC ratios predicted were within a 2-fold range of the in vivo value, whereas underprediction was observed in six of 26 studies (Fig. 4B). The extent of overprediction was reduced 5- to 12-fold for alprazolam and cerivastatin, respectively when the contribution of the renal clearance and metabolism via CYP2C8, respectively, were included in the prediction.
Evaluation of Quinidine and Nifedipine as Probes. AUC ratios predicted using quinidine Ki values were comparable with midazolam predictions because 81% of the estimates were within 2-fold of the observed in vivo value. Use of quinidine provided low bias and the highest precision of the DDI prediction (rmse 4- to 10-fold lower compared with the other three substrates). Among the probe substrates assessed, only quinidine estimated the degree of interaction between ketoconazole and tacrolimus accurately (5.4- to 13-fold overestimation using testosterone and nifedipine Ki values, respectively). Predicted AUCi/AUC ratios from quinidine in vitro data (Table 2) showed a statistically significant correlation (Pearson correlation coefficient of 0.98; p < 0.05) with both midazolam and nifedipine, whereas no such relationship could be established with other pairs of probes (Pearson correlation coefficient <0.6; p > 0.1).
Success in prediction using nifedipine Ki values was comparable with testosterone (69% of mean AUC ratios predicted within the 2-fold range), with underprediction observed in six of 26 studies (maximum of 5-fold in itraconazole-lovastatin). The two-site prediction approach reduced the average-fold error by half and improved the precision of the DDI assessment (rmse reduced by 80%) in comparison with noncompetitive inhibition model-derived Ki values.
Discussion
Prediction of a potential DDI with CYP3A4 is challenging due to a number of in vitro and in vivo factors. Complexity of the in vitro kinetics observed for some of the CYP3A4 probes (Tang and Stearns, 2001; Houston et al., 2003), CYP3A interindividual variability in the abundance and activity in both liver and small intestine (with the variable contribution of polymorphically expressed CYP3A5) (Lin et al., 2002; Xie et al., 2004), and overlapping substrate specificity with P-glycoprotein (Zhang and Benet, 2001) confound the straight-forward prediction of a DDI.

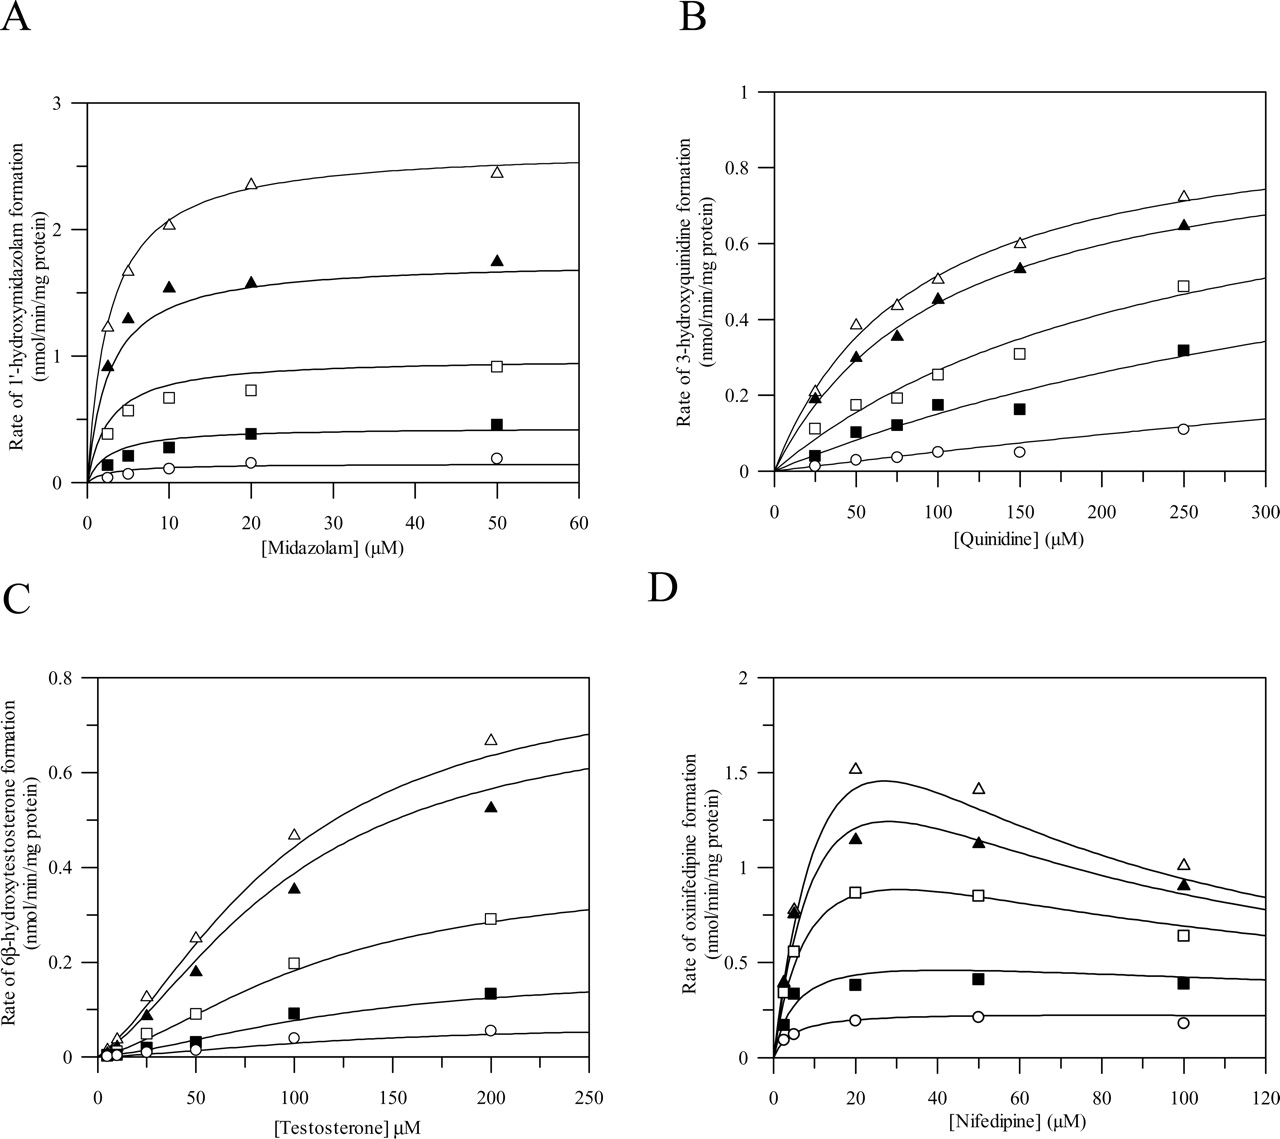
Effect of increasing concentrations of azoles on the metabolism of midazolam (A), quinidine (B), testosterone (C), and nifedipine (D) in human liver microsomes. Midazolam (2.5–50 μM; A), quinidine (25–250 μM; B), testosterone (5–200 μM; C), and nifedipine (2.5–100 μM; D). Data points represent the mean of duplicate determinations. The lines represent the simultaneous fit to the corresponding models defined under Materials and Methods at ketoconazole concentrations of 0, 0.03, 0.1, 0.3, and 1 μM (for midazolam and quinidine) or itraconazole concentrations of 0, 0.03, 0.3, 1, and 3 μM (testosterone) and 0, 0.1, 0.3, 1, and 3 μM (nifedipine).
A mechanistic approach to the analysis of in vitro homo- and heterotropic cooperative phenomena has indicated that the inclusion of CYP3A4 kinetic complexities (applying the interaction factor γ/δ ratio) into the DDI prediction strategy can provide an explanation for certain false negative and reduce the overestimation of true positive interactions (e.g., 28-fold for ketoconazole-triazolam interaction when Ki was obtained using triazolam as a probe) (Houston and Galetin, 2003). A limitation of this approach lies in its complexity and the number of data points required for full characterization of the phenomenon observed. Therefore, we have explored the significance of multisite kinetic modeling for reliable in vitro-in vivo prediction of a range of reported in vivo interactions with azole inhibitors. For that reason, four different CYP3A4 probes, midazolam, testosterone, quinidine and nifedipine, were assessed both from the prospect of their in vitro complexities and possibility of substrate substitution in prediction of DDI potential.
Considering that testosterone and midazolam are the most widely used in vitro measures of CYP3A4 activity (Yuan et al., 2002), it is important to know the extent to which the Ki values obtained for these probes may be extrapolated to clinically used drugs (substrate substitution approach). Therefore, the success of a DDI prediction, applying Ki values obtained for midazolam, testosterone, nifedipine, and quinidine, was explored using 26 reported in vivo interactions with a range of AUCi/AUC ratios from 1.2 to 24 (Table 2). The predicted increase in the AUC values in the presence of the azole inhibitors was obtained by Monte Carlo simulations applying the [I]av/Ki,u approach because this was found to be the best predictor when corresponding inhibitor-substrate pairs were investigated both in vitro and in vivo (Houston and Galetin, 2005). This was in contrast to the previous database analysis (Ito et al., 2004) where the maximum hepatic input concentration was the best surrogate for [I] for categorizing P450 inhibitors and for identifying true negative drug-drug interactions. Quinidine was assessed as an alternative and more pragmatic substrate due to its hyperbolic in vitro kinetic properties and specificity toward CYP3A4 in comparison with CYP3A5 (Galetin et al., 2004).
The probes investigated differ in their in vitro complexities, from standard hyperbolic kinetics (midazolam and quinidine) to positive (testosterone) and negative cooperativity (nifedipine) (Galetin et al., 2003). In addition to in vitro differences, the substrates selected vary in their in vivo characteristics that may impact the prediction of CYP3A4 DDI, e.g., significance of intestinal metabolism (Paine et al., 1997), involvement of P-glycoprotein (minimal in case of midazolam, in contrast to other substrates; Tolle-Sander et al., 2003), and contribution of CYP3A5 to the overall clearance (Lin et al., 2002; Huang et al., 2004).
The complexity of the inhibition models and prediction equation applied in the current study was highly dependent on the kinetic properties of the probe used. For midazolam and quinidine (simple hyperbolic kinetics), comparable Ki estimates were obtained by both one-site and generic two-site models, and the value of the relative γ/δ ratio close to 1 (0.9–1.1) indicated the reliability of simple inhibition models for the in vitro-in vivo prediction. In contrast, the application of simple inhibition models for interactions involving substrates with positive (testosterone) or negative (nifedipine) homotropic kinetic properties is problematic and may lead to inaccurate estimation of kinetic parameters and potential DDI. However, despite complex initial kinetic analysis, a prediction equation involving the interaction factor γ/δ ratio is not necessary for cases when testosterone sigmoidicity is maintained in the presence of the inhibitor (e.g., azoles) and the simple 1 + [I]/Ki relationship is appropriate. However, this approach is not satisfactory for nifedipine and substrates showing substrate and cooperative inhibition (γ/δ ≠ 1).
The prediction equations applied are based on the assumptions of the “well stirred” liver model and linear pharmacokinetics of the drug. The possibility of an interaction in the gut wall and changes in the inhibitor concentrations with the time are not incorporated and represent a limitation of this approach (Rostami-Hodjegan and Tucker, 2004). Contrary to expectation, all four CYP3A4 probes investigated predicted 69 to 81% of the interactions with azoles within 2-fold of the mean in vivo value (average-fold error ranged from 0.86 to 1.09). However, it must be stressed that the success of the prediction is dependent upon detailed information, including critical reassessment of the available in vivo information, complex multisite in vitro analysis (where necessary), and incorporation of substrate-related information on parallel elimination pathways. The contribution of other P450 enzyme (cerivastatin) or renal excretion (alprazolam and quinidine) reduced significantly the extent of DDI overprediction (5- to 12-fold), depending on the in vitro probe used. The inhibition of the renal clearance in addition to the hepatic interaction (e.g., quinidine by itraconazole; Kaukonen et al., 1997) was not included, because the fraction excreted unchanged was considered to be too low (0.3) to significantly contribute to the observed interaction. Furthermore, the majority of the studies selected (81%) was in the range of moderate to potent inhibition interactions (Fig. 1), whereas the cases of weak inhibition generally represent a problematic prediction issue (Tucker et al., 2001).
As expected, midazolam Ki values predict changes in the AUC ratio within 2-fold of in vivo values for all the interactions with benzodiazepines, consistent with the validity of substrate substitution within the same substrate subgroup (Houston and Galetin, 2003). In an analogous way, testosterone Ki gave better prediction of cyclosporine and simvastatin interactions, whereas interactions of benzodiazepines or nisoldipine were underpredicted (up 3.7-fold). A higher percentage of underprediction was observed when the interaction potential was assessed by testosterone and nifedipine, whereas midazolam and quinidine had an equal number of under- and overestimates (Fig. 4, A–D). Regardless of the probes investigated, the interaction with tacrolimus and in most cases, atorvastatin, was overestimated, and lovastatin and simvastatin interactions were generally poorly predicted (Table 2; Fig. 5). The bias (average-fold error) observed in the predictions was not significantly different across all four CYP3A4 probes (0.86–1.08), whereas the precision (rmse) of the predictions using testosterone and nifedipine was lower in comparison with quinidine and midazolam.

Comparison of mean AUCi/AUC ratios predicted by Monte Carlo simulations applying [I]av/Ki,u using Ki values for midazolam (A), testosterone (B), quinidine (C), and nifedipine (D) and AUC ratios observed in vivo for 26 DDI where ▪ represents ketoconazole (eight), ▵ itraconazole (12), and • fluconazole (six). The solid line represents line of unity, whereas dashed lines represent the 2-fold limit in prediction accuracy.
A number of recent studies indicate that the clinical significance of the contribution of polymorphically expressed CYP3A5 to the overall clearance is controversial and substrate-dependent (Floyd et al., 2003; Haufroid et al., 2004; Wong et al., 2004). In contrast to the comparable activity and kinetics observed between CYP3A4 and CYP3A5 (Williams et al., 2002; Galetin et al., 2004), this enzyme shows differential and generally less potent inhibition in comparison with CYP3A4 (Gibbs et al., 1999), indicating lower susceptibility to drug interactions even in population groups with higher frequency of more active CYP3A5*1 alleles (e.g., African-American). However, variable abundance and activity of CYP3A5 in both liver and intestine (Lin et al., 2002) result in the inconsistent CYP3A5 covariation with CYP3A4 and may contribute to the variability observed in the degree of interaction. In addition to CYP3A5, the ability of both ketoconazole and itraconazole to inhibit P-glycoprotein indicates that the functional link between CYP3A4 and this transporter (in the intestine, liver, or kidney) may have an impact on the degree of the interaction observed for certain CYP3A substrates (Kaukonen et al., 1997; Benet et al., 2004; Karyekar et al., 2004).
In conclusion, midazolam and quinidine provided the best assessment of a range of selected CYP3A4 drug interactions. Both substrates display hyperbolic kinetics in vitro and this adds to their pragmatic appeal in the evaluation of potential DDI compared with nifedipine and testosterone. However, the current analysis has shown that the kinetic complexities of nifedipine and testosterone can be overcome by the appropriate mechanistic analysis. The success of the substrate substitution approach was highly dependent on the incorporation of additional inhibitor- (microsomal binding and depletion over incubation time) and substrate-related (cooperativity, contribution of other metabolic pathways, or renal excretion) information. The current and previous mechanistic kinetic studies (Galetin et al., 2003) support the validity of appropriate substrate substitution and also indicate how in vitro kinetic characteristics can confound the DDI assessment. The general applicability of these findings requires further evaluation with a wider range of inhibitors.

Evaluation of substrate substitution in the prediction of 26 observed CYP3A4 drug interactions using midazolam, testosterone, quinidine, and nifedipine as in vitro probes. Interaction studies are divided into groups—benzodiazepines, cyclosporine and tacrolimus, nifedipine and felodipine, and statins.
Appendix
In Vitro-in Vivo Relationship for Substrates Showing Negative Homotropic Behavior (e.g., Nifedipine) and Cooperative Inhibition. In the case of substrate inhibition, the decrease in the rate of product formation (Kp) from a two-substrate bound complex is described by the interaction factor β < 1. The kinetic model defined by eq. 7 incorporates sequeantial binding of substrate molecules; i.e., the “substrate inhibition site” cannot be occupied until the active site is filled and the second site may be independent from the active site (Houston et al., 2003). The final form of the equation is obtained after multiplying both the numerator and denominator by Ks: 
The alterations in the product formation due to the presence of an inhibitor molecule at the active site are defined by the interaction factor γ. When substrate inhibition phenomenon remains, the effect of a modifier is analogous to the binding of a second substrate molecule, and γ is comparable to β. At high concentrations of substrate and inhibitor, the profile changes to a hyperbolic curve due to dominance of the nonproductive S(EI) complex (Galetin et al., 2003). The following equation has been rearranged multiplying the initial equation by Ks, analogous to the case with no inhibitor. 
Similar to single-site models, rapid equilibrium and steady-state principles have been used to assess the importance of cooperativity and predict changes in the in vivo plasma concentration-time profile from CYP3A4 in vitro data. The first order kinetics ([S] << Ks) assumption allows the simplification of the ratio of eqs. 7 and 8 and derivation of the two-site prediction equation in a form presented in eq. 9: 
In addition to [I]/Ki ratio, this prediction equation incorporates changes in the catalytic efficacy (γ) and binding affinity (δ) in the presence of the inhibitor. When γ/δ = 1, the two-site prediction equation (eq. 9) is reduced to the simple relationship 1 + [I]/Ki.
In Vitro-in Vivo Relationship for Substrates Showing Positive Homotropic Behavior (e.g., Testosterone). Autoactivation is defined by the following two-site kinetic model (Houston et al., 2003), assuming that β = 2 (Vmax is equivalent to 2Kp[E]t, where [E]t is the total enzyme concentration; Segel, 1975), where α < 1 defines the change in the dissociation constant Ks: 
In the presence of increasing concentrations of the modifier, the interaction between two substrate molecules, and the sigmoidal properties of the substrate, are unaffected, suggesting that the inhibitor acts at a distinct effector site. Inhibition is not consistent with a competitive type, because the modifier causes changes in Vmax, rather than changes in the substrate binding constant Ks (eq. 11). Similar to the equations described under A, the final form of eqs. 10 and 11 has been obtained by multiplying numerator and denominator by Ks: 
The AUCi/AUC prediction equation is derived as a ratio of eqs. 10 and 11 and under the same first order kinetics assumptions as for negative homotropic behavior. Due to the nature of the interaction (sigmoidicity is maintained in the presence of the inhibitor), DDI prediction equation involving the interaction factors (eq. 9) is not necessary and the simple 1 + [I]/Ki relationship is appropriate (eq. 12): 
Acknowledgments
We thank Drs. Ivelina Gueorguieva and Kayode Ogungbenro for contribution on Monte Carlo simulations and variance estimates for the in vivo studies and Caroline Brown for help in testosterone experimental work.
Footnotes
-
Financial support for this project was provided by the following Centre for Applied Pharmacokinetic Research Consortium members: Bristol Myers-Squibb Co., Eli Lilly & Co., GlaxoSmithKline, Novartis, Pfizer Central Research, F. Hoffmann-La Roche, and Servier.
-
Article, publication date, and citation information can be found at http://jpet.aspetjournals.org.
-
doi:10.1124/jpet.104.082826.
-
ABBREVIATIONS: DDI, drug-drug interaction(s); AUC, area under the curve; AUCi, area under the curve in the presence of the inhibitor; P450, cytochrome P450; LC, liquid chromatography; MS, mass spectometry; MS/MS, tandem mass spectrometry; S, substrate; I, inhibitor; SEI, ISE, SES, SESI, inhibitor and substrate or two-substrate bound complexes with an enzyme.
- Received December 23, 2004.
- Accepted March 18, 2005.
- The American Society for Pharmacology and Experimental Therapeutics


