


Abstract
Intestinal transcellular permeability (Pm), measured across cell lines such as Caco-2 cells in vitro, is often used for assessing oral drug absorption potential in humans. However, the quantitative link between in vitro permeability and apparent in vivo absorption kinetics, based on drug appearance in plasma, is poorly understood. In the current study, a novel absorption-disposition kinetic model that links traditional pharmacokinetic and mass transfer models was developed. Analytical solutions of ka and Fa were deduced, and using Caco-2 permeability, Fa in humans was predicted for 51 structurally diverse compounds. Predicted Fa values were similar to and correlated highly with their corresponding experimental values with an average error of 1.88 ± 1.06% (-17 to 22%) and r2 = 0.934. Simulated concentration profiles for 17 of 18 drugs corresponded to observed plasma concentration profiles in healthy volunteers. The equilibrium solution for ka (ka,eq) was found to be a key determinant of Fa, whereas under sink conditions, ka is likely to be a determinant of plasma concentration kinetics. The current version of the model offers a quantitative approach for predicting human oral absorption kinetics from in vitro permeability. It also establishes, for the first time, a quantitative link between Pm and ka and between ka,eq and Fa. This will facilitate better in vitro or in situ-in vivo correlations since it establishes a basis for incorporating permeability coefficients from the various experimental formats based on drug loss or appearance that are commonly used in the laboratory for permeability determination.
Oral administration is the most commonly used drug-dosing route. Therefore, the ability to predict the rate and extent of absorption of drug candidates after oral administration is crucial during the preclinical phase of development. Such knowledge complements high throughput drug screening and allows scientists to select the best drug candidates early in the drug development cycle. Drug absorption from the gastrointestinal (GI) tract is affected by many factors. Besides the physiological conditions of the GI tract (e.g., absorptive surface area, local pH, food effects, intestinal transit time, and passive intestinal permeability) and chemical properties of the drug (e.g., solubility, molecular size, and stability), intestinal transporters and enzymes are being increasingly implicated in controlling oral drug absorption (Martinez and Amidon, 2002). Because of this, the challenging task of quantitatively predicting oral drug absorption properties has attracted the attention of many scientists.
So far, most predictive models have been developed based on intestinal transport mechanisms and physiological parameters or statistical/probabilistic analysis. Typically, the statistical models have been built using regression results from a training set (e.g., Zhao et al., 2001), and correlation results are then used to predict Fa for compounds outside of this training set. These models rely heavily on the selection of training set compounds and, consequently, could have limited predictive ability for compounds that are outside of the training set (i.e., out of the box). The transport/mechanistic models, such as the mass balance (Sinko et al., 1991, 1993), mixing tank (Dressman et al., 1984), and compartmental absorption and transit (CAT; Yu and Amidon, 1999) models, quantify Fa and kd (the first-order disappearance rate constant in the intestine, also referred as intrinsic ka) from in situ permeability measured in a single-pass intestinal perfusion system. Based on drug disappearance kinetics from the intestinal lumen, the analytical solutions of Fa and kd were deduced from these models. Some of these models, such as the CAT model (Yu and Amidon, 1999), use kd plus drug-specific disposition parameters to estimate drug absorption kinetics in plasma. Fa and ka (the absorption rate constant in plasma) were determined from the disappearance kinetics of a drug in the intestinal lumen rather than from the appearance kinetics in plasma. These models assume that kd is equal to ka. Under this assumption, the prediction of ka and Fa is accurate when ka is similar to kd or erroneous when ka and kd are significantly different. Increasingly, the physiological processes of intestinal cycling, enterohepatic cycling, and tissue accumulation of drugs are being implicated in absorption kinetics. This means that for many drugs ka and kd might not be equal. For instance, we have observed that the kd and ka of saquinavir were nearly 9-fold different in rat small intestine following a single-pass perfusion due to significant tissue retention (∼5% of perfused drug amount found in tissue, whereas ∼0.1% was recovered in the blood) (unpublished data). This has mechanistic implications since some experimental methods used to determine permeability are based on drug loss from the intestinal lumen (e.g., single-pass intestinal perfusion), whereas others are based on drug appearance (e.g., cultured cells in the Transwell format). Other experimental factors such as anesthesia may lead to a discrepancy between the measurement of permeability by loss or by appearance since blood flow and drug clearance is altered. For all of these reasons, there is a compelling need to update predictive oral absorption models so that the mechanistic link between permeability across the intestinal mucosa and in vivo absorption can be adequately reflected.
Pharmacokinetic (PK) models have been built based on drug disposition properties in the plasma compartment(s). Although extravascular PK models describe drug plasma concentration profiles well for orally administered drugs, these models are disconnected from drug kinetics at the absorption site. Even in the most sophisticated extravascular models (e.g., Wagner, 1993), drug kinetics in the intestinal lumen were treated as a black box. Because of this, ka could only be determined from kel (elimination rate constant) by using a deconvolution method (Wagner, 1975), and Fa could not be quantitatively determined.
Caco-2 cell permeability is often used as a screening tool for assessing drug oral absorption during the early stages of drug development. Despite some differences in transporter gene expression (Sun et al., 2002), Caco-2 cells possess many structural and functional similarities to normal human enterocytes, and Caco-2 permeability has generally correlated well with Fa for many drugs in humans (Yee, 1997). Hence, many scientists use Caco-2 permeability as a surrogate for human intestinal permeability. We have chosen this permeability determination format for the first application of this model since it is one of the most common formats used in laboratories today.
In this article, a novel absorption-disposition kinetic model that links the processes of gastric emptying, intestinal absorption, and plasma disposition was developed. Using this model, ka, ka,eq, and Fa were deduced from plasma kinetics. The absorption parameters in humans were predicted from Caco-2 permeability for 51 structurally diverse pharmaceutical compounds. From the predicted Fa and plasma concentrations in humans, the predictive ability of the model was assessed.
Materials and Methods
The Definition of Bioavailability and Its Related Terms. Oral bioavailability (Foral) is defined as the extent of intact drug appearing in blood. Foral is commonly reported in the literature by comparing the amount of drug in blood after oral administration with that after intravenous administration (i.e., absolute oral bio-availability). Fa is the fraction of drug taken up into the intestinal tissue by any mechanistic pathway (e.g., paracellular or transcellular). Fgw is the fraction of drug that survives intestinal metabolism and enters the portal vein. FH is the fraction of drug that escapes hepatic metabolism and enters the hepatic vein intact. FFP is the fraction of drug that escapes first-pass intestinal and hepatic metabolism (FFP = Fgw × FH).
Model Development. Gastric emptying and intestinal transit can be approximately described by first-order kinetics under fasted conditions (Davenport, 1982). Drug absorption and elimination also generally follow first-order kinetics (Rowland and Tozer, 1995). Therefore, the pharmacokinetics of an orally dosed drug can be described using a three-compartmental kinetic model (Fig. 1) with one compartment each representing the stomach, intestine, and plasma. The Ms, Mi, and Mpl represent the amounts of drug in the stomach, intestine, and the amount absorbed as reflected in the plasma, respectively, and ks, ki, ka, and kel are first-order rate constants of gastric emptying, intestinal transit, absorption, and elimination from plasma, respectively. This model assumes that drug dissolution is not a rate-limiting step in drug absorption; drug absorption from the stomach is negligible and the body is a homogenous compartment. The corresponding ordinary differential equations (ODE) for this system are: 


By solving the ODEs under the assumption that drug concentrations are below the solubility in the entire intestinal lumen and the initial conditions of Ms = Doral, Mi = 0, and Mpl = 0, the drug concentration in the plasma compartment over time (0, ∞) can be written as:  where Vd is the volume of distribution at steady-state, and


Absorption-disposition kinetic model. Ms, Mi, and Mpl represent drug amount in the stomach, small intestine, and plasma, respectively. ks, ki, ka, and kel represent the rate constants of gastric emptying, intestinal transit, absorption, and elimination, respectively.
Analytical Solution of ka.ka is the first-order absorption rate constant based on appearance of drug in the systemic circulation. Drug absorption into the systemic circulation (i.e., peripherally measured in plasma) in the absence of elimination can be described as: 
First-pass metabolism is not assumed to be negligible in this case. Assuming that drug loss in the small intestinal lumen is due to absorption only, then drug disappearance from the intestine reflects the amount of drug absorbed and can be described by first-order kinetics or by Fick's Law under sink conditions:  and
and  where kd is the disappearance rate constant, Pm is drug permeability across intestinal mucosa, and S is the absorptive surface area. By combining eqs. 10 and 11, kd can be expressed as below (similar to the function derived by Ho and Higuchi, 1974):
Because Mpl is the fraction of Mi due to the first-pass extraction (FFP = Fgw × FH), the relationship between Mi and Mpl can be expressed as follows. Also, from this point on, Mpl and Cpl are referred to as the unchanged amount of drug and drug concentration in the plasma. 
When combining eqs. 9, 11, and 13 and replacing Mpl with Cpl × Vc, ka is found to be:  where Vc is the volume of distribution in well perfused organs. Using Vc instead of Vd is based upon the concept that initial drug distribution is limited by blood perfusion (Rowland and Tozer, 1995). Therefore, during the absorption phase, a drug is more likely distributed in well perfused organs, such as heart, kidney, lung, spleen, liver, and muscles rather than to peripheral tissues such as bone, fat tissue, and skin.
Equation 14 reveals that ka has multiple analytical solutions, an equilibrium solution (ka,eq) when FFPCi/Cpl = 1, and nonequilibrium solutions (ka) when FFPCi/Cpl ≠ 1. The equilibrium solution is independent of drug concentration changes in the intestine and plasma, whereas the nonequilibrium solutions are dependent upon the concentration ratio that varies over time. Since ka is defined as a rate constant in this model, the equilibrium ka,eq was used in the following Fa derivation. 
The Analytical Solution of Fa. Plasma AUC can be calculated using a property of Laplace transformation as follows: 
Hence, from transformed ODEs of the absorption-disposition kinetic model,  and
and 
When eqs. 17 and 18 are combined, Foral becomes: 
Since Foral = Fa × FFP, Fa is: 
Computational Methods. Fifty-one pharmaceutical compounds were selected as test compounds to evaluate the model based on the availability of their permeability data in Caco-2 cells and reported Fa in humans in the literature. Fa values are typically estimated from Foral values. For example, Zhao and coworkers (Zhao et al., 2001) reported Fa values in humans depending on the degree of metabolism known to occur for any given drug. For drugs with minimal metabolism, Foral was considered as Fa. However, for drugs with significant first-pass metabolism (i.e., when Foral is less than Fa), they extrapolated Fa values from urinary and fecal excretion data. Specifically, Fa was estimated as percentage of dose excreted unchanged in the urine and as metabolites following i.v. and oral administration, percentage of metabolites in urine following oral and intravenous dosing, percentage of extraction of drug in bile after i.v. or oral dosing, percentage of accumulative excretion of drug in feces following i.v. or oral dosing, and total recovery of drug in urine and feces following oral and i.v. dosing. The drugs selected for this study cover a broad range of Foral in humans. Among the selected drugs, 9 drugs have Foral < 20%, 10 drugs have Foral ranging from 20 to 50%, 12 drugs have Foral ranging from 50 to 80%, and 20 compounds have Foral > 80% (Gilman et al., 1990). Since more than half of the drugs in this dataset are significantly metabolized on a first pass through the intestine and liver (Gilman et al., 1990), the drugs with Fa ranging from 20 to 50% is limited (i.e., only six drugs with Fa < 20% and eight drugs with Fa = 20–80%).
For the ka,eq computation, the absorptive surface area of human intestine (S) was set to 200 m2 (Snyder et al., 1975). Intestinal absorptive surface area is a dynamic parameter that depends on the method of measurement and the absorption properties of the drug. For example, a drug that is absorbed more slowly may have a higher net absorptive surface area since it will travel further down the villus compared with a drug that is absorbed more quickly. The effect of surface area in the present analysis is variable (i.e., not proportional) with the major impact on drugs that are more poorly absorbed. The Vc values were estimated using the following equation (Rowland and Tozer, 1995):  where n = 1, 2, 3, 4... for blood and well perfused organs, such as plasma, red blood cells, heart, kidney, lung, spleen, liver, and muscles. The Vpl and Vt were the plasma volume and tissue volumes, and Kpl:T was the plasma-tissue partition coefficient estimated following Poulin's method (Poulin et al., 2001) and based on reported octanol-water partition coefficients of the test compounds in the literature:
  where Kvo:w was vegetable oil-water partition coefficient; VnT, VphT, and VwT were the fractional contents of neutral lipids, phospholipids, and water in tissue, respectively; and Vnp, Vphp, and Vwp were the fractional contents of neutral lipids, phospholipids, and water in plasma, respectively. The volumes of well perfused tissues and Vn, Vph, and Vw in plasma and the tissues were obtained from the literature (Poulin and Theil, 2002) and are listed in Table 1. Kvo:w was converted from octanol-water partition coefficient (Leo et al., 1971). The average human body weight was assumed to be 70 kg.
The volumes and the fractional volume of well perfused organs in humans The data were taken from Poulin and Theil, 2002.
The ks value was set to 0.0315/min assuming that the gastric emptying half-life is one-third of gastric emptying, ∼65 min in man (Davenport, 1982). The ki value was set as 5.025 × 10⁻³ min-1 as the inverse value of the average transit time in human small intestine, ∼199 min (Yu et al., 2000).
Among the 51 test compounds, 18 drugs were selected for concentration simulations based on the availability of literature-reported plasma concentration-time profiles in healthy volunteers after a single oral administration under fasting conditions. The values of FFP and Vd in eq. 4 were determined as below:  and
and  where Cmax was the measured peak concentration after an oral dose. By combining eqs. 4 and 24, plasma concentration profiles were simulated using the following equation where kel was calculated from observed concentration data in humans:
Statistical Analysis. To examine the error associated with the model, a residual (predicted Fa - experimental Fa) plot, error distribution, and assessment of independence test were conducted. When the residuals were normally and independently distributed random effects, the model would be considered adequate, and the assumptions of the model were met. To examine whether the model was suitable in producing relevant Fa data, linear regression analysis of the predicted and experimental Fa was conducted.
Results
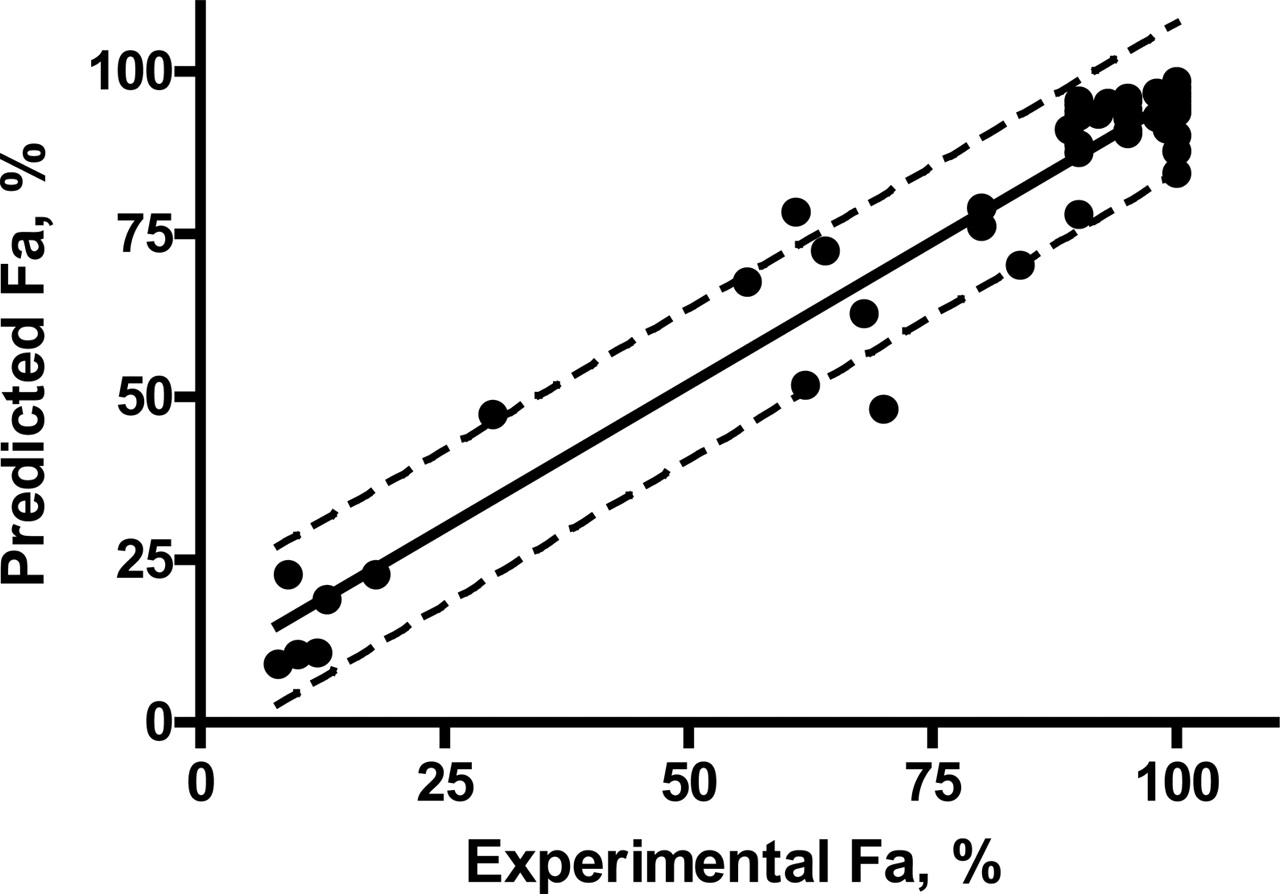
Prediction of ka and Fa. Predicted ka and Fa values from Caco-2 permeability are listed in Table 2. For most compounds, the predicted ka,eq values ranged from 0.1 to 0.005 min-1 with an average of 0.064 min-1 and were within the range of commonly observed values (∼0.01–0.07 min-1) in humans (Rowland and Tozer, 1995). However, for a few poorly absorbed drugs, such as chlorothiazide, doxorubicin, and saquinavir, the ka,eq values were ∼0.0005 min-1, much smaller than the observed values. Predicted Fa values were similar to the experimental values for both extensively and poorly absorbed drugs. The linear regression of predicted versus experimental Fa values (Fig. 2) were highly correlated (r2 = 0.934), and the predicted Fa values for 49 of 51 compounds fell within the 90% confidence intervals. The residuals between predicted and experimental Fa were found to be normally and independently distributed around 1.8 ± 1.1% with approximately equal variance and ranging from -17 to 22% (Fig. 3). The residual test results demonstrate that the model is adequate for prediction of Fa and that the assumptions of the model were met. The predicted Vc values were, in general, much smaller than reported steady-state distribution volumes (Gilman et al., 1990) and close to the physiological volume of well perfused tissues (∼32 liters), indicating that the Vc prediction was reasonable.
Predicted values of ka,eq, Fa, and Vc for the test compounds, and the comparison between experimental and predicted Fa
Concentration Simulation. The simulation parameters and results are presented in Table 3 and Fig. 4, respectively. For 17 of 18 compounds, the simulated kinetic profiles matched their corresponding experimental ones well, indicating that the model is suitable for describing the kinetics of drug absorption and disposition in humans. There was a paucity of data points in the absorptive phase of many of the plasma concentration versus time profiles used in this study. Although not ideal, the impact of this situation is less dramatic than one would expect since absorption occurs after the peak concentrations are observed (i.e., since each point on the curve reflects the rate of absorption and elimination of drug). Therefore, absorption is reflected through many of the time points on the curve. The simulated concentration-time profile for saquinavir was less successful than for the others. Although the predicted AUC of saquinavir, as visualized by the concentration curve, was close to the experimental value, the shapes of the predicted and observed profiles matched poorly. A close correlation between ka,eq and observed ka values generally led to simulated profiles that matched the clinical result. However, ka,eq (0.0005 min-1) for saquinavir was significantly different from the observed ka (∼0.1 min-1). These data indicate that ka,eq is a key determinant for Fa and can be used as an approximation for predicting plasma concentration profiles. The usefulness of ka under sink conditions in concentration simulation will be discussed in the next section.
Parameters that were used in the plasma concentration simulations, and the source of the experimental data
Discussion
A novel absorption-disposition kinetic model that links traditional pharmacokinetic and mass transport models was developed in the current study. ka, ka,eq, and Fa were deduced from plasma pharmacokinetics using this model, and the analytical relationships between Pm and ka and between ka,eq and Fa were found.
Among the 51 structurally diverse compounds used in the evaluation of the model, many are substrates for one or more intestinal drug transporters and some are involved in transcellular and/or paracellular passive diffusion as well. Regardless of the mechanisms of drug absorption from the GI tract, the model produced reasonable estimates of Fa from Caco-2 permeability. The statistical analysis and excellent correlation between experimental and predicted Fa values suggest that the assumptions of the model were met and that the model is adequate for predicting Fa. However, inconsistencies between in vitro and in vivo systems could cause deviations in the prediction of Fa. For example, although Caco-2 cells possess many similarities to enterocytes, their intercellular structures are much tighter than those of enterocytes. Hence, the permeability of paracellular transported drugs, such as cimetidine, atenolol, ranitidine, mannitol, hydrochlorothiazide, and furosemide, could be underestimated in Caco-2 cells (Collett et al., 1996; Hilgendorf et al., 2000). In this study, it was found that Caco-2 permeability results that had transepithelial electrical resistance values close to intestinal tissue allowed for better Fa prediction. The predicted Fa for methotrexate deviated the most from its experimental value (48 versus 70%). Methotrexate is reported to be actively cotransported with H+ in the small intestine (Sosogi et al., 2003). The underestimated Fa for methotrexate could be due to an underestimated Pm from an experimental system that lacked a physiological pH gradient, or it could be due to poor expression/function of the intestinal transporters involved in methotrexate transport.

Linear correlation between predicted Fa and experimental Fa. Pred. Fa = 0.884 (±0.034) * Exp. Fa + 7.41 (±2.87), r2 = 0.934, Sy = 6.86, F = 672, df = 49, SSreg = 3.25 × 10⁴, SSresid = 2.30 × 10³. Dotted lines represent 95% confidence interval.

Residuals between experimental Fa and predicted Fa.
In this study, ka was found to have equilibrium and nonequilibrium analytical solutions. It was observed that ka,eq was a good predictor of plasma concentration profiles for nearly all drugs except for saquinavir. This aberrant result can be explained by the equilibrium and nonequilibrium solutions of ka. From eq. 14, it is evident that ka is dependent on the ratio of Ci and Cpl. At equilibrium, drug absorption becomes insignificant due to the disappearance of the concentration gradient across the cell monolayer. Therefore, the equilibrium solution of ka is likely to be related to Fa. On the other hand, drug absorption initially occurs under sink conditions. Therefore, it is possible that, under sink conditions, ka governs the pharmacokinetic profile during the absorptive phase. Another possible reason for the unsuccessful simulation results of saquinavir in humans could be due to the simplified disposition model that was used. The current absorption-disposition model includes only one disposition compartment. Although the one-compartment disposition worked well for most compounds in the current study, it may result in an inaccurate prediction when a drug has a profile with a significant biphasic decline, such as saquinavir. When using the ka under sink conditions and with a modified absorption-disposition model (the original model plus a peripheral disposition compartment), we successfully predicted saquinavir plasma concentration profiles in rats (unpublished data). Our findings demonstrate that Pm is a major determinant of ka, ka,eq is a major determinant of Fa, and the absorption-disposition kinetic model is adequate for describing pharmacokinetic profiles in vivo.
The fundamental difference between the current model and many transport models (Dressman et al., 1984; Amidon et al., 1988; Sinko et al., 1991; Yu and Amidon, 1999) is that the prediction of ka and Fa is based on drug appearance kinetics in the plasma compartment rather than the drug disappearance kinetics from the intestinal lumen. In the current model, the absorption rate constant in plasma (ka) is predicted directly without assuming that the rate of drug appearance in plasma is equal to the drug disappearance rate from the intestinal lumen. This is important since the number of drugs that are known to undergo intestinal and enterohepatic cycling and intestinal accumulation is increasing. This, in turn, leads to a discrepancy in permeability measurements depending on the experimental format and conditions that are used. Although the analytical solution of kd from the previous transport models has a similar form (kd = PeffS/Vi) to that of ka (ka = PmS/Vc) in the current model, they are significantly different in meaning. For example, Peff (effective permeability) is determined from drug disappearance/uptake kinetics in the intestinal lumen, whereas Pm (transcellular permeability) is determined based on the amount of drug that penetrates a tissue barrier (e.g., Caco-2 cells) and appears on the basolateral side. Due to the possible retention of drug molecules that bind to intestinal contents, mucus, and in the intestinal tissue, Peff can also be overestimated. In addition, Vi and Vc can be significantly different. The physiological fluid volume of human intestine (Vi) is ∼375 ml (Davenport, 1982), which is much smaller than the physiological volumes of blood and well perfused organs or the volume of distribution in pharmacokinetic definition (Vc > 30 liters in general). These discrepancies can lead to differences in the ka and kd values. More importantly, since kd is measured under sink conditions, it is more likely to be similar to ka under sink conditions, but it can be much greater than ka,eq for some poorly absorbed drugs. Consequently, Fa estimates from kd [Fa = kd/(ki + kd)] (Dressman et al., 1984) are likely to be overestimated, which perhaps explains why many predictive models work well for highly absorbed drugs but work inaccurately for poorly absorbed drugs.
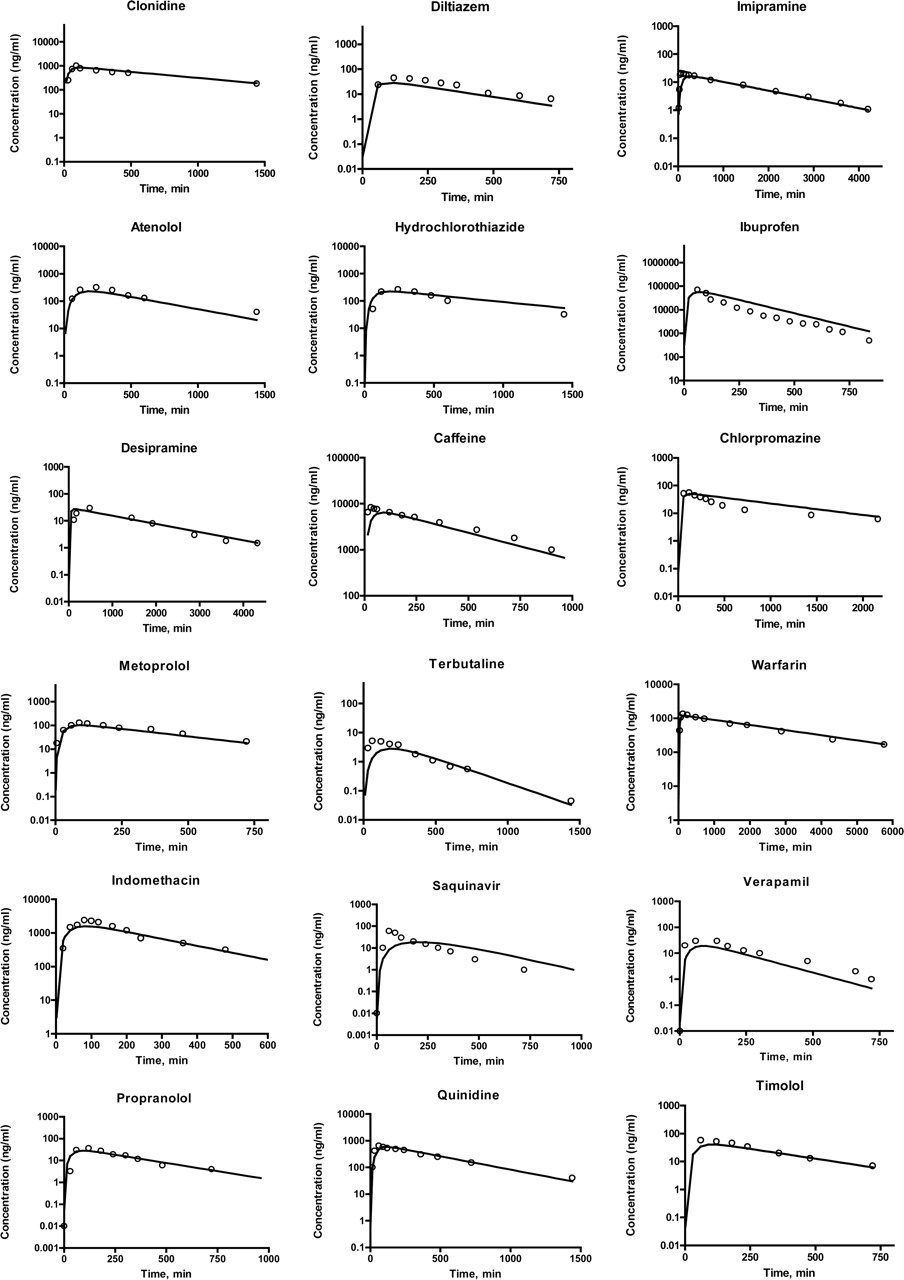
Plasma concentration-time profiles of selected drugs in humans following a single oral administration. Simulated with ka,eq, line and measured, dots.
Traditional pharmacokinetic models are based on drug appearance in the blood rather than drug disappearance from the intestinal lumen. The most commonly used oral pharmacokinetic model is a one-compartment extravascular model with ka as first-order input (absorption) rate constant and kel as the first-order output (elimination) rate constant (dMpl/dt = kaMi - kelMpl) (Wagner, 1993). The current model differs from traditional pharmacokinetic models in that it links the traditional model to the gastric and intestinal compartments so that the impact of drug kinetics at the absorption site is accounted for. Some of these transport models, such as the CAT model (Yu and Amidon, 1999), also link the intestinal compartments to one or two plasma compartments. However, because ka is estimated from kd, the linkage between intestinal compartments and plasma compartments is generally based on simulations rather than a mechanistic link. In contrast, the current model builds the link based on kinetic mechanisms not empirical or simulation approaches. One of the advantages of this model is that by adding these two GI compartments, the initial drug concentration in the intestinal lumen is no longer assumed as a bolus dose but is treated more closely to the in vivo situation after oral administration. The predictive performance of the current model reveals that two GI compartments are adequate for describing the pharmacokinetic profile in plasma. When the gastric emptying and intestinal transit time are modified by a specific drug delivery system, the resulting plasma concentration profiles can be easily predicted by this model. Another advantage is that by adding the GI compartments, FFP (the fraction that survives first-pass metabolism) becomes a determinant for plasma concentrations (eq. 4) rather than Foral as in traditional PK models. This is an advantage since Foral can only be determined by comparing intravenous and oral kinetics, whereas FFP can be directly determined from in vitro metabolism studies such as intestinal and hepatic microsomes.
Drug dissolution rate is considered to be a major determinant of oral drug absorption (Pade and Stavchansky, 1998; Lobenberg and Amidon, 2000). However, in the current study, drug dissolution was excluded from the prediction of Fa and ka with little impact on the oral absorption estimates. This is likely due to the fact that the dissolution rate of many pharmaceutical compounds is faster than drug permeability through the intestinal wall (Pade and Stavchansky, 1998). Therefore, drug absorption is, in general, controlled by permeability through the intestinal wall rather than by dissolution. When drug dissolution does become the rate-limiting step (i.e., slower than permeability), such as with controlled-release formulations, oral absorption will be controlled by drug dissolution and/or release rate. In this case, the drug dissolution/release rate should be used to replace drug permeability in the Fa and ka prediction.
The results of this study demonstrate that the current absorption-disposition kinetic model is suitable for describing pharmacokinetics after oral administration. The analytical solutions of ka allow for the prediction for Fa and oral kinetics from Caco-2 permeability data. It was found that ka,eq is a key determinant of Fa, whereas ka is likely to be a determinant of absorption kinetic profiles.
In conclusion, a novel absorption-disposition kinetic model that links traditional pharmacokinetic and transport models was developed. The analytical solutions between Pm and ka and between ka,eq and Fa were found for the first time. The prediction of Fa and plasma concentrations indicates that this model is adequate for quantitative determination of oral kinetics from in vitro permeability. This model also provides a basis for the correlation of in vitro permeability and in vivo absorption kinetics.
Footnotes
-
Article, publication date, and citation information can be found at http://jpet.aspetjournals.org.
-
doi:10.1124/jpet.104.076182.
-
ABBREVIATIONS: GI, gastrointestinal; CAT, compartmental absorption and transit; PK, pharmacokinetic; ODE, ordinary differential equations; AUC, area under the curve; pred., predicted; exp., experimental.
- Received August 13, 2004.
- Accepted April 13, 2005.
- The American Society for Pharmacology and Experimental Therapeutics


