


Abstract
Inflammatory agents such as lipopolysaccharide (LPS) down-regulate the hepatic expression of many cytochrome P450 (P450) mRNAs and proteins. Previous studies suggested that suppression of some P450 mRNAs could involve the regulation or modulation of the nuclear receptors peroxisome proliferator-activated receptor α (PPARα) or pregnane X receptor (PXR). To determine the involvement of these receptors in P450 down-regulation, PPARα knockout (KO), PXR KO, and appropriate wild-type (WT) mice were administered either saline or 1 mg/kg LPS. Hepatic mRNA and protein expression of several P450 isoforms, interleukin (IL)-1β, IL-6, tumor necrosis factor (TNF) α, α1-acid glycoprotein (AGP), and fibrinogen (FBG) were examined 16 h later. LPS administration significantly decreased the hepatic expression of CYP1A2, 2A5, 2C29, 2E1, 3A11, 4A10, and 4A14 mRNAs in both groups of PPARα and PXR mice, whereas CYP3A13 mRNA was increased slightly in PPARα WT and KO mice, but not in PXR mice. Effects of LPS administration on mouse hepatic P450 proteins (probed using rat P450 2C, 3A, 4A, and 2E antibodies) were consistent with mRNA results in most cases. LPS treatment significantly increased IL-1β, IL-6, TNFα, AGP, and FBG mRNA in both PPARα and PXR mice, with the greatest effect observed with TNFα. Because decreases in P450 mRNA expression were essentially identical in both WT and KO mice for both nuclear receptors, these data indicate that down-regulation of P450 during inflammation does not require the nuclear receptors PPARα and PXR.
Cytochromes P450 (P450) are drug-metabolizing enzymes that oxidize numerous endogenous and foreign compounds, including the majority of therapeutic agents, resulting in drug activation or inactivation. P450 gene expression is regulated by several factors, including gender, microsomal enzyme inducers, age, diet, and hormones. During inflammation and infection, both P450 expression and metabolic activities in liver and extrahepatic tissues can be down-regulated (for reviews, see Morgan, 2001; Renton, 2004); however, some P450 activities are induced or unchanged. As such, alterations in P450 expression and activities during inflammation can lead to increased or decreased drug efficacy or changes in the metabolism of physiological substrates.
Injection of bacterial lipopolysaccharide (LPS) is a widely used model of inflammation and is well characterized regarding its effects on basal and inducible hepatic P450 expression. A prominent feature of this inflammatory response is the cytokine-mediated induction of acute phase proteins. Type I acute phase proteins are induced by interleukin (IL)-1-like cytokines [IL-1α, IL-1β, tumor necrosis factor (TNF) α, and TNFβ) and include serum amyloid A and α1-acid glycoprotein (AGP). In contrast, type II acute phase proteins are induced by IL-6-like cytokines (such as IL-6 and oncostatin M) and include fibrinogen (FBG) and α1-antitrypsin (Moshage, 1997). In vitro and in vivo studies show decreased P450 mRNA and protein and induction of acute phase proteins after treatment of rodents or hepatocytes with LPS or the cytokines IL-1β, IL-6, and TNFα (Morgan, 1997, 2001; Renton, 2004). Due to the complexity of the inflammatory response, the in vivo contributions of individual cytokines are difficult to determine. Studies using cytokine- or cytokine receptor-null mice to investigate LPS-mediated P450 down-regulation have reported differential dependence of P450 down-regulation on cytokines, contingent on the P450 subfamily or model of inflammation being studied (Warren et al., 1999; Siewert et al., 2000; Ashino et al., 2004). As such, LPS-mediated P450 down-regulation is regulated through multiple pathways.
There is some evidence that hepatic P450 down-regulation during inflammation may be mediated by modulation of nuclear receptors. Drug-induced transcription of P450 is mediated by nuclear receptors, including the peroxisome proliferator-activated receptor α (PPARα, NR1C1) and the pregnane X receptor (PXR, NR1I2). Reductions in mRNA levels of PPARα, PXR, retinoid X receptor (RXR), and liver X receptor have been recently reported in liver and intestine of rodents treated with LPS (Beigneux et al., 2000; Kalitsky-Szirtes et al., 2004), and these findings have been associated with P450 down-regulation. A previous study from our laboratory found that LPS down-regulation of hepatic CYP2A5, 2C29, and 3A11 mRNAs was attenuated in PPARα knockout (KO) mice (Barclay et al., 1999). Moreover, Beigneux et al. (2002) associated a reduction in CYP3A and 2B10 mRNA with decreases in the expression of PXR, the constitutive androstane receptor, and RXRα after LPS treatment, with similar results found for PXR and CYP3A11 (Xu et al., 2004). A recent microarray investigation of nuclear receptors indicated down-regulation of PPARα, PXR, constitutive androstane receptor, RXRα, liver X receptor, and farnesoid X receptor after LPS treatment of Wistar rats (Fang et al., 2004). Most recently, Teng and Piquette-Miller (2005) studied the role of PXR in down-regulation of hepatic transporters and of CYP3A11 during LPS inflammation. They found that down-regulation of multidrug resistance-associated protein 2 was attenuated in PXR KO mice, suggesting a role for PXR in its down-regulation during inflammation. On the other hand, down-regulation of five other drug transporters and of CYP3A11 showed no evidence of a requirement for PXR in the LPS model. Together, these observations show down-regulation of nuclear receptors during LPS-induced inflammation and associate down-regulation of P450 with decreased receptor levels, as well as down-regulation of inducible P450. Although the correlation of down-regulation of nuclear receptors with P450 down-regulation may be suggestive of a mechanistic connection, receptor knockout models suggest a minimal role for nuclear receptors in the constitutive expression of P450 genes. We sought to definitively determine the involvement of the nuclear receptors PPARα and PXR in mediating down-regulation of several constitutive hepatic P450 isoforms during inflammation by comparing the responses in wild-type (WT) and knockout mice after LPS treatment. Possible effects of the genetic modifications on the overall inflammatory response of the liver were studied via the expression of proinflammatory cytokines (IL-1β, IL-6, and TNFα) and hepatic acute phase proteins (AGP and FBG).
Materials and Methods
Chemicals, Animals, and Treatments. Unless otherwise specified, all chemicals were obtained from Sigma-Aldrich (St. Louis, MO). Female PPARα wild-type (129S1/SvImJ) and PPARα knockout (129S4/SvJae-Pparatm1Gonz/J) mice (20 g) were obtained from The Jackson Laboratory (Bar Harbor, ME). PXR wild-type (C57BL/6N) mice (20 g) were obtained from Taconic Farms (Germantown, NY), and PXR knockout mice were generously provided by Dr. Bryan J. Goodwin (GlaxoSmithKline, Research Triangle Park, NC). All mice were 8 weeks of age at the time of experimentation. Animals were acclimatized to the animal facility for 1 week and were provided rodent chow and water ad libitum until 8 h before injection. Because LPS causes a reduction in food intake in mice (Kozak et al., 1994), which may itself modulate P450 expression, animals were fasted before and after injection to eliminate this variable. Escherichia coli LPS, serotype 0127:B8 (Sigma-Aldrich) was dissolved in sterile 0.9% saline, and mice were injected intraperitoneally with 1 mg/kg LPS or saline. We have previously demonstrated that this dose of LPS produces a maximal suppression of total P450 and rat CYP2C11 (Morgan, 1989) and induces CYP4A expression in rat liver (Sewer et al., 1996, 1997; Mitchell et al., 2001). At 16 h after injection, livers were collected and stored at -80°C until RNA or microsome preparation. This time point was chosen based on previous experiments reporting LPS-mediated down-regulation of nuclear receptors at 16 h (Beigneux et al., 2002). The Institutional Animal Care and Use Committee of Emory University approved these procedures. Five or six mice were used in each group (n = 5, PPARα; n = 6, PXR).
Preparation of Total RNA. Total RNA was prepared using RNA-Bee isolation reagent according to the manufacturer's instructions (Tel-Test Inc., Friendswood, TX). Total RNA concentration was determined spectrophotometrically by measuring absorbance at 260 nm, and RNA purity and integrity were confirmed by formaldehyde-agarose gel electrophoresis followed by visualization with ethidium bromide.
Microsome Preparation. Liver microsomes were prepared by differential centrifugation and stored at -80°C (Haugen and Coon, 1976). Microsomal protein concentrations were determined by the method of Lowry et al. (1951) using bovine serum albumin as the standard.
cDNA Synthesis. Purified total RNA was reverse-transcribed using the SuperScript first-strand synthesis system for RT-PCR kit (Invitrogen, Carlsbad, CA), according to the manufacturer's protocol. Briefly, 0.5 μg of total RNA was mixed with oligo(dT)12–18 primers (0.5 μg/μl), 1 μl of dNTP mix (10 mM of each dNTP), and water to a volume of 10 μl and incubated at 65°C for 5 min. After an incubation on ice for 1 min, 4 μl of 10× reverse transcriptase buffer (200 mM Tris-HCl, pH 8.4, and 500 mM KCl), 2 μl of 50 mM MgCl2, 2 μl of 0.1 M dithiothreitol, 1 μl of RNase OUT (recombinant RNase inhibitor; 2 U/μl), and 0.5 μl of Superscript II reverse transcriptase (50 units/μl) were added to each vial (final volume 20 μl). Each reaction mixture was incubated at 42°C for 50 min and then at 70°C for 15 min to inactivate the transcriptase enzyme. One microliter of RNase H (2 U/μl) was added, and the samples were incubated for 20 min at 37°C (to remove RNA from the final preparation).
Primer Sequences. Primers for mouse P450, cytokines, acute phase proteins, and glyceraldehyde phosphate dehydrogenase (GAPDH) were designed using the Primer Select software program (DNASTAR, Inc., Madison, WI). To exclude cross-reactivity with other mouse P450 sequences, as well as other enzymes, all primers were submitted to the National Center for Biotechnological Information for nucleotide comparison by the basic local alignment search tool (BLASTn; Altschul et al., 1990). Oligonucleotides with a high degree of similarity (>80%) to other mouse P450 mRNA transcripts were eliminated from further consideration. Primers were custom-synthesized on a 50-nmol scale by MWG Biotech, Inc. (High Point, NC) and obtained desalted and lyophilized. Primers were diluted to 100 μM in deionized water and stored at -80°C. Designed primer sequences are listed in Table 1; other primer sequences used (CYP1A2, 2E1, 3A11, and IL-1β) were published previously (Pan et al., 2000; Overbergh et al., 2003). In addition to the GAPDH primers listed in Table 1, other GAPDH primers were designed for use at annealing temperatures corresponding to the various primer sets.
List of primer sequences used for PCR
Quantitative Reverse Transcriptase PCR (Real-Time PCR). Real-time RT-PCR was performed using the ABI PRISM 7000 sequence detection system (Applied Biosystems, Foster City, CA), to determine P450 mRNA expression in mouse liver. Reactions were performed in a total volume of 25 μl using SyBr Green master mix reagent (Applied Biosystems); 2 μl of cDNA/sample was used as template for the reaction, with 10 μM forward and reverse primers. Both P450 and GAPDH amplification was done in duplicate wells using the same sample. Thermal cycling conditions included 2 min at 50°C and 10 min at 95°C, followed by 40 cycles of 95°C for 15 s and 1 min at the appropriate annealing temperature for each P450 (Table 1). This technique allows, by means of fluorescence emission, identification of the cycling point when PCR product is detectable (threshold cycle or Ct value). To normalize the amount of total mRNA present in each reaction, levels of the housekeeping gene GAPDH were monitored in parallel samples. Results are expressed as relative levels of P450 mRNA, referred to as control samples (the calibrator), chosen to represent 1× expression of the gene. The amount of target (P450 in treated sample), normalized to an endogenous reference (GAPDH) and relative to the calibrator (control P450 sample), was defined by the Ct method as described by Livak and Schmittgen (2001). All primer sets yielded a single PCR product of expected size by agarose gel electrophoresis, and specificity was routinely monitored by checking product melting curves (dissociation curves) in each reaction well.
Western Immunoblotting. P450 protein levels in mouse hepatic microsomes were measured by sodium dodecyl sulfate-polyacrylamide gel electrophoresis and Western blotting. Ten micrograms of protein sample was separated on a 7% polyacrylamide gel (NuPAGE Tris-acetate gel; Invitrogen) and transferred electrophoretically (Xcell II blotting apparatus; Invitrogen) at 40 V for 1.5 h onto a nitrocellulose membrane (Schleicher & Schuell, Keene, NH). Blots were incubated in PBS containing 0.05% Tween 20 (PBS-Tween) and 3% bovine serum albumin overnight and followed by incubation with primary antibody in PBS-Tween for 1 h at room temperature. Bound antibodies were detected using horseradish peroxidase-coupled secondary antibodies (Jackson ImmunoResearch Laboratories, West Grove, PA) in PBS-Tween and the enhanced chemiluminescence detection system (Amersham Biosciences, Inc., Piscataway, NJ) according to the manufacturer's instructions. Antibodies to rat CYP3A2, 4A1, and 2E1 were generously provided by Dr. James Halpert (University of Texas Medical Branch, Galveston, TX), Dr. Gordon Gibson (University of Surrey, Guildford, UK), and Dr. Magnus Ingelman-Sundberg (Karolinska Institute, Stockholm, Sweden), respectively. Polyclonal antibodies to rat CYP3A2, 4A1, and 2E1 proteins were diluted 1:5000, whereas 2C11 antibody (Morgan et al., 1994) was diluted 1:20,000. Secondary antibodies were as follows: goat anti-rabbit, 3A, 2C, and 2E; and rabbit anti-sheep, 4A; dilution for each was 1:2500, with the exception of 2C, which was 1:10,000. All assays were performed within a linear range and the intensity of stained bands was measured by laser densitometry.
Statistical Analysis. Control and experimental groups were compared by Student's t test (p < 0.05).
Results
Effect of LPS Treatment on Hepatic P450 mRNA and Protein Expression in PPARα Wild-Type and Knockout Mice. LPS administration significantly down-regulated hepatic CYP1A2, 2A5, 2C29, 2E1, and 3A11 mRNAs in PPARα WT mice. Similar responses were observed in PPARα KO mice for all these mRNAs (Fig. 1). Of the P450 isoforms studied, CYP2A5 mRNA was the most affected by LPS exposure (7% of control) and 2C29 mRNA was least affected (46% of control). PPARα KO mice had slightly higher basal levels of CYP2C29 mRNA compared with WT mice. In contrast to the other isoforms, CYP3A13 mRNA expression in PPARα WT mice increased significantly after LPS exposure (153%), and was increased in PPARα KO mice (139%) as well, although the latter comparison did not reach significance. Expression of CYP4A10 and 4A14 mRNAs was reduced by LPS treatment to 19 and 29% of control in PPARα WT mice, respectively. CYP4A mRNA expression in PPARα KO mice was barely measurable by sensitive real-time PCR methods (control levels, 0.0003 relative units).

Effects of LPS on hepatic P450 mRNA expression in PPARα WT and KO mice. Animals were treated with either saline or 1 mg/kg LPS, and relative levels of mRNA expression were determined at 16 h. Values represent means ± S.E.M. for each group (n = 5), and designations denote significant differences (p < 0.05) from WT control (*) or KO control (#).
In general, effects of LPS on P450 proteins (2C, 3A, 4A, and 2E) corresponded with real-time PCR results for the P450 mRNAs (Fig. 2). LPS administration decreased hepatic CYP2C, 3A, and 2E proteins in both PPARα WT and KO mice, although the decrease was not significant in WT mice for CYP2C (Fig. 2). LPS tended to decrease CYP4A protein expression in PPARα WT mice, although these effects were not statistically significant, and CYP4A proteins were undetectable in KO mice.
Effect of LPS Treatment on Hepatic Cytokine and Acute Phase Protein mRNA Expression in PPARα Wild-Type and Knockout Mice. As expected, LPS administration increased mRNA expression of proinflammatory cytokines and acute phase proteins (Fig. 3). LPS significantly induced mRNAs for IL-1β, IL-6, TNFα, AGP, and FBG in livers of PPARα WT mice by 380, 1013, 2615, 652, and 745%, respectively. LPS also induced the same mRNAs in PPARα KO mice, although the level of induction was slightly attenuated in each case.

Western blot data of LPS effects on hepatic proteins in PPARα WT and KO mice (top). Quantitative analysis of Western blot data (bottom). Animals were treated with either saline or 1 mg/kg LPS, and relative levels of mRNA expression were determined at 16 h. Values represent means ± S.E.M. for each group (n = 5), and designations denote significant differences (p < 0.05) from WT control (*) or KO control (#).

Effects of LPS on hepatic cytokine and acute phase protein mRNA expression in PPARα WT and KO mice. Animals were treated with either saline or 1 mg/kg LPS, and relative levels of mRNA expression were determined at 16 h. Values represent means ± S.E.M. for each group (n = 5), and designations denote significant differences (p < 0.05) from WT control (*) or KO control (#).
Effect of LPS Treatment on Hepatic P450 mRNA and Protein Expression in PXR Wild-Type and Knockout Mice. LPS exposure significantly decreased hepatic expression of CYP1A2, 2A5, 2C29, 2E1, 3A11, 4A10, and 4A14 mRNAs in PXR WT and KO mice (Fig. 4). CYP2A5 mRNA was most affected by LPS exposure (13% of control) and 2E1 mRNA levels were least affected (43% of control), with higher basal CYP2A5 and 2E1 mRNA in PXR KO mice as compared with WT controls. Additionally, basal 3A11 mRNA levels were 2-fold higher in PXR KO mice (Fig. 4). In contrast, there was little effect of LPS treatment on basal CYP3A13 mRNA expression in PXR WT and KO mice.

Effects of LPS on hepatic P450 mRNA expression in PXR WT and KO mice. Animals were treated with either saline or 1 mg/kg LPS, and relative levels of mRNA expression were determined at 16 h. Values represent means ± S.E.M. for each group (n = 6), and designations denote significant differences (p < 0.05) from WT control (*) or KO control (#).
P450 protein expression in PXR WT and KO mice showed some similarities and some differences from the mRNA results. Treatment with LPS tended to decrease hepatic CYP2C proteins in both PXR WT and KO mice (Fig. 5), although these decreases were not significant. CYP3A proteins were significantly down-regulated in PXR WT mice, but this did not reach statistical significance in KO mice. There was little effect on CYP2E proteins after 16 h of LPS exposure (Fig. 5), in contrast to the effects on CYP2E1 mRNA levels (Fig. 4). CYP4A proteins in PXR WT mice were the most significantly affected after LPS administration, although variability in individual protein samples prevented this significance in PXR KO mice.
Effect of LPS Treatment on Hepatic Cytokine and Acute Phase Protein mRNA Expression in PXR Wild-Type and Knockout Mice. LPS treatment tended to induce IL-1β and IL-6 mRNA expression in PXR WT and KO mice, although the increases were not significant (Fig. 6). LPS exposure induced TNFα mRNA in PXR WT (406%) and had a greater response in PXR KO mice (638% of control). As expected, hepatic mRNA expression of AGP was significantly increased after LPS treatment in both WT (549%) and KO (1068%) mice. Similar results were observed with FBG in PXR WT (280%) and KO (582%) mice. Overall, the responses tended to be slightly greater in the PXR KO mice.

Western blot data of LPS effects on hepatic proteins in PXR WT and KO mice (top). Quantitative analysis of Western blot data (bottom). Animals were treated with either saline or 1 mg/kg LPS, and relative levels of mRNA expression were determined at 16 h. Values represent means ± S.E.M. for each group (n = 5), and designations denote significant differences (p < 0.05) from WT control (*).
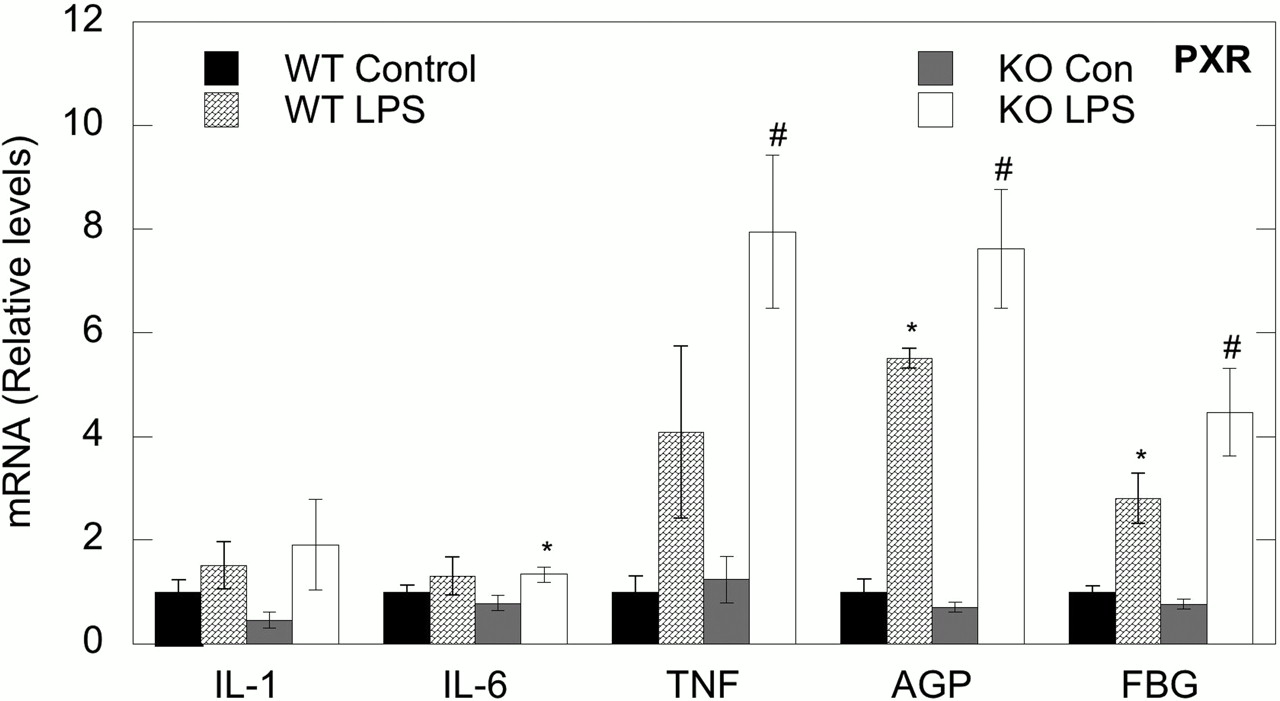
Effects of LPS on hepatic cytokine and acute phase protein mRNA expression in PXR WT and KO mice. Animals were treated with either saline or 1 mg/kg LPS, and relative levels of mRNA expression were determined at 16 h. Values represent means ± S.E.M. for each group (n = 6), and designations denote significant differences (p < 0.05) from WT control (*) or KO control (#).
Discussion
Infection or inflammatory stimuli such as LPS can alter hepatic cytochromes P450 at the mRNA and protein levels, resulting in changes in both expression and activities (Morgan, 2001). Drug-induced P450 transcription is controlled by nuclear receptors, which may be involved in P450 down-regulation during inflammation. In this study, we sought to determine the involvement of the nuclear receptors PPARα and PXR in the down-regulation of several P450 isoforms after LPS-induced inflammation using mice deficient in these nuclear receptors. Our data show down-regulation of mRNA expression of P450 1A2, 2A5, 2C29, 2E1, and 3A11 during inflammation in WT mice, with essentially identical results in both PPARα and PXR KO mice, indicating that down-regulation of these P450s during inflammation is not a consequence of down-regulation of the nuclear receptors PPARα and PXR.
The nuclear receptor PPARα has been implicated in inflammatory pathways, and induction of PPARα target genes may be important in termination of the action of inflammatory mediators (Morgan, 2001; Barbier et al., 2004). PPARα primarily regulates lipid metabolism and glucose homeostasis and stimulates the β-oxidative degradation of fatty acids (Chinetti et al., 2000). Target genes of PPARα include CYP4A subfamily enzymes, β-oxidation enzymes, and fatty acid binding proteins (Aoyama et al., 1998). During LPS-induced inflammation, both hepatic and renal CYP4A mRNAs are induced in rats (Sewer et al., 1996, 1997; Mitchell et al., 2001), whereas in this study we observed down-regulation of hepatic CYP4A10 and 4A14 mRNAs in PPARα WT mice after LPS exposure (Fig. 1) in agreement with our previous report (Barclay et al., 1999). It could be speculated that down-regulation of CYP4A mRNA after LPS exposure could be directly linked to down-regulation of PPARα mRNA levels. Although hepatic PPARα mRNA levels were not measured in our mice, Tai et al. (2003) observed down-regulation of PPARα mRNA in female mice (50% of control) 2 h after LPS exposure, with recovery to baseline levels at 24 h. Therefore, it seems unlikely that the extensive down-regulation of CYP4A10 and 4A14 mRNAs after a 16-h LPS exposure (to 19 and 29% of control) is due solely to down-regulation of PPARα mRNA.
Our previous investigation found that LPS treatment down-regulated hepatic CYP2A5, 2C29, and 3A11 mRNA in PPARα WT mice and that the effects on these P450 isoforms were attenuated or blocked in PPARα KO mice (Barclay et al., 1999). In contrast, our current data indicate similar down-regulation of CYP2A5, 2C29, and 3A11 mRNAs after LPS exposure in both PPARα WT and KO mice (Fig. 1) as well as down-regulation of P450 proteins (Fig. 2), suggesting that PPARα is not involved in down-regulation of these P450s during inflammation. In our previous study, mRNA levels were determined by Northern blotting, used fewer animals, and had a slightly longer LPS exposure time (24 versus 16 h). The current findings using the more sensitive and quantitative real-time PCR method, and a larger number of animals, conclusively establish that PPARα is not involved in down-regulation of the P450s studied here (1A2, 2A5, 2C29, 2E1, and 3A11).
Little is known about PXR and inflammatory pathways. Activation of PXR regulates xenobiotic-inducible CYP3A gene expression in mice (Kliewer et al., 1998), as well as CYP2B and 2C, glutathione S-transferases, sulfotransferases, UDP-glucuronosyltransferases, organic anion transporter peptide 2, and multidrug resistance protein 3 (Staudinger et al., 2003). Studies have associated down-regulation of PXR after LPS administration with reductions in PXR-regulated P450 (Beigneux et al., 2002; Xu et al., 2004; Teng and Piquette-Miller, 2005). As shown in Fig. 4, we observed similar down-regulation of CYP1A2, 2A5, 2C29, 2E1, 3A11, 4A10, and 4A14 mRNAs in both PXR WT and KO mice, indicating that PXR is not required for P450 down-regulation during inflammation. These observations corroborate a recent finding by Teng and Piquette-Miller (2005), who also demonstrated down-regulation of CYP3A11 mRNA in both WT and PXR KO mice after a shorter exposure to a higher dose of LPS (5 mg/kg; 6 h). Both our data and the Teng study indicate higher basal levels of CYP3A11 mRNA in PXR KO mice compared with PXR WT mice. Regardless of the higher basal levels in the PXR KO, the percentage of reduction of CYP3A11 by LPS was similar in both PXR WT and PXR KO mice (81.5 and 79.6% reduction, respectively). In contrast to the other P450 isoforms, CYP3A13 was not affected by LPS treatment in our PXR study (Fig. 6), although PXR is reported to be involved in its basal expression (Anakk et al., 2003). Interestingly, LPS treatment induced CYP3A13 mRNA in the PPARα experiment (Fig. 1). This difference in regulation of CYP3A13 by LPS may be due to the different background strains used in the two studies.
Measurements of P450 proteins in PXR WT and KO mice exhibited considerable variability. CYP3A and 4A proteins in PXR WT mice most closely corresponded with mRNA results (Figs. 4 and 5). Densitometric analysis of individual protein samples indicated down-regulation of most but not all proteins, but when averaged, this decrease was negated by samples that were not affected by LPS exposure. Rat antibodies recognize several mouse proteins within a subfamily, making it difficult to associate down-regulation of a single mouse mRNA transcript with down-regulation of several related mouse proteins. Also, this study was conducted at a single time point and LPS dose that we chose to be optimal for down-regulation of P450 mRNAs. Sixteen hours may not be sufficient time for significant down-regulation of P450 proteins to become fully manifested. The possibility cannot be excluded that PPARα and/or PXR could influence the time or concentration dependence of P450 mRNA down-regulation by LPS. This question could be resolved by future time-course and dose-response studies
Although P450 down-regulation does not require PPARα and PXR, the involvement of other transcription factors must be considered. Several laboratories have attempted to determine the involvement of basal transcription factors (TFs) in P450 regulation, and many questions remain. Jover et al. (2002) demonstrated that expression of liver-enriched transcriptional inhibitory protein (LIP) represses human CYP3A4 reporter gene expression, suggesting that LIP induction mediates the suppression of CYP3A4 during the acute phase response. However, Cheng et al. (2003) found that levels of LIP were not significantly affected in rat liver 1 h after LPS injection and that suppression of rat liver CYP3A2, 2C11, and 2E1 transcription at early time points is not due to elevation of nuclear LIP. Reduction of other TFs has been suggested as the reason for P450 suppression after LPS treatment, including hepatocyte nuclear factor (HNF)-1 (Roe et al., 2001), HNF3 (Park and Waxman, 2001), and HNF4 (Cheng et al., 2003). Overall, the combination of reduced activities of several TFs could contribute to the P450 suppression (Cheng et al., 2003).
The down-regulation of multiple P450 isoforms during inflammation can be mimicked by in vivo and in vitro treatment with proinflammatory cytokines such as IL-1β, IL-6, and TNFα (Morgan, 2001). It is possible that cytokines produced in vivo may mediate P450 down-regulation in our study, although this cannot be determined from these data because plasma cytokine levels were not determined, and the hepatic cytokine mRNAs were not measured at peak times (1–6 h). Although our studies show that PPARα and PXR are not directly involved in P450 down-regulation, it is possible that these nuclear receptors are involved in the modulation of proinflammatory cytokines. The LPS-mediated induction of TNFα mRNA was attenuated in PPARα KO mice (Fig. 3), suggesting the involvement of PPARα in regulation of TNFα expression. Hill et al. (1999) have observed that PPARα activators up-regulate TNFα expression in mice during endotoxemia. In contrast to PPARα KO mice, hepatic TNFα mRNA in PXR KO mice was significantly increased after LPS treatment (Fig. 6), suggesting possible cytokine compensation or an absence of negative feedback for TNFα in PXR KO mice. Alternatively, there may simply be a difference in the time course of the inflammatory response regarding the induction of TNFα in the two strains of mice. Together, these data suggest that PPARα and PXR may be involved in modulation of TNFα, which in turn can mediate P450 down-regulation.
Several studies have investigated cytokine involvement in P450 decreases during LPS-induced inflammation, using cytokine- or cytokine receptor-null mice. These studies have generally shown no significant differences between WT and KO mice (Warren et al., 1999; Siewert et al., 2000; Ashino et al., 2004), suggesting that cytokines signal redundantly to down-regulate P450s during LPS-induced inflammation. Also, LPS may alter P450 expression by mechanisms that differ depending on the LPS dose. In addition to cytokines, reactive oxygen species have been suggested to contribute to LPS down-regulation of PXR and CYP3A11 mRNA (Xu et al., 2004). The same authors have also recently shown that the antioxidant melatonin attenuates LPS-induced down-regulation of PXR and CYP3A11 (Xu et al., 2005).
In summary, we have conclusively shown that the nuclear receptors PPARα and PXR are not required for the down-regulation of P450 isoforms during LPS-induced inflammation, because we observed similar down-regulation of several P450s mRNAs in both wild-type and knockout mice.
Acknowledgments
The technical assistance of Kimberly L. Pierce is gratefully acknowledged. We are indebted to Dr. Gary W. Miller (Emory University Center for Neurodegenerative Disease and the Department of Environmental and Occupational Health) for the use of equipment. We also thank Dr. Bryan J. Goodwin (GlaxoSmithKline) for providing PXR knockout mice.
Footnotes
-
National Institutes of Health Grant GM-46897 provided funding for this study. Portions of this work were previously presented at the 44th Annual Society of Toxicology meeting, New Orleans, LA.
-
Article, publication date, and citation information can be found at http://jpet.aspetjournals.org.
-
doi:10.1124/jpet.105.085456.
-
ABBREVIATIONS: P450, cytochrome P450; LPS, lipopolysaccharide; IL, interleukin; TNF, tumor necrosis factor; PPAR, peroxisome proliferator-activated receptor; PXR, pregnane X receptor; RXR, retinoid X receptor; KO, knockout; WT, wild type; RT-PCR, reverse transcription-polymerase chain reaction; GAPDH, glyceraldehyde phosphate dehydrogenase; PCR, polymerase chain reaction; PBS, phosphate-buffered saline; AGP, α1-acid glycoprotein; FBG, fibrinogen; TF, transcription factor; LIP, liver-enriched transcriptional inhibitory protein; HNF, hepatocyte nuclear factor.
- Received February 25, 2005.
- Accepted April 26, 2005.
- The American Society for Pharmacology and Experimental Therapeutics


