


Abstract
Changes in the disposition of estradiol 17β-d-glucuronide (E217G), a substrate of the organic anion-transporting polypeptide family (Oatp) and multidrug resistance-associated protein 2 (Mrp2), were examined in livers of male Wag/Rij rats that were injected with CC531 cells intraportally to induce metastatic tumors (n = 5) or with phosphate-buffered saline for sham-operated controls (n = 4). Multiple indicator dilution, single-pass liver perfusions revealed extremely high influx clearances of [3H]E217G (>190 ml/min) in both groups. In recirculating liver perfusions, [3H]E217G decayed monoexponentially in the reservoir perfusate, and the total (9.19 ± 1.33 versus 8.18 ± 0.94 ml/min) and biliary (4.94 ± 1.07 versus 4.60 ± 0.86 ml/min) clearances were similar in both groups (P > 0.05). The metabolic clearance of E217G was higher in the tumor group (4.60 ± 0.64 versus 3.23 ± 0.23 ml/min, P < 0.05). E23S17G, the 3-sulfate metabolite, whose identity was confirmed by mass spectrometry, appeared only in bile and not perfusate. Liver microsomal incubations of E2335S17G and [3H]estrone sulfate revealed similar sulfatase activities between the tumor and sham livers, albeit the activities were much lower for E2335S17G. Oatp1a1 and Oatp1b2 protein expression in liver membrane fragments was reduced by 42% and 38%, respectively, whereas that of cytosolic estrogen sulfotransferase (Sult1e1) was significantly increased (41%) with tumor (P < 0.05). All of the observations were captured by modeling. From modeling, we showed that reduction of the high influx clearance (546 to 283 ml/min) failed to lower the total clearance of E217G, whereas up-regulation of Sult1e1 increased the E217G sulfation clearance (2.56 to 3.69 ml/min) in livers with metastatic tumors.
The liver mediates both the metabolism and excretion of drugs. Molecules gain access into hepatocytes where the machinery for vectorial transport and biotransformation exists. At the basolateral/sinusoidal membrane, unbound molecules in plasma are taken up by hepatocytes via organic anion/cation transporters and/or passive diffusion. In the cell, the molecules can be metabolized by various phase I and phase II enzymes. Finally, drug precursors and metabolites are either secreted into bile by the ATP binding cassette transporters, the multidrug resistance-associated protein (MRP) 2, P-glycoprotein, and breast cancer resistance protein (BCRP), or effluxed back into the blood stream by MRP3 and MRP4.
Liver tumor metastasis is a progressive invasion of malignant cells into the liver and is accompanied by changes in transporters, enzymes, protein binding, and blood flow patterns that result in changes in drug disposition (Jain, 1994; Wilson and Balkwill, 2002; Liu et al., 2006). Because of the high mortality of colorectal cancer due to distant metastasis of colon carcinoma cells primarily into the liver, metastatic liver tumor models are developed to enable the study of tumor development (Jemal et al., 2006). Before and during chemotherapy, multidrug resistance, characterized by upregulation of drug efflux transporters and/or increases in enzymatic activity and down-regulation of various influx transporters, are known to be acquired by the malignant tissue (Gottesman et al., 2002). However, there exist only a scant number of studies that evaluated changes in drug transporters and metabolic enzymes in peritumor liver tissue (Schuetz et al., 1995; Bonin et al., 2002), which, in addition to the tumor, is responsible for the removal of drugs. Because hepatocellular metastasis triggers a cascade of biochemical and immunological responses (Khatib et al., 2005), namely increased levels of cytokines and growth factors that may alter the expression of transporters and metabolic enzymes, there is the need for a thorough investigation on the impact of tumor development on transporters, enzymes, and the microcirculation in drug removal in peritumor tissue compared with liver tissue from sham-operated rats.
Recently, we developed a metastatic liver tumor model originating from colon adenocarcinoma CC531 cells derived from dimethylhydrazine-induced treatment (Marquet et al., 1984) that are syngeneic with the male Wag/Rij rat. The colon cancer so developed is shown to share many characteristics with human colon adenocarcinoma (Thomas et al., 1993). In this model, induction of metastatic liver tumors was achieved by intraportal injection of CC531 cells, mimicking the in vivo migration of colon carcinoma cells into the liver. The characteristics of the model, displaying temporal changes in transporters and enzymes, have been well described previously (Liu et al., 2006).
The aim of the study was to correlate changes in protein levels observed in our previous report with transporter and enzyme function in peritumor tissue. E217G was chosen as the probe (Fig. 1), because E217G is taken up into rat hepatocytes by Oatp1a1, Oatp1a4, and Oatp1b2 at the basolateral membrane (Noé et al., 1997; Cattori et al., 2001), excreted by Mrp2 or Bcrp into bile at the canalicular membrane (Takikawa et al., 1996; Imai et al., 2003; Suzuki et al., 2003) and is effluxed at the basolateral membrane by Mrp3 (Hirohashi et al., 1999) and Mrp4 (Chen et al., 2001). E217G is cholestatic at high concentrations, due in part to the endocytic retrieval of the canalicular Mrp2 and Bsep, transporters that contribute to bile flow and to cis-inhibition of the canalicular transport of glutathione (Mottino et al., 2003). Levels of Mrp3 are normally low at physiological conditions but are up-regulated with cholestasis (Hirohashi et al., 1999; Nunoya et al., 2003). In rat liver, E217G was reported to form estradiol 3-sulfate-17β-d-glucuronide (E23S17G), whose identity has only been inferred by enzymatic hydrolysis (Meyers et al., 1980). Because futile cycling, or interconversion between precursor and metabolite, was also found between estrone (E1) and estrone 3-sulfate (E1S) in rat liver (Tan and Pang, 2001; Tan et al., 2001), it is plausible that futile cycling between E217G and E23S17G exists. We will examine the changes in transporter and enzyme levels in peritumor tissues with tumor progression, assess the influx of E217G in single-pass, multiple indicator dilution liver perfusion studies, and the transport and metabolism of E217G in recirculating liver preparations. Finally, we will integrate the findings with a physiologically based pharmacokinetic (PBPK) model. This work will extend the framework of multidrug resistance to changes in both enzymes and transporters in altering drug disposition in metastatic tumors.
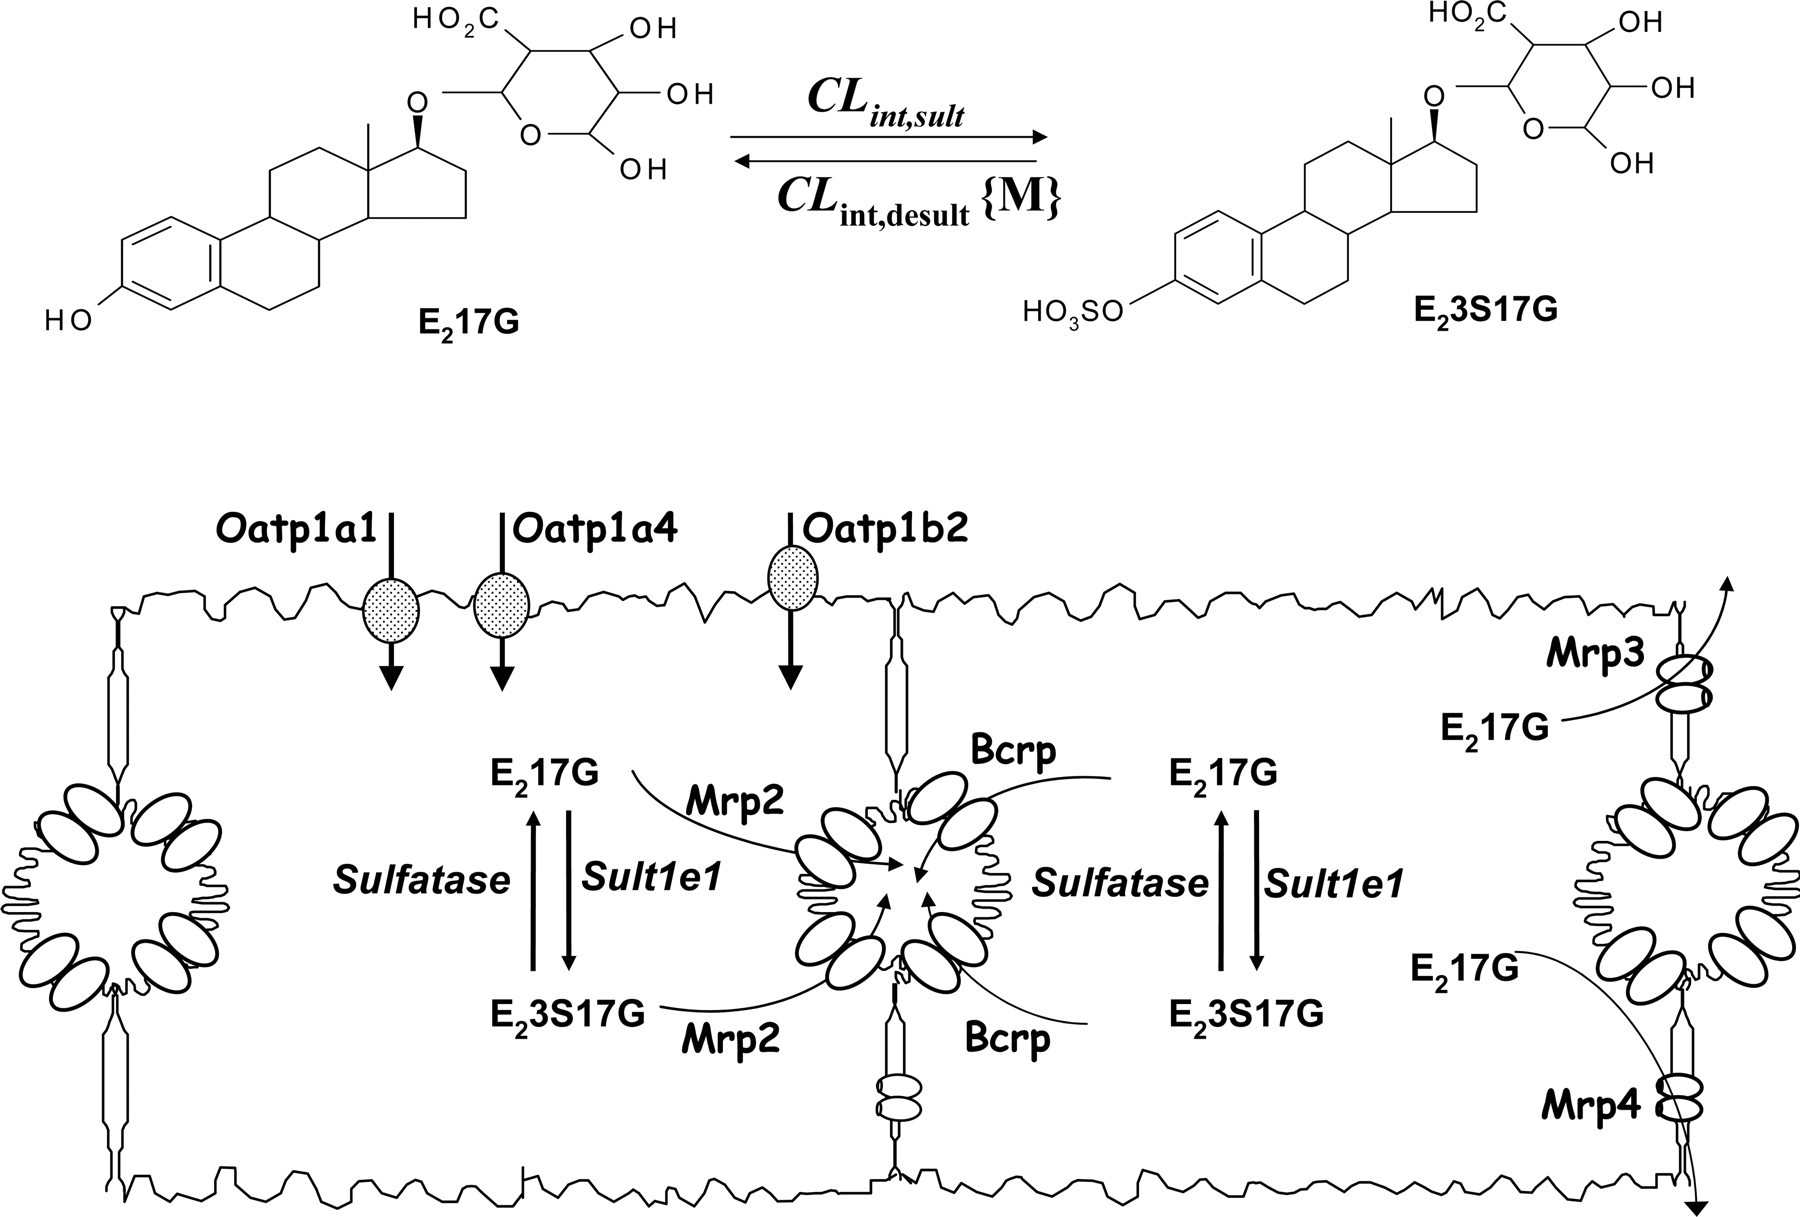
A scheme depicting the biological fate of E217G in rat hepatocytes. E217G is sulfated to E23S17G, which may be desulfated back to E217G (top). The bottom shows the transporters involved in E217G and E23S17G influx and efflux in rat liver.
Materials and Methods
Materials
[6,7-3H]E217G (specific activity 45 Ci/mmol), [6,7-3H]E1S (specific activity 53 Ci/mmol), and Na35SO4 (1050–1600 Ci/mmol) were purchased from PerkinElmer Life and Analytical Sciences (Boston, MA). E2335S17G was biosynthesized by recirculation of 0.5 μM E217G in oxygenated Krebs-Henseleit bicarbonate (KHB) at 40 ml/min through the liver, with Na 352SO4 (18 μCi/min for 30 min) that was infused directly into the portal vein cannula. The pooled bile was lyophilized, reconstituted, and injected into HPLC running gradient program I for isolation (see HPLC Methods); the eluant corresponding to E2335S17G was desalted by a reverse phase Sep-Pak cartridge (Waters, MA), and the purified content was stored at –20°C. The radiochemical purities of [3H]E217G, [3H]E1S, and E2335S17G were 98, 99, and 95%, respectively, as evaluated by HPLC. Unlabeled E217G, E23S17G, estradiol (E2), E1, E1S, estrone 3-glucuronide, estradiol 3-glucuronide (E23G), estradiol 3-sulfate (E23S), and bovine serum albumin (BSA) in Tyrode's solution were obtained from Sigma-Aldrich Canada (Mississauga, ON). Dextrose 50% USP injection was obtained from Abbott Laboratories (Montreal, QC, Canada). Antibodies for Oatp1a1 and Oatp1a4 were kind gifts from Dr. Allan W. Wolkoff (Albert Einstein College of Medicine, Bronx, NY); the antibody for Oatp1b2 was kindly provided by Dr. R. B. Kim (Vanderbilt University Medical Center, Nashville, TN). Sult1a1 and Sult2a1 antibodies were generously donated by Dr. Charles N. Falany (University of Alabama at Birmingham, Birmingham, AL), and Sult1e1 monoclonal antibody was purchased from Abcam (Cambridge, MA). The Mrp2 antibody (M2III-6) was obtained from AXXORA, LLC (San Diego, CA). Acetonitrile of HPLC grade was supplied by Fisher Scientific Canada (Mississauga, ON). All other reagents were of HPLC grade, and deionized distilled water was used in all experiments.
Albumin Binding and RBC Partitioning of E217G
E217G binding to albumin was measured by equilibrium dialysis. The dialysis system is composed of two half-cells separated by a freshly conditioned, dialysis membrane (mol. wt. cutoff 12,000–14,000; Spectrum Laboratories Inc., Rancho Dominguez, CA). Different concentrations of E217G (0.25–50 μM, [3H]E217G ∼150,000 dpm/ml) in KHB containing 1.25% BSA (equivalent to 1% albumin in 20% red blood cell perfusate) were introduced into one of the half-cells (protein side), and an equal volume of KHB was placed into the other half-cell (buffer side) of the dialysis cell. The cells were incubated at 37°C in a rotating water bath. At 4.5 h, the predetermined time for binding equilibrium, samples from both sides were taken and counted by liquid scintillation spectrometry (LS 5801 Counter; Beckman Coulter Canada, Mississauga, ON, Canada). The free or unbound fraction of E217G was calculated by the ratio of [3H]E217G concentration in the buffer side to that in the protein side.
The partitioning of E217G into RBC was examined by an admixture of equal volumes of [3H]E217G plasma perfusate (0–25 μM E217G, 1% BSA in KHB) with blank RBC perfusate (40 or 80% RBC-1% BSA in KHB, pH 7.4). Because preliminary experiments showed that rapid equilibrium was reached before 15 s, the first sampling point, the mixture was incubated for a total of 5 min at 37°C, and the hematocrit (Hct) was determined. Thereafter, blood samples were centrifuged immediately, and the resultant plasma was counted. λR, the ratio relating the total RBC concentration of E217G and unbound concentration in plasma, is given by  where fp (0.98) and fr (0.7) are the fractions of 1% BSA plasma and RBCs that are water, respectively, and fu,p is the unbound fraction of E217G in plasma.
Liver Metastasis Induced by CC531 Cells
The metastatic tumor model was developed as described previously (Thomas et al., 1993; Liu et al., 2006). In brief, CC531 cells were seeded in the RPMI 1640 medium supplemented with 10% heat-inactivated fetal bovine serum, 2 mM glutamine, 20 μg/ml streptomycin, and 20 U/ml penicillin (Invitrogen, Carlsbad, CA). Cells were maintained in serial passages until 70% confluent. Cells were harvested and placed in a solution of 0.1% (w/v) EDTA and 0.25% trypsin in Hanks' balanced salt solution and then centrifuged at 2700 rpm for 5 min at 4°C. The derived cell pellets were washed three times and resuspended in cold phosphate-buffered saline (PBS); the cell suspension was adjusted to 8 million cells/ml with PBS, and kept over ice before tumor inoculation. Cell viability was examined by trypan blue exclusion.
The Wag/Rij rats (a Wistar-derived inbred strain) and the CC531 cell line were kindly provided by Dr. Peter J. K. Kuppen (Department of Experimental Surgery, Leiden University Medical School, Leiden, Netherlands). The rats were bred in the Division of Comparative Medicine, University of Toronto, and maintained in the housing facility (two rats/cage, 12-h light/dark cycle) with access to animal chow and water ad libitum. Procedures of the animal studies were conducted in accordance with protocols approved by Animal Committee at the University of Toronto. Male Wag/Rij rats (264–306 g) were anesthetized with an intraperitoneal dose of sodium pentobarbital (65 mg/kg). The rat abdomen was shaved and disinfected with 70% alcohol before the midline small incision (2–3 cm) was made along the linea alba to expose the portal vein for injection of 4 million CC531 cells (0.5 ml, tumor group) or PBS (0.5 ml, sham-operated group). After inoculation, the abdomen was sutured and disinfected. The rats were carefully monitored daily for the next week until fully recovered from surgery. Progression of metastasis was scored with a classification scheme (Table 1), and an excellent correlation (r2 = 0.94) was found between tumor score and intensity of immunoreactive bands with MG1 (Liu et al., 2006), a specific antibody that recognizes CC531 (Hagenaars et al., 2000). The rat livers exhibited slight (++) and moderate tumor (++++ to +++++++) growths at 3 and 4 weeks postinoculation, respectively.
Classification of tumor scores in CC531-induced metastatic liver tumor model according to Liu et al. (2006)
Multiple Indicator Dilution Liver Perfusion Studies
Rat livers at 3 weeks postinoculation were used for multiple indicator dilution (MID) studies. For these livers, low tumor scores were observed (++), and no change in liver physiological spaces was observed (Liu et al., 2006). Hence, the influx clearance for E217G so obtained probably represents the uptake clearance under normal physiology where no change in Oatp1a1 was observed (Liu et al., 2006). As described previously (Xu et al., 1994), a MID bolus dose consisting of noneliminated reference indicators (51Cr-labeled red blood cells, 125I-labeled albumin, and [14C] sucrose and D2O) and [3H]E217G was injected into single-pass perfused rat liver preparations via the portal vein; the hepatic artery was ligated. After dose introduction, the collection of outflow perfusate was initiated immediately at successive 1- to 5-s intervals for up to 215 s, when the noneliminated indicators were almost completely recovered in the outflow. The 51Cr and 125I labels in blood perfusate were directly assayed by gamma counting, and the 14C and 3H disintegrations per minute in plasma after precipitation with acetonitrile were assayed by liquid scintillation counting, whereas D2O in the plasma perfusate was analyzed by Fourier transform infrared spectroscopy (Xu et al., 1994). In the MID studies, no metabolite was observed in the pooled outflow perfusate when tested by HPLC, and the tritium counts in the outflow samples represented those of E217G. The outflow concentrations were expressed as the fractions of the injected activity per milliliter.
Linear transformation of the data was conducted by superposition of the diffusible label onto that of the red blood cell, to provide for estimates of t0, the large vessel transit time, and γ, the ratio of the stationary volume to that of sinusoidal plasma, as described by Xu et al. (1994). The data were interpolated by a cubic spline with use of IMSL (Visual Numerics, Houston, TX), and extended to time infinity to approximate the area under the concentration-time curve (AUC) and the area under the moment curve. The apparent mean transit times of the various indicators, calculated as area under the moment curve/AUC, were corrected for t0 and the mean transit time of inflow and outflow catheters. The corrected mean transit times were multiplied to the appropriate flow rates to obtain estimates of physiological volumes (Xu et al., 1994).
The volume ratio of the hypothetical reference, γref, is the ratio of the Disse space to the sinusoidal plasma space of E217G and takes into account the extracellular distribution of E217G due to red cell and albumin binding. The estimate was based on that described previously for salicylamide sulfate that distributes rapidly into red blood cells and binds to albumin (Xu et al., 1994); the γref for the hypothetical reference of E217G was calculated according to eq. 2,  where β is the ratio of the water space inside the RBC to the volume of the adjacent vascular plasma water space, γalb and γsuc, ratios of the Disse space of albumin and sucrose, respectively, to sinusoidal plasma, were obtained from superposition (Xu et al., 1994), λR was obtained from eq. 1, and fu,p was obtained from albumin binding studies.
The outflow concentrations for hypothetical references were calculated according to eq. 3: 
The sucrose data at designated time points, [(t – t0)(1 + γsuc)/(1 + γref)] + t0, were obtained by interpolation of the experimentally derived Csuc values. The ratio plot, or plot of the natural logarithm concentration ratio of the hypothetical reference, Cref, to that of E217G, against time in the upslope portion of outflow curves was used to estimate the influx clearance (CLin) or permeability surface area product (PS) of E217G (Xu et al., 1994),  where Vp is the sinusoidal plasma volume and k12, the influx coefficient, is the slope of the ln-ratio plot.
Recirculating Rat Liver Perfusion
In situ recirculating perfusion was conducted according to Tan et al. (2001) on the metastatic (9.5–11.7 g) and sham-operated (8.5–9.8 g) rat livers at 4 weeks postinoculation. Week 4 represented the optimal time to observe tumor progression, because beyond this time, surgical failures were often encountered with increased frequency in liver perfusion studies due to leakage in flow. In brief, perfusate entered via the portal vein and exited through the hepatic vein at the flow rate of 12 ml/min. Blank perfusate consisted of bovine erythrocytes (∼20%), freshly obtained and washed (a kind gift of Ryding-Regency Meat Packers Ltd., Toronto, ON, Canada), 1% bovine serum albumin, 3% dextran, and 0.3% glucose in KHB solution buffered to pH 7.4 and oxygenated with 95% oxygen-5% carbon dioxide. Blank perfusate was first delivered for the 20-min equilibration of the rat liver preparation. Thereafter, perfusate was supplied from an alternate reservoir containing 0.5 μM E217G ([3H]E217G ∼100,000 dpm/ml) for the recirculating experiment. Perfusate sampling (1 ml) was conducted at 0, 2.5, 7.5, 12.5, 17.5, 22.5, 27.5, 35, 45, 55, 70, 90, and 110 min, and bile was collected at 0 to 5, 5 to 10, 10 to 15, 15 to 20, 20 to 25, and 25 to 30 min and at 10- or 20-min intervals until 120 min. At the end of the experiment (120 min), the liver was flushed with 50 ml of ice-cold KHB and carefully excised, blotted, and weighed. Perfusate and bile samples were kept at –20°C until analyses. Peritumor tissue and neoplastic tissue were carefully separated, snap-frozen with liquid nitrogen, and stored at –80°C. These peri tumor tissues were compared with those of the sham-operated liver tissues in these experiments. The crude membrane fractions and cytosolic fractions were prepared for immunoblot analysis to examine the expression of transporters (Oatp1a1, Oatp1a4, Oatp1b2, and Mrp2) and enzymes (Sult1a1, Sult2a1, and Sult1e1), respectively. The samples were also reassayed in conjunction with other liver tissues (Liu et al., 2006) from metastatic rat livers of different tumor scores (+ to +++++++).
Preparation of Subcellular Fractions for Immunoblot Analyses and in Vitro Incubations
Rat livers at the end of perfusion were used to prepare crude membranes and cytosol for immunoblots. Previous studies had established that the Oatps and Mrp2 remain stable with 2 h of perfusion. Peritumor and sham-operated liver tissues were homogenized in homogenate buffer (250 mM sucrose, 10 mM HEPES, and 10 mM Tris-base, pH 7.4), and centrifuged at 3000g for 10 min; the resultant supernatant fractions were centrifuged at 33,000g for 1 h. The pellet (crude membrane fractions) was placed in resuspension buffer (50 mM mannitol and 20 mM HEPES in 20 mM Tris base, pH 7.5) for analyses. For other fractions, liver tissue was homogenized in SET buffer (250 mM sucrose, 1 mM EDTA, and 10 mM Tris-HCl, pH 7.4) (Shibata et al., 2001). The homogenate was first centrifuged at 10,000g for 20 min, and the resultant supernatant was centrifuged at 100,000g for 1 h to yield the microsomal (pellet) and cytosolic (supernatants) fractions. All of the buffers were freshly prepared and supplemented with protease inhibitor cocktail (Sigma-Aldrich, Oakville, ON, Canada). The crude membrane and cytosolic fractions were used for Western blotting.
Cytosolic and microsomal fractions were used for the measurement of sulfatase activities. Sham-operated rat liver tissue and peritumor tissue from metastatic livers (tumor score >++++) at 4 weeks postinoculation were homogenized with Tris-HCl (25 mM, pH 7.4). The homogenate was centrifuged at 9000g for 20 min. The resultant supernatant (S9) was centrifuged at 100,000g for 1 h to provide the supernatant or cytosol; the pellet was resuspended in Tris-HCl (25 mM, pH 7.4) to yield microsomes. All procedures were carried out at 4°C. The subcellular fractions were assayed with the method of Lowry (1951) for total protein concentration and were kept at –80°C.
Immunoblot Analysis
Expression levels of the Oatps, Mrp2, and Sults in perfused rat livers were examined by Western blotting. The livers were harvested at the end of the recirculating rat liver perfusion experiment. Twenty micrograms of crude membrane (for Oatps and Mrp2) or cytosolic (for Sults) proteins, prepared as described previously (Liu et al., 2006), were resolved by SDS-polyacrylamide gel electrophoresis in 7.5% (for Mrp2), 10% (for Oatps), and 12% (for Sults) gels and electrophoretically transferred to nitrocellulose membranes. The blots were blocked with Tris-buffered saline-Tween 20 buffer containing 5% nonfat milk for 15 min, and then incubated with primary antibodies (rabbit-anti-Oatp1a1 at 1:2500, rabbit-anti-Oatp1a4 at 1:10,000, rabbit-anti-Oatp1b2 at 1:2000, mouse-anti-Mrp2 at 1:750, rabbit-anti-Sult2a1 at 1:5000, rabbit-anti-Sult1a1, and mouse-anti-Sult1e1 at 1:10,000) overnight at 4°C. Finally, goat anti-rabbit (for Oatps, Sult1a1 and 2a1) or goat anti-mouse (for Sult1e1 and Mrp2) IgG horseradish peroxidase conjugate was incubated with the blots at room temperature for 1 h. The autoradiograms, obtained with exposure of the blots to film upon reaction with enhanced chemiluminescence, were densitometrically quantified with Scion Image (Scion Corporation, Frederick, MD). To compare the present results with those obtained previously in the same metastatic tumor model (Liu et al., 2006), we repeated the assay of the present tissue samples with those from livers bearing different tumor scores [+, ++, ++++, and ≥++++++ from Liu et al. (2006) on the same immunoblot].
Sulfatase Activity in Subcellular Fractions
An aliquot (75 μl) of microsomal (0.3 mg) or cytosolic (0.7 mg) fraction was mixed with 75 μl of E2335S17G (∼50,000 dpm) in Tris-HCl (25 mM, pH 7.4). The mixture was incubated in a rotating incubator at 37°C for 10 min, the predetermined time for linearity in formation of the product, 35SO2–4. The reaction was stopped by the addition of 150 μl of ice-cold acetonitrile. After centrifugation at 8000 rpm for 10 min, the supernatant was dried under gentle nitrogen. The reconstituted solution was injected into HPLC running program III (see under HPLC Methods) for desulfation of E2335S17G. The radioactivity in the outflow eluants was collected. We also used E1S to verify the desulfation activity in microsomes because we had previously demonstrated that [3H]E1S had yielded [3H]E1 in similar incubation studies (Tan and Pang, 2001). Hence, parallel studies were conducted to estimate sulfatase activity by formation of 35SO2–4 from E2335S17G and [3H]E1 from [3H]E1S. The desulfation intrinsic clearances were estimated as the ratio of desulfation rate to E2335S17G or [3H]E1S concentration at time 0.
Identification of the Metabolite
To identify the formed metabolites, bile samples obtained from liver perfusion studies conducted with unlabeled 0.5 μME217G were pooled and lyophilized. The residue was reconstituted with 10 mM ammonium acetate and acetonitrile (85%:15%, v/v) and injected into the HPLC column running at gradient program I (see below). The elution fractions of the same RT traced by peaks in previous radiochromatograms were collected and desalted by column chromatography through the reverse-phase Sep-Pak cartridge (Waters, Milford, MA). Upon removal of methanol in the collection, the sample was analyzed by electrospray ionization (ESI) mass spectrometry. Standards of E217G and E23S17G, added to blank bile were prepared in the same fashion and also subjected to mass spectral analysis.
HPLC Methods
A Shimadzu 6A HPLC system, comprising a SCL-6A system controller, a SPD-6A UV-visible detector, a SIL-6A automatic injector, and a LC-6A solvent delivery unit, and a CR-5A Chromatopac integrator were used. Separation was achieved by a 10-μm C18 reversephase column (4.6 × 250 mm, Alltech Associates, Deerfield, IL) and guard column (Waters Bondapak C18/Corasil 37–55 μm), with the detection wavelength at 280 nm. Mobile phase A (10 mM ammonium acetate, pH 5.0, adjusted with 10% acetic acid) and mobile phase B (acetonitrile) were delivered to HPLC system in a binary mode.
Three HPLC programs were developed. Program I, which consisted of 15% B at flow rate of 1 ml/min, was maintained for 13 min, followed by a linear increase of percent B from 15 to 22% at the flow rate to 1.2 ml/min within the next minute, that was maintained there until 24 min. The percent B was linearly increased to 50% over the next minute and maintained for another 10 min. Then the flow rate and percent B were returned to the initial conditions over 1 min and maintained for another 5 min. Program II used a constant flow rate of 1 ml/min and 15% B. At 13 min, the percent B was linearly increased to 18% over the next minute and maintained until 38 min. Then the percent B was returned to 15% over 2 min and maintained there for another 5 min. Program III used a constant flow of 1 ml/min and 10% B for the assay of samples from in vitro incubation studies.
Commercially available authentic standards were injected into the HPLC columns running the three programs (I, II, and III) to characterize the system in resolving the estrogen species. Program I was capable of separating E23S17G, E217G (same time as E23G), E23S (same time as E1S), E2, and E1. E23G, a metabolite of E2, interfered with E217G in program I. Typical retention times were 9 (E23S17G), 18 (E23G and E217G), 28 (E23S and E1S), 32 (E1), and 38 (E2) min with program I. Program II was able to separate E23S17G and E217/E23G, the two estrogens not separated well by program I. Typical retention times were 8 (E23S17G), 25 (E23G), and 30 (E217G) min with program II. Program III was capable of separating 35SO2–4 (RT ∼3 min) and E2335S17G (RT ∼18 min) well. All of the estrogens were stable at the pH and composition of the mobile phase examined (data not shown).
These HPLC programs were used to investigate the presence of E23S17G in blood perfusate or bile. The blood perfusate sample at 60 min was added acetonitrile (1:4, v/v), mixed for 10 s, and centrifuged at 4000 rpm for 5 min to precipitate protein. The resultant supernatant was extracted against toluene (1:1, v/v) to remove the acetonitrile. The remaining water layer was injected directly into the HPLC column running program I. Bile, diluted with H2O (1:10, v/v), was injected into the HPLC columns running programs I and II. E23S17G was found present only in bile and not perfusate. Hence a much simpler precipitation method with methanol (see below) was used to quantify the counts of E217G in blood perfusate.
Perfusion Samples. Blood perfusate samples (100–1000 μl) were made up to 1000 μl with blank perfusate and 4 ml of methanol and 100 μl of water were added, and the mixture was vortexed for 10 s and then centrifuged at 4000 rpm for 5 min. Four milliliters of the supernatant was removed into a 20-ml glass scintillation vial; after the addition of 16 ml of Ready Safe scintillation cocktail (Beckman Coulter Canada), the radioactivity was quantified by liquid scintillation counting. A calibration curve was prepared in identical fashion; varying numbers of disintegrations per minute (in 100 μl of water) of [3H]E217G were counted directly and also added to blank perfusate (1000 μl). Upon the addition of 4 ml of methanol and mixing, the resulting mixture was centrifuged. Again 4 ml of the supernatant was removed for counting. Bile was added to 200 μl of H2O; an aliquot was counted directly for the total radioactivity, and another aliquot of the diluted bile sample was injected into the HPLC column running program I. Unchanged [3H]E217G and [3H]E23S17G in the eluant fractions were pooled and quantified by liquid scintillation counting.
To assay for E217G and the metabolite in liver tissue, ∼2 g of peritumor or sham-operated liver tissues were homogenized with PBS (1:3, v/v) over ice. Tissue homogenates were deproteinized with acetonitrile (1:3, v/v) and centrifuged at 4000 rpm for 5 min. The supernatant was vortexed with toluene (1:1, v/v), and the resultant water layer was injected into the HPLC column running program I for separation of radioactive species. A calibration curve was constructed with [3H]E217G as the standard to track the recovery of the method and calculate total counts in liver tissue. Then the fractions of [3H]E217G and [3H]E23S17G in HPLC eluants were multiplied by the total counts in liver tissue to give disintegrations per minute of [3H]E217G and [3H]E23S17G in tissue samples.
Data Analysis
One-Compartment Model. Because a monoexponential decay was observed in all the liver preparations, the AUC was estimated by taking the initial concentration, C0, and dividing it by the rate constant of elimination (k), obtained from regression. The total hepatic clearance (CLhep) was calculated as dose/AUC. Because at the end of perfusion, >95% radioactivity was recovered in bile, the fractions of the radioactive E217G and E23S17G doses recovered in bile were multiplied to CLhep to estimate biliary (CLex) and metabolic (CLmet) clearances, respectively.
PBPK Modeling. A physiologically based pharmacokinetic model with a sinusoidal membrane barrier (Fig. 2) was used to fit the data for E217G in perfusate and E217G and E23S17G in bile obtained from recirculating perfusion experiments. Four compartments, including reservoir (of volume VR), liver sinusoids (of volume Vs), liver tissue (of volume Vt), and canalicular bile (of volume Vbile) compartments, are interconnected by blood flow or intrinsic clearances. E217G in reservoir exchanges with that in sinusoids via blood flow (Q). Sinusoidal E217G would be taken up into liver tissue (influx clearance, CLin), and E217G in liver tissue may be effluxed back (efflux clearance, CLef), sulfated (sulfation intrinsic clearance, CLint,sult), or excreted into bile (biliary intrinsic clearance, CLint,sec). The sulfated product may be desulfated to E217G (desulfation intrinsic clearance, CLint,desult{M}) or undergo biliary excretion (biliary intrinsic clearance for metabolite, CLint,sec{M}). E217G and E23S17G in canalicular bile and bile duct cannula were removed; the bile flow rate (Qbile) was also noted. The mass balance equations for this model are listed in the Appendix.

Physiological modeling of the liver, with the subcompartments, reservoir, liver blood, tissue, and bile, and transporters and enzymes underpinning the disposition of E217G in perfused rat liver preparations. E217G is administered into the reservoir. The liver preparation is modeled as four compartments, reservoir, liver blood, tissue, and bile. D and M denote the parent drug (E217G) and metabolite (E23S17G), respectively. Subscripts R, sin, t, and bile, are used to denote the reservoir, liver blood, tissue, and canalicular bile, respectively. The E217G and E23S17G species in the various compartments are interconnected by flow rates (Q and Qbile) or intrinsic clearances for transport and metabolism.
Fitting. Fitting was conducted with the program, Micromath Scientist 2.0 (St. Louis, MO). Mass balance rate equations (see Appendix) were used to fit the mean data of E217G in perfusate and E217G and E23S17G in bile in both sham-operated and tumor groups. The data were force-fitted to the physiologically based model (Fig. 2). Various weighting schemes (unity, 1/prediction, and 1/prediction2) were used.
Simulation. The fitted parameters obtained from PBPK modeling pertaining to the sham-operated rat livers were used to predict profiles of E217G and E23S17G in perfusate and bile in tumor liver perfusions. In brief, the CLin estimate for the sham group was decreased progressively from 0 to 20, 40, 60, and 80%. For all of the simulations, the CLint,sult estimate for the sham group was multiplied by the factor 1.41, because Sult1e1 protein expression from immunoblotting (see Results) in peritumor tissue of the tumor group was increased by 41%. All other estimates: CLint,sec, CLint,sec{M}, and CLint,desult{M} for the sham group were not altered in the simulation for predicting the profiles in the tumor group. Values of the volumes of the reservoir, liver blood, tissue, and bile, the flow rates for blood perfusate and bile, and the unbound fractions were the same as those listed in Table 3. The simulated values were compared with observations obtained from the tumor perfusion experiment.
Metabolic and biliary clearances of E217G, based on the fractions of dose of [3H]E23S17G (fE23S17G) and [3H]E217G (fE217G) recovered in bile at 120 min in recirculating liver perfusion studies of sham-operated (n = 4) and tumor-induced rats (n = 5), at 4 weeks after inoculation (flow rate of 12 ml/min)
Data are means ± S.D.
Statistical Analysis
The data are presented as mean values ± S.D. The two-tail Student's t test was used to compare the means, and a P value of < 0.05 was viewed as significant.
Results
Protein Binding and RBC Partitioning
The binding of E217G (0.25–50 μM) to BSA (1.25%) was concentration-independent within the concentration range studied. The unbound fraction (fu,p) was low and quite constant at 0.20 ± 0.01. RBC partitioning showed that E217G partitioned into red blood cells. Studies with the admixture of 40% RBC and 1% BSA with 1% BSA plasma perfusate containing [3H]E217G revealed high variability in the results because of the low RBC content for trapping of [3H]E217G. The situation was improved with the admixture of 80% RBC and 1% BSA with 1% BSA perfusate containing [3H]E217G. The resultant perfusate (Hct ∼0.3 and 0–25 μM E217G) revealed unequivocally the RBC distribution of E217G, albeit weak. The RBC partitioning concentration ratio (CRBC/Cplasma) was constant and was 0.20 ± 0.05 among the concentrations studied (<25 μM).
Identification of the Metabolite, E23S17G
A typical radiochromatogram of bile or perfusate with gradient program I is shown in Fig. 3A. Only one radioactive peak (RT ∼18 min), comigrating with the authentic standard, E217G, was observed for perfusate. In contrast, two radioactive peaks with RTs of 9 min (E23S17G) and 18 min (E217G or E23G) were detected in bile. Because program 1 separates E23S17G, E217G, E23S, and E2, the possibility of deglucuronidation of E23S17G and E217G to E23S and E2, respectively, may be examined. Indeed, a small radiolabeled peak (<1% total radioactivity in sample), occurring roughly at 29 min, which comigrated with authentic E23S, was observed. The observation suggests that the deglucuronidation of E23S17G to E23S is negligible. The HPLC analysis with program II for the bile samples confirmed absence of radioactivity at ∼25 min, where E23G was expected to elute (Fig. 3B). The two radioactive peaks corresponded to E23S17G (∼8 min) and E217G (∼30 min). The unknown metabolite, presumably E23S17G, was detected in bile rather than perfusate. The identity of the unknown metabolite was recognized as a molecular ion peak m/z of 263.1 in ESI mass spectrometry and corresponded to authentic E23S17G (C24H30O11S2–) (data not shown).

Radioelution chromatograms for bile (•) and end perfusate (○) in the HPLC system. In A, bile and perfusate samples were assayed by HPLC columns running program I. Peak 1 (RT ∼9 min) was present in the assay for bile rather than perfusate and corresponded to E23S17G, as identified by ESI mass spectrometry. The identity for the peak 2 (RT ∼18 min), however, may be assigned either to E217G or E23G. In B, bile samples, injected into HPLC columns running program II, confirmed the presence of the metabolite as E23S17G (RT ∼8 min). The other radioactive species in bile was E217G (RT ∼30 min).
Futile Cycling: Sulfatase Activity in Subcellular Fractions
The retention time of the E2335S17G deviated slightly from that of the E2335S17G standard in buffer because of the presence of different matrices during workup from the microsomal and cytosolic incubation samples (Fig. 4). Only the microsomal but not the cytosolic fraction demonstrated desulfation activities toward E2335S17G to form the product, 35SO2–4, as shown in the HPLC tracings. However, the desulfation activities toward E2335S17G as well as [3H]E1S, a model substrate to demonstrate microsomal activity of arylsulfatases, were not significantly different in microsomal fractions prepared from peritumor liver and sham-operated liver tissues (Table 2). The desulfation activity toward E2335S17G was low in relation to that for E1S.
Desulfation activities or intrinsic clearances toward E2335S17G and [3H]E1S (for confirmation of desulfation activity) in microsomal fractions, prepared from sham-operated and peritumor tissue at 4 weeks postinoculation
Data are means ± S.D.
Immunoblots
The immunoreactive bands for expression of the transporters and enzymes in peritumor tissue of metastatic liver and sham-operated tissue for hepatic disposition of E217G are shown in Fig. 5A, and the integrated densitometric results are summarized in Fig. 5B. There was decreased expression of Oatp1a1 (42%) and Oatp1b2 (38%) but increased Sult1e1 (41%) in peritumor tissue in the metastatic liver (P < 0.05). In contrast, expression levels of other transporters (Oatp1a4 and Mrp2) and enzymes (Sult1a1 and Sult2a1) were not significantly altered.

Radioelution chromatograms of products derived from incubation of E2335S17G with Tris-HCl buffer (□), and cytosolic (•) or microsomal (○) fractions. The retention times of E23S17G (∼18 min, ▪) and 35SO2–4 (∼3 min) were coincident with those obtained upon injection of the standards, E2335S17G and  , into the HPLC column. Desulfation of E2335S17G in microsomes but not cytosol nor buffer, albeit of low activity, was observed.

Immunoblots (A) and integrated densitometric analysis (B) of crude membrane fractions (for Oatps and Mrp2) and cytosolic fractions (for Sults) prepared from sham-operated rat liver tissue (n = 4) and peritumor tissue of metastatic rat livers (n = 5) at 4 weeks postinoculation. *, P < 0.05 between sham-operated and peritumor tissue.
Liver Perfusions
MID. The dilution profiles of the noneliminated reference indicators were unimodal and displayed progressive dispersion for labeled red blood cells, albumin, sucrose, and then water for the sham-operated liver (Fig. 6A) and tumor-bearing liver (Fig. 6B). The dilution profile of E217G peaked in between those of the labeled RBC and albumin curves for all of the studies, confirming the presence of RBC binding of E217G; these were similar for both the sham-operated liver and the tumor-bearing liver (Fig. 6, A and B). The plot of ln(hypothetical reference/E217G) versus time provides a reasonable estimate of the influx clearance (eq. 4, because the binding characteristics of the extracellular E217G reference had been properly considered with eq. 3) (Xu et al., 1994). Representative “ln-ratio” plots for the sham-operated and metastatic rat liver preparations are shown in Fig. 6C. The influx clearances, estimated from the slopes of ratio plots for sham (n = 3) and tumor (n = 4) groups, were not significantly different (193 ± 64 versus 236 ± 71 ml/min). However, levels of E217G were low (Fig. 6, A and B), rendering less reliability in the influx clearance estimates. For this reason, MID studies were discontinued, and the recirculating design was used for characterization of the disposition of E217G with greater tumor scores.
In Situ Recirculating Rat Liver Perfusion. For both sham-operated and metastatic rat livers, E217G decayed in the perfusate rapidly and monoexponentially with similar elimination rate constants (0.053 ± 0.008 versus 0.048 ± 0.005 min–1) (Fig. 7A). There was no significant difference in bile flow rates (>5 μl/min) in both sham-operated and metastatic rat liver preparations (data not shown). Moreover, the recovery of the volumes (>90%) and doses was excellent, suggesting good viability of the liver preparations. The radioactive dose was recovered predominantly in bile in the form of E217G and E23S17G, the only metabolite detected (Fig. 7B). However, a significantly higher fraction of E23S17G (fraction of dose, P < 0.05) was cumulated in the bile of metastatic rat livers compared with that of sham-operated rat livers. The results, summarized in Table 3, demonstrate that, despite the similar CLhep and CLex values, CLmet was elevated in metastatic rat livers (P < 0.05).
PBPK Modeling. The PBPK model depicted in Fig. 2 was adequate to fit the perfusion data, as shown in Fig. 7B, when it was assumed that CLin and CLint,sult differed between tumor and sham groups but other clearances were shared by both groups. The assumption was based on immunoblotting and in vitro incubation results. The sinusoidal (Vs) and liver tissue volumes (Vt) at 4 weeks postinoculation, obtained experimentally from previous MID studies, were used (Liu et al., 2006). The values of some parameters were assigned, and some were directly measured experimentally or taken from references (Table 4). For simplicity, the unbound fractions of E217G (ft) and E23S17G (ft{M}) in liver tissue were assumed to be the same as the unbound fraction of E217G in plasma (0.2). The CLin estimates, derived from the ratio plots of the MID studies, were used as initial estimates.
Assigned parameters in physiological model for fitting of the E217G and E23S17G data from recirculating perfused metastatic and sham-operated rat liver preparations at 4 weeks postinoculation
The fitted parameters are listed in Table 5. A very small value was obtained for CLef (6 × 10–15 ± 1.5 × 10⁻¹⁰ ml/min) with fitting. Upon repetition of the fitting procedure by setting CLef to 0, values of the fitted parameters remained similar to those when CLef was included as a fitted parameter. A higher model selection criterion was obtained upon reduction of CLef as 0, suggesting that the fit was optimal. In addition, good correlation was observed between observations and predictions (Fig. 7, A and B). The estimates of CLin in the metastatic liver were decreased roughly 48% (546 ± 172 versus 283 ± 50 ml/min), whereas the estimate of CLint,sult in the tumor group was 44% higher (3.69 ± 2.79 versus 2.56 ± 1.94 ml/min) than that of the sham-operated group. Both of these findings correlated well with immunoblotting results on expression levels of Oatp1a1/Oatp1b2 and Sult1e1, respectively (Fig. 5). Values of CLin in sham and tumor groups were 20 to 40 times the value of the blood flow rate (12 ml/min) and were of similar order to those of CLin estimated from the ln-ratio plot from the MID studies (Fig. 6C). The desulfation clearance was estimated to be 1.19 ± 0.62 ml/min. Fitting results also suggested that E217G exhibited a higher biliary secretory intrinsic clearance than E23S17G (1.55 ± 0.61 versus 0.88 ± 0.27 ml/min), as was also supported by the extent of excretion (Fig. 7B; Table 5).
Assigned or fitted parameters from force-fitting of the E217G and E23S17G data from the in situ recirculating perfused metastatic and sham-operated rat liver preparations at 4 weeks postinoculation with a physiological model
Data are fitted parameters ± S.D.

Representative MID outflow dilution curves of sham-operated (A) and tumor-bearing (B) livers and ln-ratio plots (C) for MID conducted on rat livers at 3 weeks postinoculation. Because the MID dilution curves for the noneliminated indicators of the sham-operated and metastatic tumor livers were similar, a MID curve for sham-operated (A) or tumor-bearing (B) rat liver preparations at 3 weeks postinoculation were shown, and similar dilution profiles were observed. The different noneliminated reference indicators, RBC (○), BSA (□), sucrose (▿) and D2O(+), were eluted in sequence. The diffusible solute, E217G (▵), emerged between that of RBC and BSA and was attenuated because of rapid entry and hepatocellular removal. The natural logarithmic ratio [ln (hypothetical reference/E217G)] versus the early time points for the sham-operated ( ) and metastatic (
 ) rat livers are shown in C; slopes showing similar k12 or influx coefficients were observed for the sham-operated and tumor-bearing liners.

Fitting of data from perfusion studies of metastatic tumor livers (n = 5) and sham-operated livers (n = 4) at 4 weeks postinoculation to a one-compartment model (A) or a physiologically based pharmacokinetic model (B). Solid and open symbols are to denote the sham-operated and metastatic tumor groups, respectively. In A, E217G in blood perfusate decayed monoexponentially, as shown by the fitted lines (— for the sham-operated group and – – – for the metastatic tumor group). In B, the E217G data (•, ○) in perfusate and E217G (▴, ▵) and E23S17G (▾, ▿) cumulated data in bile were adequately predicted by the PBPK model described in Fig. 2 (— for the sham-operated group and – – – for the metastatic tumor group). *, P < 0.05 for the cumulative biliary excretion of [3H]E23S17G between sham-operated and metastatic tumor groups.
Simulation
Consistency between the sham and tumor data were observed (Fig. 8). The simulated results, based on an up-regulation of CLint,sult (41%) and decreases in CLin (0 to 80%) in the sham estimates, showed that decreases up to 40% failed to induce changes in the decay profile of E217G in the reservoir perfusate or appearance of E217G and E23S17G in bile. The reason is the extremely high CLin for E217G such that influx is not rate-limiting. Beyond the 40% decrease in CLin, a slower decay of E217G in perfusate and lesser excretion as well as metabolism resulted (Fig. 8). The simulation clearly showed that E217G entry into hepatocytes is extremely rapid, and CLin is not the rate-limiting step for either metabolism or excretion of E217G for the sham-operated and tumor bearing livers.
Discussion
Liver metastasis of colorectal carcinoma is accompanied by cell adhesion and arrest, extravasation, angiogenesis, and proliferation and is often associated with altered expression of cytokines and vascular endothelial growth factors (Rudmik and Magliocco, 2005). After the first 24 h of liver tumor induction by intraportal injection of murine lung carcinoma H-59 and human colorectal carcinoma CX-1, levels of the tumor necrosis factor α and interleukin-1α rapidly increased then declined (Khatib et al., 2005). Moreover, the host proinflammatory response triggered by metastasis is tumor-specific and persists at the first 24 h of metastasis (Khatib et al., 2005). These inflammation responses will not be sustained at the 4th week after inoculation, as in our study. CC531 is a cancer cell line with poor immunogenicity and may not induce the proinflammatory response as do other carcinomas. Nonetheless, it is prudent to include the sham-operated group to nullify the cytokine effect for proper comparison because surgery may evoke changes in cytokines and therefore transporters and enzymes.
E217G is an excellent solute for the examination of changes in transporters and enzymes with the rat tumor model. Sulfation of E217G to form E23S7G was suggested by Meyers et al. (1980). E217G transport has been well characterized. Transport in the rat liver is mediated by Oatp1a1, Oatp1a4, and Oatp1b2 (Noé et al., 1997; Cattori et al., 2001). Uptake parameters from rat hepatocytes, Vmax [1.62 nmol/min/mg protein, scaled-up to the 9-g liver according to Tan et al. (2001)] and Km (45.5 μM) (Brock and Vore, 1984), suggest an uptake clearance (CLin) of 32 ml/min. The Km values of E217G uptake in Oatp1a1-transfected systems varied from 3 to 20 μM (Kouzuki et al., 1999; Ishizuka et al., 1998), whereas that for Oatp1a4 in Xenopus laevis oocytes and LLC-PK1 cells was 3 to 17 μM (Noé et al., 1997; Sugiyama et al., 2001). But the Km of E217G uptake by Oatp1b2 was higher (32 μM) (Cattori et al., 2001). These Km values were lower than that reported by Brock and Vore (1984). Biliary excretion of E217G via Mrp2 was established in Eisai hyperbilirubinemic rats (Takikawa et al., 1996). Biliary excretion of the metabolite, E23S17G, has been attributed to Mrp2, because the excretion of E23S17G in bile was greatly reduced in Eisai hyperbilirubinemic rats (Takikawa et al., 1996). The excretion of E23S17G may also be mediated by Bcrp, and failure to recognize the contribution by Bcrp may overestimate the role of Mrp2 in the biliary excretion of phase II conjugates (Ninomiya et al., 2005).
In this study, a modest binding to albumin and red blood cell distribution of E217G were found. The identity of the metabolite, E23S17G, was confirmed unequivocally with mass spectrometry and microsomal incubation studies with the radiolabeled E2335S17G that was deconjugated by arylsulfatase C (also known as estrogen sulfatase) to reform E217G and 35SO2–4 (Fig. 4), providing direct evidence of futile cycling between E23S17G and E217G. The finding mirrored the interconversion of other estrogens, between E1S and E1 (Milewich et al., 1984; Tan et al., 2001). Desulfation of E23S17G was not saturated at concentrations up to 600 μM (data not shown), alluding to the low affinity of E23S17G for arylsulfatase C. E23S17G was absent in perfusate, suggesting that the activities of Mrp3 or Mrp4 at the basolateral membrane must be very low. Moreover, perfusion of E23S17G in the presence of a constant infusion of 35SO2–4 to establish desulfation-resulfation failed to result in radiolabeled or unlabeled E23S17G in bile, inferring absence of transport of E23S17G into hepatocytes by the Oatps (data not shown). Thus, unlike futile cycling for other estrogens (Tan et al., 2001), the interconversion between E217G and E23S17G is not as extensive because of rapid excretion and low desulfation activity.
A rapid uptake clearance for E217G was observed in livers at 3 weeks (MID study) and 4 weeks (recirculating livers) postinoculation. From MID studies, CLin was ∼190 to 230 ml/min, a value that is almost 20 times the flow rate. Even higher CLin values were revealed by PBPK modeling (546 and 283 ml/min for sham and tumor groups at 4 weeks, respectively, Table 5). Because there was lower reliability of the MID estimate due to low E217G levels in the ratio plot, the estimates obtained from PBPK fitting are clearly superior. The CLin estimate from fitting was much higher than the scaled-up CLin (∼32 ml/min) from hepatocyte suspension, a discrepancy conjectured to be due to strain differences in E217G uptake.
With tumor development, protein levels of Oatp1a1 and Oatp1b2 were reduced (∼40% of sham-operated), whereas that of Oatp1a4 was unchanged (Fig. 5). Although down-regulation of Oatp1a1 and Oatp1b2 was observed, the uptake clearance of E217G remained very high and was not the rate-limiting step in the overall removal, as confirmed by simulations (Fig. 8). Fitting of the PBPK model to the data revealed a decrease of CLin (48%) in the tumor group versus the sham group that is consistent with the decreased expression of Oatp1a1 (42%) and Oatp1b2 (38%). The parallelism between results from immunoblotting and PBPK estimates and simulation suggests a lesser role for Oatp1a4 in the uptake of E217G.
With tumor development, protein levels of estrogen sulfotransferase, Sult1e1, were increased by 41%, whereas those for Sult1a1 and Sult2a1 were unaltered (Fig. 5). The regulation of SULT1E1 by cytokines is controversial. The mRNA and activity of SULT1E1 was up-regulated by interleukin-1β in cultured human vascular smooth muscle cells (Nakamura et al., 2003). Microarray analysis of microvascular endothelial cells treated with vascular endothelial growth factor showed increased SULT1E1 (Yoon et al., 2006). But the cytokine effect may not be sufficient to explain the increased Sult1e1 and attenuated Oatp1a1 and Oatp1b2 at the late stage of liver metastasis (in our case, 4 weeks postinoculation). It is not known why metastasis resulted in increased biotransformation efficiency, as the up-regulation of Sult1e1 in our case. Up-regulation of metabolic enzymes in the neoplastic region has been observed for the glutathione S-transferase Pi as a mechanism to exert multidrug resistance in reducing intracellular anticancer drug levels (Sheweita and Tilmisany, 2003; Sakai and Muramatsu, 2005; Kashida et al., 2006). Because increased Sult1e1 in peritumor tissue was found, the concept of “multidrug resistance” may now be optionally extended to the peritumor tissue. The regulatory factors induced by tumors may stimulate host cells in the peritumor region and alter expression levels of transporters and metabolic enzymes, either directly or through signaling cascades. Formation of intrahepatic shunts and capillarization of sinusoids were observed in other liver diseases such as cirrhosis (Villeneuve et al., 1996), and impaired expression of influx (OATP and NTCP) and canalicular (MRP2 and BSEP) transporters and adaptive up-regulation of basolateral efflux transporters (MRP3 and MRP4) (Trauner et al., 2005) resulted in cholestasis.
In the metastatic liver model inoculated with N-methyl-N-nitrosoguanidine-induced colonic adenocarcinoma cells, the contribution of portal blood to the liver tumor blood supply was 16% when tumors were small and declined to 4% when tumors grew larger without compensation for the withdrawal of tumor arterial blood supply after dearterialization (Wang et al., 1994). The malignant tissue in liver tumor is mostly nourished by the hepatic arterial blood. In the liver metastatic CC531 model, fluorescein isothiocyanate-labeled RBC, infused into the portal vein of the perfused rat metastatic liver, failed to gain noticeable access into tumor region microscopically (H. Sun, L. Liu, K. S. Pang, unpublished data). By design, with ligation of the hepatic artery in the portally perfused rat liver preparation, E217G would gain access only via the portal vein into the peritumor tissue instead of the tumor region, and the kinetics of E217G would reflect the microcirculation and biochemical alterations in the peritumor tissue.
In comparison with our previous study in which levels of Oatp1a1 and Sult1e1 were unchanged (Liu et al., 2006), the present livers exhibited higher tumor scores at week 4 and changes in enzymes and transporters began to surface. There were notable decreases in Oatp1a1 and Oatp1b2, and increased estrogen sulfation activity due to increased Sult1e1 protein was reported for the first time with tumor progression (Fig. 5). These changes suggest that the metastatic liver tumor model displayed changes in enzymes and transporters that are commensurate with the severity of tumor progression and not with the time postinoculation. Indeed, upon comparison (Fig. 9), increased trends in Sult1e1 with tumor score persisted, whereas the decrease of Oatp1a1, although present, was not significant between metastatic rat livers with high tumor scores (++++ and ≥ ++++++) and those with less tumor scores (+ and ++). Surprisingly, an increasing trend in Mrp2, although failing to show significance, also surfaced (Fig. 9). The decrease in sinusoidal transport failed to evoke changes in total clearance of E217G, inasmuch as the influx clearance of E217G remained extremely high and not rate-determining. The increase in Sult1e1 brought about increased metabolic clearance of E217G; a slight and insignificant compensatory decrease in biliary clearance and a slight but insignificant increase in total clearance were also noted (Table 3). These changes in transporter and enzyme activities, shown in Western blotting, were well predicted by the PBPK model on the interplay of enzymes and transporters. The observations imply an important role for modeling in predicting drug disposition and drug resistance associated with liver tumors.

Simulated profiles of E217G in blood perfusate (A) and E217G (B) and E23S17G (C) in bile in perfused metastatic rat livers at 4 weeks postinoculation. Estimates of the intrinsic clearances from the sham-operated liver preparations (Table 4; CLef = 0), together with a higher CLint,sult (41% increase, as in tumor group) but decreased CLin (down-regulated by 0, 20, 40, 60, and 80%) were used for simulation of the profiles in tumor groups. The values for compartment volumes and blood and bile flow rates in tumor groups used for simulation were the same as those in Table 3. Solid line, unchanged CLin; dotted, medium dashed, short dashed, dashed-dot, and dashed-dot-dot lines are associated with reductions in CLin of 0, 20, 40, 60, and 80% respectively. The simulated data were presented against data from the metastatic rat livers, and good prediction was observed when CLin retained 60% of its original value.

Immunoblots (A) and integrated densitometric analyses (B) of transporters (Oatps and Mrp2) and estrogen sulfotransferase (for Sult1e1) in peritumor tissue of metastatic rat livers of different tumor scores (for each category of tumor score, n = 3). The immunoblot analyses included samples from the present study and those of Liu et al. (2006). *, P < 0.05 between lower tumor scores (+ and ++) and higher tumor scores (++++ and ≥++++++).
Appendix
Mass Balance Equations for a Well-Stirred Model with Sinusoidal Barrier to Fit E217G and E23S17G in Perfused Rat Livers at 4 Weeks Postinoculation
For the rate of change of E217G amount in reservoir blood (subscript R), 
For the rate of change of E217G concentration in liver sinusoid (subscript b),  where
where 
For the rates of change of E217G and E2S17G concentrations in liver tissue (subscript t),  and
and 
For the rates of change of E217G and E2S17G concentrations in canalicular bile (subscript bile),  and
and 
For the rates of change of E217G and E2S17G amounts in collected bile samples (subscript bile,ex),  and
and 
Acknowledgments
We thank Dr. Andreas J. Schwab (McGill University, Montréal, QC, Canada) for his insight and great assistance in analysis of the MID data. We also thank Dr. Peter J. K. Kuppen (Department of Experimental Surgery, Leiden University Medical School, Leiden, The Netherlands) and Dr. Gerard J. Mulder (Department of Pharmacology, Leiden University, Leiden, The Netherlands) for establishment of the CC531 tumor model.
Footnotes
-
This work was supported by the Canadian Institute for Health Research Grant MOP 64350.
-
Article, publication date, and citation information can be found at http://jpet.aspetjournals.org.
-
doi:10.1124/jpet.106.108860.
-
ABBREVIATIONS: MRP, multidrug resistance-associated protein; E217G, estradiol 17β-d-glucuronide; Oatp, rat organic anion transporting polypeptide; Mrp, rat multidrug resistance-associated protein; Bcrp, rat breast cancer resistance protein; E23S17G, estradiol 3-sulfate-17β-d glucuronide; E1, estrone; E1S, estrone 3-sulfate; KHB, Krebs-Henseleit buffer; HPLC, high performance liquid chromatography; E2, estradiol; E23G, estradiol 3-glucuronide; E23S, estradiol 3-sulfate; BSA, bovine serum albumin; Sult, rat sulfotransferase; RBC, red blood cell; Hct, hematocrit; PBS, phosphate-buffered saline; MID, multiple indicator dilution; AUC, the area under the concentration-time curve; RT, reaction time; ESI, electrospray ionization; PBPK, physiologically based pharmacokinetic.
- Received June 2, 2006.
- Accepted August 7, 2006.
- The American Society for Pharmacology and Experimental Therapeutics


