


Abstract
17α-Ethynylestradiol (EE) inactivates cytochrome P450 3A5 (3A5) in the reconstituted system in a mechanism-based manner. The inactivation is dependent on NADPH, and it is irreversible. The inactivation of 3A5 by EE is also dependent on cytochrome b5 (b5). The values for the KI and kinact of the 7-benzyloxy-4-(trifluoromethyl)coumarin O-debenzylation activity of 3A5 are 26 μM and 0.06 min–1, respectively. Incubation of 3A5 with EE resulted in a 62% loss of catalytic activity, 60% loss in the reduced CO difference spectrum, and 40% decrease in native heme with the formation of a heme adduct. The partition ratio was ∼25, and the stoichiometry of binding was ∼0.3 mol of EE metabolite bound/mol of P450 inactivated. Four major metabolites were formed during the metabolism of EE by 3A5. SDS-polyacrylamide gel electrophoresis analysis demonstrated that [3H]EE was irreversibly bound to 3A5 apoprotein. Liquid chromatography-tandem mass spectrometry analysis (LC-MS/MS) revealed that two glutathione (GSH) conjugates with m/z values of 620 were formed only in the presence of b5. These two conjugates are formed from the reaction of GSH with the ethynyl group with the oxygen being inserted into either the internal or terminal carbon. A heme adduct with the ion at m/z 927 and two dipyrrole adducts with ions at m/z 579 were detected by LC-MS/MS analysis. In conclusion, 3A5 can activate EE to a 17α-oxirene-related reactive species that can then partition the oxygen between the internal and terminal carbons of the ethynyl group to form heme and apoprotein adducts, resulting in the inactivation of P450 3A5.
Cytochrome P450 3A4 (3A4) and cytochrome P450 3A5 (3A5), the two most abundant P450 enzymes in human liver and intestine, and which exhibit approximately 85% sequence identity, are estimated to metabolize more than 60% of clinically important drugs and to exhibit significant overlaps in substrate specificity. Because the overall metabolic rate of 3A5 for many substrates is much lower than that of 3A4, the contribution of 3A5 to drug and xenobiotic metabolism has generally been considered to be not particularly significant (Wrighton et al., 1990). However, because 3A5 exhibits significant genetic polymorphisms, wide tissue distribution, and high interindividual/interracial variability in expression, 3A5 may, in fact, be a much more important contributor to variability in human metabolism of drugs, endogenous substrates, and carcinogens than had been reported previously (Kuehl et al., 2001; Koch et al., 2002; Huang et al., 2004). The metabolism of 17α-ethynylestradiol (EE), the major estrogenic component in most oral contraceptives, has been extensively investigated for more than half-a century. Although previous studies had reported that 3A5 cannot metabolize EE (Wrighton et al., 1990), the ability of 3A5 to catalyze the metabolism of EE to 2-OH-EE has been shown recently (Wang et al., 2004). Some of the differences in these metabolic capabilities observed between 3A4 and 3A5 may have resulted from the experimental conditions used (Huang et al., 2004). Because EE has been proven previously to be an effective mechanism-based inactivator of 3A4 (Lin et al., 2002), it is interesting to elucidate in detail the pathways for the metabolism of EE by 3A5 and the mechanism(s) by which it inactivates this P450.
The importance of the acetylenic group in EE for the inactivation and destruction of the heme in rat liver cytochrome P450 was first noted almost three decades ago (White and Muller-Eberhard, 1977). The initial studies in liver microsomes from phenobarbital-induced rats clearly demonstrated the covalent binding of ethynylsterols to the prosthetic heme moiety (Ortiz de Montellano et al., 1979; Ortiz de Montellano and Kunze, 1980). Later, the covalent binding of other acetylenic compounds to the apoprotein was demonstrated (Gan et al., 1984; CaJacob et al., 1988; Hammons et al., 1989; Chan et al., 1993; Roberts et al., 1993). It was proposed that P450 inactivation by the ethynyl compounds involves the initial oxygenation of the ethynyl groups (Kunze et al., 1983; Ortiz de Montellano and Komives, 1985; CaJacob et al., 1988; Chan et al., 1993). Whether the inactivation was due to alkylation of prosthetic heme or to modification of the apoprotein was determined by the site of addition of the oxygen to either the internal or terminal carbon of the carbon–carbon triple bond, respectively. However, the factors determining to which carbon of the triple bond the oxygen is transferred, and whether heme or protein modification or both occur, are not clear. An inactivation mechanism involving both heme destruction and covalent binding of inactivator to apoprotein was first characterized for the inactivation of P450 2B1 by secobarbital (He et al., 1996). Subsequently, similar phenomena involving heme and apoprotein modification were found during EE inactivation of 3A4, t-butyl acetylene-inactivation of P450 2E1, and the inactivation of P450 3A and 2B subfamilies by bergamottin (Lin et al., 2002; Blobaum et al., 2002; Lin et al., 2005). In some cases, the masses of the heme and the apoprotein adducts have been determined.
Interestingly, it was found that cytochrome b5 (b5) was required for the inactivation of 3A5 but not 3A4 by EE. Because both heme and protein modifications occur during the inactivation of 3A4 and 3A5, the possibility that two different forms of reactive species were formed during the inactivations was investigated. To address this issue, glutathione (GSH) was used to trap electrophilic reactive intermediates of EE formed during the metabolism and inactivation of both P450 3A4 and 3A5 in the reconstituted system. The resulting GSH conjugates were then characterized using standard liquid chromatography-tandem mass spectrometry (LC-MS/MS) approaches (Baillie and Davis, 1993; Samuel et al., 2003).
That inactivation of 3A5 by EE is b5-dependent has led to some very interesting observations and some valuable conclusions. We report here that 3A5 not only metabolizes EE to four metabolites but also catalyzes the bioactivation of the carbon–carbon triple bond of EE, leading to heme destruction and covalent binding of EE to the apoprotein. In addition, the structures of two GSH conjugates formed during the metabolic activation of the ethynyl moiety by 3A5 in the presence of b5 have been determined.
Materials and Methods
Chemicals. NADPH, EE, and GSH were purchased from Sigma-Aldrich (St. Louis, MO). 2-OH-EE was a generous gift from Dr. William Slikker (Department of Health and Human Services, Food and Drug Administration, Jefferson, AR). 7-Benzyloxy-4-trifluoromethyl(coumarin) (BFC) and 7-hydroxy-(trifluoromethyl)coumarin were obtained from Invitrogen (Eugene, OR) and Indofine Chemical Co., Inc. (Hillsborough, NJ), respectively. [6,7-3H]EE (46.2 Ci/mmol) was obtained from GE Healthcare (Little Chalfont, Buckinghamshire, UK). All other chemicals and solvents were of the highest purity available from commercial sources.
Purification of Enzymes. The plasmid for P450 3A5 was a generous gift from Dr. J. R. Halpert (University of Texas Medical Branch, Galveston, TX) and was expressed as an His-tagged protein in Escherichia coli Topp 3 cells (Domanski et al., 2001). P450 3A4 and NADPH-cytochrome P450 reductase (reductase) were expressed in E. coli DH5α and Topp 3 cells, respectively. Cytochrome b5 was purified from liver microsomes of phenobarbital-treated Long-Evans rats. The purification procedures for all of the proteins were described previously (Lin et al., 2005).
Enzyme Assay and Inactivation. The primary reaction mixture contained 60 μg of a mixture (1:1:1) of l-α-dilauroyl-phosphocholine, l-α-dioleyl-sn-glycero-3-phosphocholine, and l-α-phosphatidylserine, 1 nmol of 3A5, 2 nmol of reductase, 1 nmol of b5, 100 units of catalase, and 2 mM GSH in 1 ml of 50 mM HEPES buffer, pH 7.5, containing 20% glycerol, 30 mM MgCl2, and 0.5 mM EDTA. The reconstituted system was incubated at room temperature for 30 min and then kept on ice until used for the experiments. For the studies on the concentration- and time-dependent inactivation of 3A5 by EE, the reactions were initiated by adding 1 mM NADPH to the primary reaction mixture containing various concentrations of EE at 37°C. At the time points indicated, 10-μl aliquots were transferred into 990 μl of a secondary reaction mixture containing 50 μM BFC and 200 μM NADPH in 200 mM potassium phosphate buffer, pH 7.7. Incubations were carried out for 15 min, and the reactions were terminated by the addition of 365 μl of 0.1 M Tris in 80% acetonitrile. The formation of the 7-hydroxy-(trifluoromethyl)coumarin product was determined by fluorescence measurement (excitation, 409 nm; emission, 530 nm) using an RF-5301PC spectrofluorophotometer (Shimadzu, Kyoto, Japan). All samples were done in duplicate.
Partition Ratio. EE at concentrations ranging from 2.5 to 300 μM was added to the primary reaction mixture containing the reconstituted system with 1 μM 3A5. The reaction mixtures were initiated by the addition of 1 mM NADPH and incubated at 37°C for 1 h, allowing the inactivation to go to completion (Silverman, 1996). Aliquots were removed and assayed for residual BFC activity as described above.
Metabolism of EE. 3A4 and 3A5 (1 nmol) were reconstituted in the absence or presence of 1 nmol of b5 and incubated with 100 μM EE at 37°C for 30 min. The samples were then extracted with 4 ml of ethyl acetate, and the ethyl acetate extracts were dried under N2. The metabolites were dissolved in 0.1% acetic acid/50% acetonitrile and then separated by HPLC on a Microsorb-MV C18 column (5 μm; 4.6 × 250 mm; Varian, Palo Alto, CA) using a solvent system consisting of solvent A (0.1% acetic acid in water) and solvent B (0.1% acetic acid, 29.9% methanol, and 70% acetonitrile) starting with 40% B for 5 min, followed by a linear gradient from 40 to 50% B for 5 min, and then to 55% B for the next 20 min, and finally to 95% B for an additional 10 min at a flow rate of 1 ml/min. The eluate was monitored at 280 nm on a Waters HPLC with a 490E multiwavelength detector (Waters, Milford, MA).
Spectral Analysis. After incubating the primary reaction mixture containing 3A5 in the reconstituted system with 100 μM EE in the control (–NADPH) or inactivated samples (+NADPH) at 37°C for 20 min, the reduced CO difference spectra of aliquots containing 0.2 nmol of P450 were determined by scanning from 400 to 500 nm on a UV-2501PC spectrophotometer (Shimadzu) as described by Omura and Sato (1964). Aliquots from each reaction mixture were also removed to determine the catalytic activity for the metabolism of BFC as described previously. To test whether the inactivation by EE was irreversible, the control and inactivated samples were dialyzed overnight at 4°C against l liter of 50 mM potassium phosphate buffer, pH 7.5, containing 20% glycerol and 0.1 mM EDTA. The samples were then reanalyzed for enzymatic activity and reduced CO difference spectra as described previously.
Stoichiometry and Specificity of Binding. The control (–NADPH) and inactivated (+NADPH) samples were incubated in the reconstituted systems as described previously with 100 μM [3H]EE at 37°C for 30 min. Aliquots containing 0.1 nmol of P450 were removed and mixed with 10 mg of bovine serum albumin, and the proteins were precipitated by adding a 5-fold volume of 5% sulfuric acid in methanol (Chan et al., 1993). The washing and precipitation were repeated at least six times until the radioactivity in the supernatant was essentially at background level. The resulting pellets were dissolved in 1 N NaOH and incubated at 60°C for 1 h, and then the radioactivity was determined on a Beckman LS 5801 liquid scintillation counter (Beckman Coulter, Fullerton, CA) using Econo-Safe counting cocktail (Research Products International Corp., Mount Prospect, IL). For SDS-PAGE analysis, the control and inactivated samples were initially incubated with 40 μM[3H]EE at 37°C for 30 min. Samples containing 50 pmol of P450 were resolved on 10% polyacrylamide gels. The gels were treated with EN3HANCE autography enhancer (PerkinElmer Life and Analytical Sciences, Boston, MA) and then dried on 3-mm chromatography paper. The dried gels were exposed to Kodak BioMax MS film (Eastman Kodak, Rochester, NY) at –80°C for 2 weeks before developing.
Digestion of the Labeled-Apoprotein with Lysyl Endopeptidase. The His-tagged 3A5 can be separated from the reductase and catalase after inactivation by [3H]EE in the reconstituted system by chromatography on a His-tagged Ni-NTA agarose affinity column. Following elution from the Ni-NTA column, the repurified control and inactivated 3A5 samples were dialyzed and digested with lysyl endopeptidase (Lys C) ([1:25 w/w] Lys C/P450). The peptides were dissolved in 0.1% formic acid/50% acetonitrile, and then they were separated on a 4.6 × 250-mm Vydac C18 protein/peptide reverse phase column. The solvent system consisted of buffer A (0.1% formic acid in H2O) and buffer B (0.1% formic acid in acetonitrile). The column was eluted with a linear gradient from 25 to 60% B over 50 min and then to 95% B for an additional 20 min at a flow rate of 1 ml/min. Fractions (1 ml) were collected and the radioactivity was determined by liquid scintillation counting as described above.
HPLC Separation and Spectral Analysis of the Heme Adducts. An HPLC system with a Waters 600E system controller was used to investigate the loss of native heme and the formation of heme adducts. Control and inactivated samples (100 pmol of P450), prepared as described for the spectral analysis studies, were analyzed using a C4 reverse phase column (5 μm; 4.6 × 250 mm; 300 Å; Phenomenex, Torrance, CA). The solvent system consisted of solvent A (0.1% TFA in water) and solvent B (0.05% TFA in acetonitrile). The column was eluted with a linear gradient from 30 to 80% B over 30 min at a flow rate of 1 ml/min. The absorption spectra of the native and the EE-modified hemes were determined using a model 996 diode-array detector (Millipore Corporation, Billerica, MA).
LC-MS/MS Analysis of the GSH Conjugates. The control and inactivated samples were prepared as described for the metabolism of EE. After the 30-min reaction, samples containing 1 nmol each of P450 were acidified with 60 μl of 10% TFA and then applied to 1 ml of AccuBond ODS-C18 solid phase extraction cartridge (Agilent Technologies, Palo Alto, CA). The cartridges were washed previously with 2 ml of methanol followed by 2 ml of water. After the samples were loaded, the cartridges were washed with 2 ml of water and then eluted with 2 ml of methanol followed by 0.3 ml of acetonitrile. The eluted samples were dried under N2 gas and resuspended in 80 μl of a 1:1 mixture of solvent A (0.1% acetic acid in H2O) and solvent B (0.1% acetic acid in acetonitrile). The samples were analyzed on a C18 reverse phase column (Luna; 3 μm; 4.6 × 100 mm; Phenomenex) using a gradient of 20 to 30% B over 5 min followed by a gradient to 40% B over 15 min and to 90% B over 15 min at a flow rate of 0.3 ml/min. The column effluent was directed into the electrospray ionization (ESI) source of an LCQ mass spectrometer (Thermo Electron Corporation, Waltham, MA). The ESI conditions were sheath gas flow rate, 90 arbitrary units; auxiliary gas, 30 arbitrary units; spray voltage, 4.5 kV; capillary temperature, 170°C; capillary voltage, 30 V; and tube lens offset, 25 V. Data were acquired in positive ion mode using Excalibur software (Thermo Electron Corporation) with one full scan followed by two data-dependent scans of the most intense and the second most intense ions.
LC-ESI-Mass Spectrometric Analysis of the Heme Adduct. To characterize the mass of the heme adduct, samples containing 1 nmol of control and inactivated P450s were extracted with 10% TFA/2-butanone, and the extracts were dried under N2 gas (Roberts et al., 1998). The samples were analyzed on a C4 reverse phase column (5 μm; 2 × 150 mm; Phenomenex) using a linear gradient from 35 to 65% B over 20 min and then to 95% B for an additional 10 min with a flow rate of 0.3 ml/min. The solvent system was the same as in the HPLC analysis of heme adducts as described above. The ESI conditions were sheath gas, 90 arbitrary units; auxiliary gas, 30 arbitrary units; capillary temperature, 180°C; and spray voltage, 3.5 kV. Data were acquired in positive ion mode using Excalibur software (Thermo Electron Corporation) with one full scan followed by two data-dependent scans of the most intense and the second most intense ion.
LC-ESI-Mass Spectrometric Analysis of the Metabolites of EE. The HPLC fractions from the metabolism studies were collected and derivatized with dansyl chloride following the method described previously (Shou et al., 2004). The extracted samples were dissolved in 1% formic acid/80% acetonitrile, and then they were analyzed on the LC-MS/MS system described above by using an isocratic mobile phase of 1% formic acid in 80% acetonitrile at a flow rate of 0.3 ml/min on a C18 column (Luna; 5 μm; 2 × 50 mm; Phenomenex). The conditions for ESI, data acquisition, and analysis were described above.
Results
Inactivation of 3A5 by EE. The inactivation of 3A5 in the reconstituted system by EE required NADPH and was time- and concentration-dependent (Fig. 1). Linear regression analysis of the time course data was used to estimate the initial rate constants (kobs) for the inactivation of 3A5 by EE. From the double reciprocal plot (inset) of the values for kobs and the concentration of EE, the KI, kinact, and t1/2 values for the inactivation of the BFC catalytic activity of 3A5 by EE were determined to be 26 μM, 0.06 min–1, and 16 min, respectively. It is interesting to note that b5 is absolutely required for the inactivation of 3A5 by EE.

Time- and concentration-dependent inactivation of P450 3A5 by EE. The reconstituted system containing 3A5 was incubated with 0 μM (○), 10 μM (•), 20 μM (▿), 50 μM (▵), 100 μM (□), and 200 (▪) μM EE. Aliquots were removed at the times indicated and assayed for residual BFC debenzylation activity as described under Materials and Methods. The inset shows the double reciprocal plots of the kinetic constants. The KI, kinact, and t1/2 were determined from the double reciprocal plots. The data represent the average of three separate experiments done in duplicate that did not differ by >10%.
Partition Ratio for the Inactivation of 3A5 by EE. P450 3A5 was incubated with various concentrations of EE for 1 h for the inactivation to reach completion. The percentage of activity remaining was plotted as a function of the molar ratio of EE to P450 (Fig. 2). The partition ratio was estimated from the intercept of the linear regression line obtained from lower ratios of EE to P450 with the straight line derived from higher ratios of EE to P450 as described previously (Silverman, 1996). Using this method, a partition ratio of ∼25 was determined.
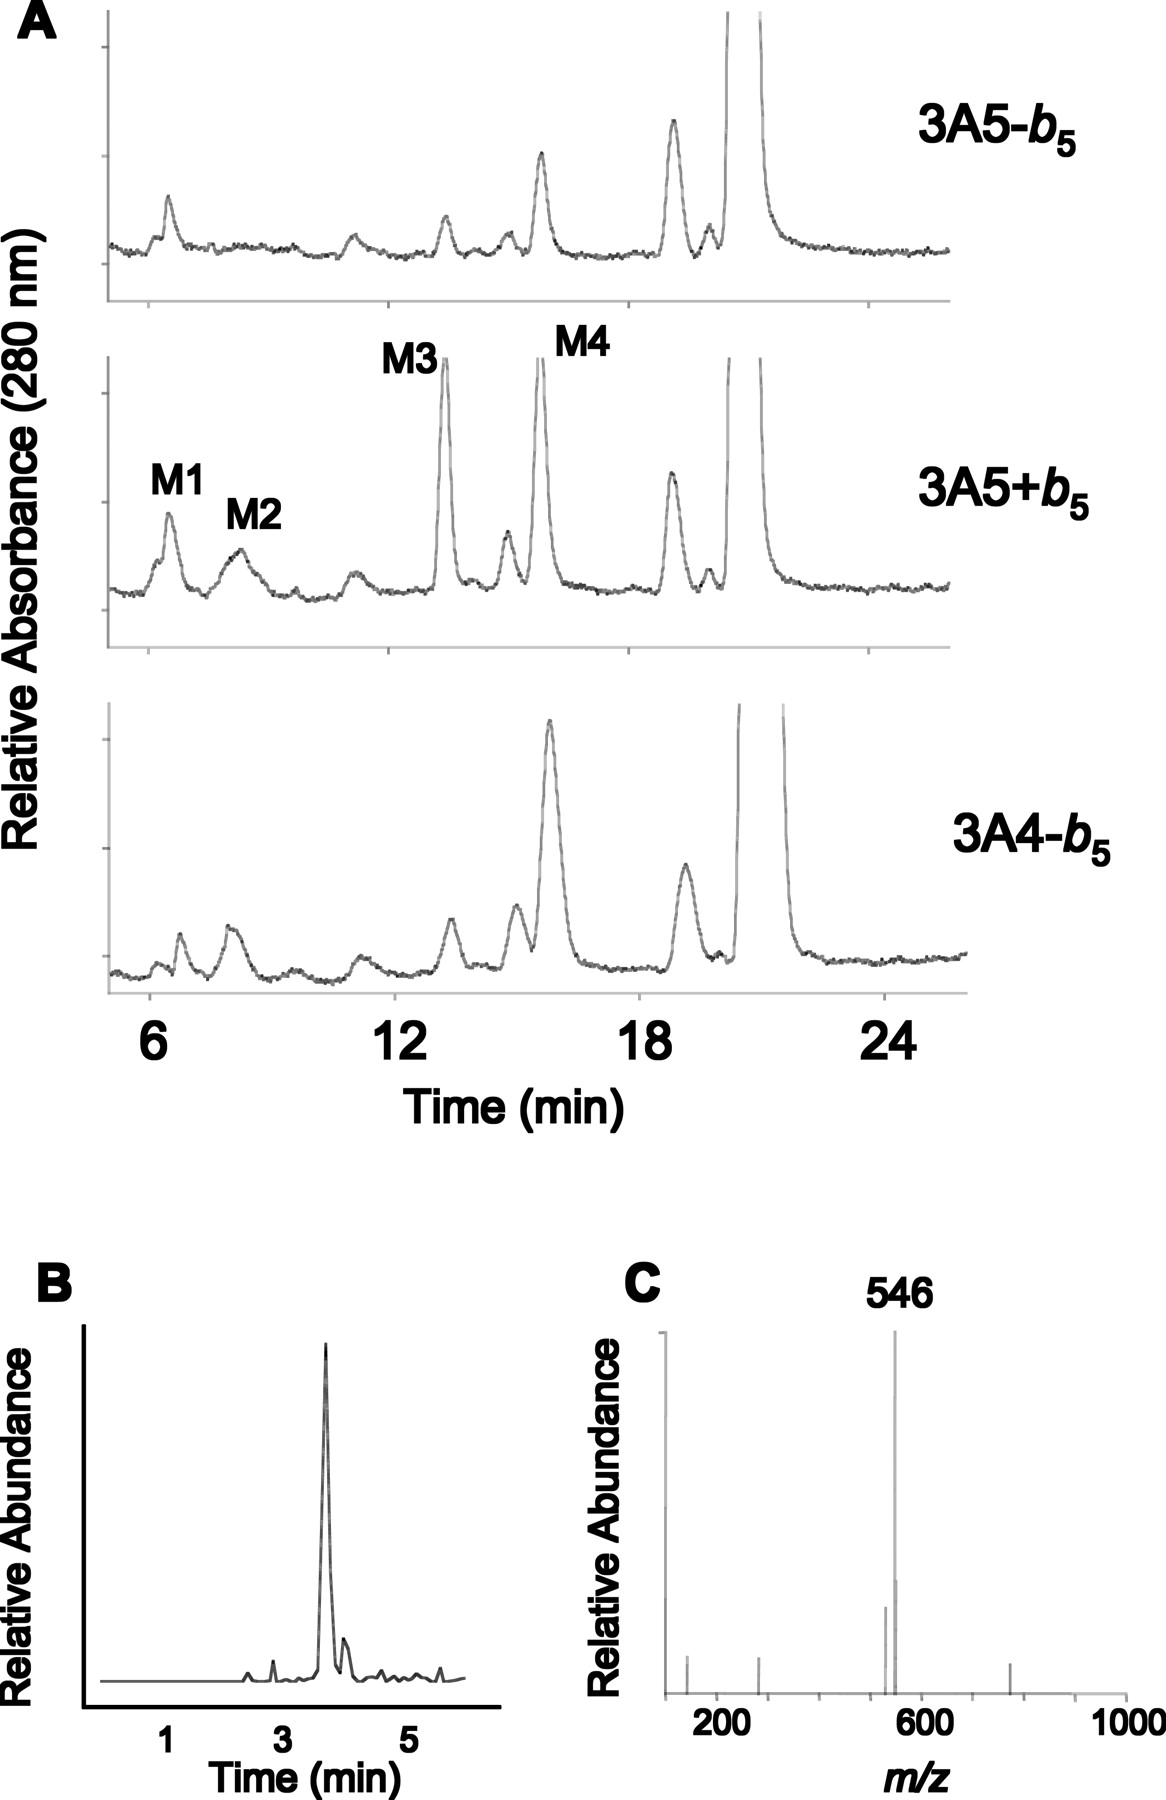
Metabolism of EE. Our previous studies have demonstrated that EE is able to inactivate 3A4 in the presence or absence of b5 (3A4 ± b5) (Lin et al., 2002). Therefore, we investigated the metabolism of EE by 3A4 and 3A5 in the presence and absence of b5. The HPLC chromatograms for the metabolism of EE by 3A4 – b5 and 3A5 ± b5 are shown in Fig. 3A. Four major metabolites, labeled M1, M2, M3, and M4, were generated by 3A5 in the presence of b5 (3A5 + b5). Comparison of the HPLC elution profile for the metabolites formed by 3A5 to our previous study with 3A4 permitted us to identify M4 as 2-OH-EE and M3 as 4-OH-EE. The structures of the other metabolites (M1 and M2) had not previously been identified (Lin et al., 2002). The peak eluting approximately 2 min before EE is not a metabolite, because it is also present in control samples (data not shown). The formation of M4 and M3 by 3A5 was enhanced ∼4-fold by the addition of b5. However, M1 formation was not significantly affected by the addition of b5. The most obvious difference between the two 3A5 samples was that the M2 metabolite was completely absent in the 3A5 reaction mixture devoid of b5 (3A5 – b5). P450 3A4 formed a similar amount of M2 in the absence of b5. The addition of b5 to 3A4 had no significant effect on the formation of any of metabolites (data not shown). By comparison of all of the metabolite profiles, it is clear that M2 is only seen under conditions where inactivation of P450s is occurring (3A4 ± b5 and 3A5 + b5). Therefore, M2 was further characterized by derivatizing the HPLC fractions containing M2 with dansyl chloride, and the mass of the dansylated derivative was determined by LC-MS/MS (Shou et al., 2004). LC-MS/MS analysis revealed the EE-dansyl derivative molecular ion is at m/z 530, equivalent to dansyl moiety (233 Da) plus EE (296 Da) and the M2-dansyl derivative molecular ion is at m/z 546, equivalent to the dansyl moiety plus the mass of 312 Da. Figure 3, B and C, show the extracted ion chromatogram (XIC) at m/z 546 and the full mass spectrum of the peak eluting at 3.23 min with an XIC of m/z 546, respectively. Although MS/MS analysis cannot assign the site of oxygen insertion, the mass of M2 is that which would be expected for an oxygenated EE (312 Da). Under conditions where M2 was not formed, inactivation of 3A5 did not occur. This suggests that M2 is the stable product related to the reactive electrophilic species responsible for inactivation. In addition, the formation of M2 may indicate that the orientation of EE in the active site under that condition favors the formation of the reactive species responsible for the inactivation.
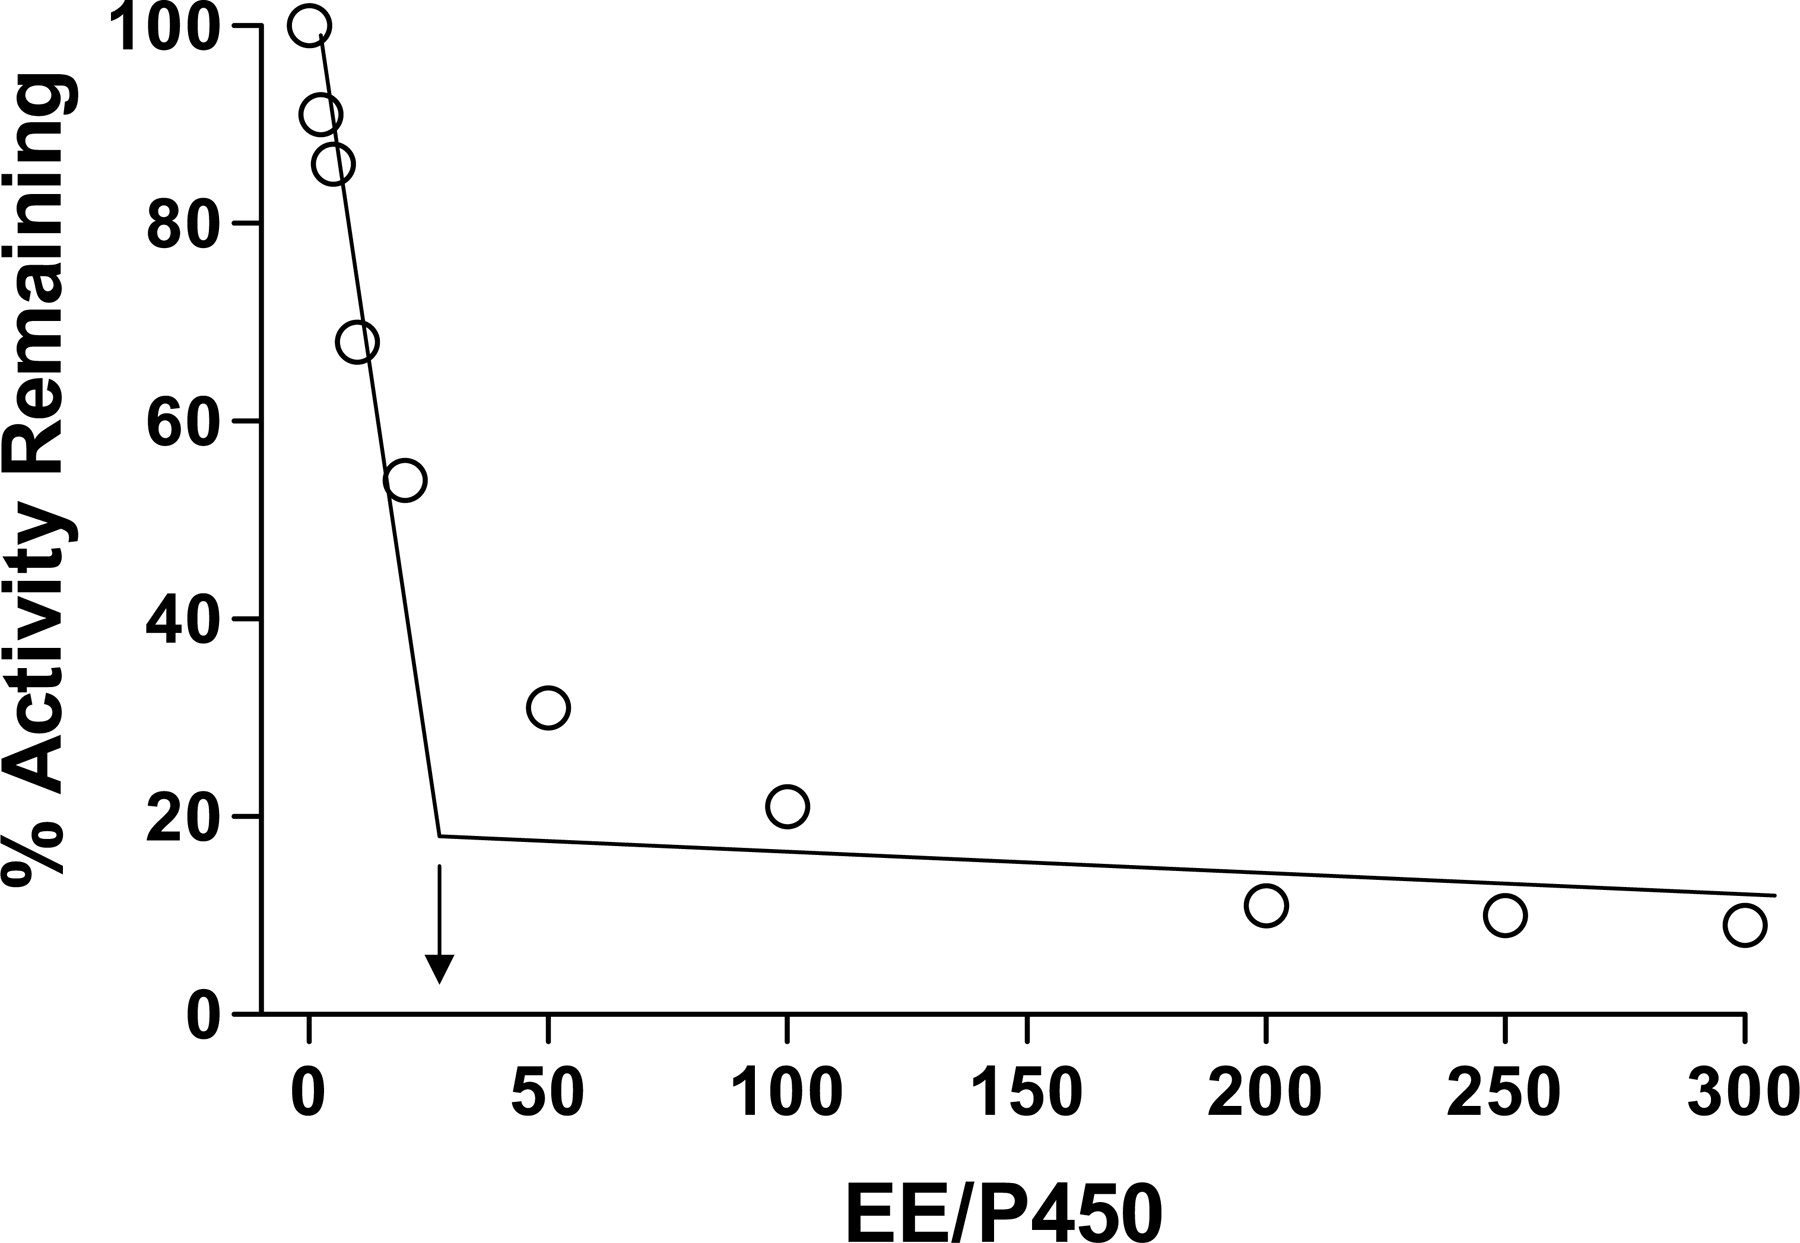
Determination of the partition ratio for inactivation of 3A5. The percentage of catalytic activity remaining was determined as a function of the molar ratio of EE to P450. Samples were incubated with various concentrations of EE for 1 h in the presence of NADPH until the inactivation reaction was essentially complete. The partition ratio was estimated from the intercept of the linear regression line from the lower ratios of EE to 3A5 and the straight line obtained from higher ratios of EE to 3A5.

HPLC separation of the major metabolites of EE formed by 3A4 and 3A5. A, reaction mixtures containing 3A4 and 3A5 were incubated with EE and NADPH for 30 min at 37°C. In addition, one reaction mixture containing 3A5 was incubated with EE and NADPH in the presence of b5. The samples were then analyzed by HPLC. The mass of M2 was characterized by LC-MS/MS following derivatization with dansyl chloride. B, XIC of the M2-dansyl derivative molecule at m/z 546. C, full mass spectrum of the precursor ion of the M2-dansyl derivative molecule. The experimental conditions were described under Materials and Methods.
Reduced CO Difference Spectra and Irreversibility of Inactivation. When the 3A5 reaction mixture was incubated with 100 μM EE at 37°C for 20 min, 38 ± 3% of the catalytic activity remained and 41 ± 7% of the spectrally detectable reduced CO spectrum at 450 nm was recovered (data not shown) in the inactivated (+NADPH) sample compared with the control (–NADPH) sample. The removal of EE not covalently bound to the protein from the control and inactivated samples by extensive dialysis did not lead to significant recovery of the catalytic activity or of the reduced CO difference spectrum compared with the values obtained for the same samples before dialysis (data not shown). Thus, the inactivation and loss of the reduced CO spectrum of P450 3A5 by EE are irreversible.
Covalent Binding of EE to 3A5. The amount of EE that covalently bound to the P450 during inactivation was determined by precipitating the protein from the control and inactivated samples incubated with [3H]EE with acidified methanol. Using the method described previously by Chan et al. (1993), the stoichiometry for the binding of a reactive intermediate of EE to 3A5 apoprotein was determined to be approximately 0.3 mol of EE bound per mole of 3A5 inactivated. Two other approaches were used to investigate the covalent binding of EE to the apoprotein of 3A5 following incubation of the reaction mixtures with [3H]EE. As shown in Fig. 4A, three different reaction mixtures were subjected to SDS-PAGE analysis: 1) without b5, but with the addition of NADPH (no inactivation); 2) with b5 and NADPH (inactivation); and 3) with b5, but without NADPH (no inactivation). Figure 4A clearly shows that EE-derived radioactivity is associated primarily with the P450 3A5 apoprotein only under condition 2 (inactivated sample). Although 3A5 readily metabolizes EE under condition 1, the intensity of 3A5 labeling was extremely low compared with condition 2. No detectable labeling was observed under condition 3 (control sample). Thus, EE binds covalently to the 3A5 apoprotein, and this binding requires the presence of both b5 and NADPH. In the absence of b5 or NADPH, no inactivation was observed and there was no significant covalent binding to the apoprotein. The binding of a trace amount of [3H]EE to the reductase in the inactivated sample may reflect the ability of some of the reactive intermediate to escape from 3A5 active site. The other approach involved isolating the labeled 3A5 from the reaction mixtures and digesting it with Lys C followed by separation of the peptides on a C18 column. Figure 4B shows that three radiolabeled peaks are observed following Lys C digestion of the labeled protein. Most of the radioactivity was associated with the peptide that eluted at 25 min. This provides conclusive proof that the radiolabeled EE is covalently bound to the apoprotein
Absorption Spectrum of the Heme Adduct. After incubation of the reconstituted system containing 3A5 and b5 with 100 μM EE for 20 min, ∼40% of the native heme eluting at 21 min was destroyed, and a modified heme eluting at 26 min was observed (Fig. 5A). The absorption spectrum of the heme adduct was determined using a diode-array detector coupled to the HPLC system. The wavelengths for the maximum absorbance of the native heme and the heme adduct eluting at 26 min were 398 and 408 nm, respectively (Fig. 5B). A Soret peak at 408 nm for the heme adduct indicates that heme is modified, possibly alkylated (Kuo et al., 1999). Because EE has a maximal absorbance at 280 nm, the minor peak at 306 nm in the absorbance spectrum may result from the modified EE moiety attached to the heme.

Covalent binding of EE to P450 3A5. Experiments were performed as described under Materials and Methods. A, SDS-PAGE separation of 3A5 apoprotein and reductase in the reconstituted system incubated with [3H]EE under the following conditions: with NADPH but no b5 (1), with NADPH and b5 (2), and with b5 but no NADPH (3). B, HPLC separation and analysis by liquid scintillation counting of the fractions after the [3H]EE-inactivated P450 3A5 was digested by Lys C.
These results indicate that the inactivation of 3A5 by EE is due to both heme modification and covalent binding of the EE to the apoprotein. This is similar to what we have observed previously for the inactivation of 3A4. However, the major difference is that b5 is absolutely required for the inactivation of 3A5 but not 3A4 (Lin et al., 2002).
Trapping Reactive Intermediates of EE. One approach used to identify reactive intermediates formed as a result of metabolism by P450s involves trapping the intermediates by reaction with GSH and then elucidating the structures of GSH conjugates by LC-MS/MS. Our laboratory has used this approach to identify the GSH conjugates formed during the inactivation of P450s 2B1, 2B4, and 2B6 by phencyclidine; the inactivation of P450s 2B1 and 2B6 by EE, and the inactivation of P450s 2B6 and 3A5 by bergamottin (Shebley et al., 2006; Kent et al., 2006a,b). Therefore, we used GSH to trap the reactive intermediates formed by 3A4 and by 3A5 in the absence and presence of b5.

Detection of a heme adduct by HPLC and analysis of heme spectrum using a diode-array detector. A, HPLC elution profile of the native heme and the heme adduct resulting from the inactivation of 3A5 by EE. The column eluate was monitored at 405 nm. B, absorption spectra of the native heme and the heme adduct analyzed using a diodearray detector. The experimental procedures are described under Materials and Methods.
Two GSH conjugates having MH+ ions at m/z 618 were observed following incubation of EE with P450 3A5 in the presence or absence of b5. One GSH adduct eluted at 14.5 min (G1), and one adduct eluted at 18.1 min (G2). The XICs of the G1 and G2 adducts exhibiting m/z values of 618 are shown in Fig. 6A. The molecular masses of G1 and G2 correspond to the sum of the mass of EE (296 Da) plus GSH (307 Da) and one oxygen minus two mass units. Figure 6B shows that G1 and G2 exhibit very similar fragmentation patterns, indicating that they are regio-isomeric conjugates. It has previously been demonstrated that GSH can bind to 2-hydroxyestrogen to form thioether conjugates at C1 and C4 of the A ring (Elce and Harris, 1971; Bolt et al., 1973). As shown in Fig. 3A, 2-OH-EE is the major metabolite of EE formed by 3A4 and 3A5 under all conditions. The MS/MS spectra for the G1 and G2 were analyzed, and they seem to result from the addition of GSH at the C1- or C4-position of 2-OH-EE as shown in Fig. 6C. The characteristic fragment ions for the presence of GSH include neutral losses of 75 and 129 Da, corresponding to the glycine (Gly) and pyroglutamate (Glu) residues of GSH, respectively (Baillie and Davis, 1993). The fragment ion at m/z 543 is from the loss of Gly, the ion at m/z 489 is from the loss of Glu, and the peak at m/z 386 is from the combined losses of Glu, Gly, and CO. All of these fragment ions are consistent with the presence of GSH in both G1 and G2. The cleavage of the C–S bond within the GSH moiety of G1 or G2 leads to the major fragment ion at m/z 343. GSH conjugates of EE exhibiting ions with m/z values of 618 and exhibiting the unique fragment ion at m/z 343 have been identified using rat and human microsomes (Maggs et al., 1983; Yan and Caldwell, 2004). Moreover, assignment of the ion with an m/z 343 from the EE-GSH conjugates of P450 2B1 and 2B6 was confirmed using a Q-TOF mass spectrometer (Kent et al., 2006a). It has been suggested that 2-OH-EE can undergo further oxidation on the A-ring to form an electrophilic metabolite, probably an o-quinone derivative of 2-OH-EE, which can then react with GSH to form the regio-isomeric adducts G1 and G2 (Bolt et al., 1973; Maggs et al., 1983). To investigate the possibility that G1 and G2 may be formed from 2-OH-EE, 2-OH-EE was incubated with the 3A5 reaction mixture containing GSH, and the resulting GSH conjugates were characterized. The two species with ions at m/z 618 were observed, and the elution times in the XIC and the MS/MS spectra (data not shown) were similar to the G1 and G2 conjugates formed when the starting substrate was EE. These results demonstrate that G1 and G2 are derived from a reactive metabolite formed from 2-OH-EE in the 3A5-reconstituted system. Furthermore, no significant loss of the BFC catalytic activity of 3A5 was observed following incubation with 2-OH-EE. Taken together, these results suggest that the reactive species leading to the formation of G1 and G2 may not be responsible for the inactivation of 3A5 by EE.
Two GSH conjugates with MH+ ions at m/z 620 were observed. The conjugate eluting at 14.0 min is G3, and the conjugate eluting at 19.7 min is G4. The XICs of these two conjugates are shown in Fig. 7A. Significant amounts of G3 and G4 were only formed in the presence of b5, when inactivation is observed. We have previously demonstrated that both heme destruction and covalent modification of the apoprotein occurred during the mechanism-based inactivation of 3A4 by EE, but we did not characterize the EE-GSH conjugates (Lin et al., 2002). Here, we provide information on the formation of GSH conjugates during the inactivation of 3A4 by EE. Both G3 and G4 were also detected following metabolism of EE by 3A4 (data not shown). A major difference between 3A4 and 3A5 is that G3 is a predominant species formed by 3A4, whereas G4 is a predominant species formed by 3A5. The mass spectral fragmentation patterns for G3 and G4 were then determined. The masses of G3 and G4 are equivalent to the sum of GSH plus EE and one oxygen atom. Figure 7B shows that the MS/MS fragmentation patterns for G3 and G4 are very different. Ortiz de Montellano and co-workers have previously demonstrated that the inactivation of heme proteins by ethynyl compounds involves oxygenation of the ethynyl group. If oxygen is added to internal carbon, the heme will be alkylated and if oxygen is added to the terminal carbon, the apoprotein will be modified (Ortiz de Montellano and Kunze, 1980; Kunze et al., 1983; Ortiz de Montellano and Komives, 1985; CaJacob et al., 1988; Chan et al., 1993). The reactive species trapped by GSH to form G3 and G4 may be involved in binding to the heme or the protein and seems to be responsible for the inactivation. Analysis of the MS/MS spectra of G3 and G4 leads to the structures for G3 and G4 proposed in Fig. 7C.

Structural identification of two GSH conjugates of EE with precursor ions at m/z 618. Reaction mixtures containing 3A5 were incubated with EE in the presence or absence of b5 and the reactive intermediates were trapped with GSH. GSH conjugates were analyzed as described under Materials and Methods. The two ions eluting at approximately 14.6 and 18.0 min and exhibiting m/z values of 618 are assigned as G1 and G2, respectively. A, XIC of GSH conjugates of the EE metabolite. B, MS/MS spectra of G1 and G2. C, proposed structures of G1 and G2. The dashed lines indicate the sites of fragmentation. The spectra were obtained in positive mode using the Excalibur software package.
For G3, the fragment ion at m/z 545 is from the loss of Gly, the fragment ion at m/z 491 is from the loss of Glu, the fragment ion at m/z 473 is from the loss of Glu and water, and the fragment ion at m/z 388 is from loss of Gly, Glu, and CO. All four fragment ions indicate that GSH is a component of G3. The presence of a unique fragment ion at m/z 345, corresponding to the sum of oxygenated EE plus SH, results from the cleavage of the C–S bond within the GSH moiety of G3. For G4, the precursor ion at m/z 620 undergoes a loss of water to give rise to a fragment ion at m/z 602. The further loss of Gly and Glu produces the fragment ions at m/z 527 and m/z 473, respectively. The fragment ion at m/z 398 is from the combined loss of Gly and Glu from ion at m/z 602. The fragment ion at m/z 308 is from a protonated GSH moiety, suggesting cleavage of the thioester bond. The cleavage between the sterol moiety and the 17α-CH2CO side chain will produce a fragment ion from the sterol moiety at m/z 271 and a fragment ion at m/z 350. The subsequent loss of water from the ion with m/z 271 will form the fragment ion with m/z 253 and subsequent losses of water and Glu from the ion with m/z 350 will form the fragment ion with m/z 203. HighChem Mass Frontier software 3.0 (Thermo Electron Corporation) was used to verify that the fragment ions observed correlate with the proposed structures. Thus, our results indicate that two different reactive species were trapped by GSH during the metabolism of EE by 3A5 in the presence of b5. The addition of the oxygen to the internal carbon of the ethynyl moiety resulted in an intermediate that reacted with GSH to form G3. The addition of the oxygen to the terminal carbon of ethynyl moiety resulted in the reaction with GSH to form G4. These results suggest that the reactive species forming G3 may be responsible for alkylating the heme and that the reactive species forming G4 may responsible for modifying the protein in the active site.
Characterization of the Mass of the Heme Adduct. Following inactivation, the 3A5 reaction mixtures were extracted with TFA/2-butanone, and the extracts were subjected to LC-MS/MS analysis. Three heme-derived mass spectrometric ions were observed as shown in Fig. 8A. The species with the MH+ ion at m/z 616 is the native heme. The species with the m/z value of 927 seems to be the EE-heme adduct. The mass of this heme adduct corresponds to the sum of the oxygenated EE (312 Da) and the heme minus two hydrogen atoms. Formation of a heme adduct was observed previously with norethisterone, which is structurally similar to EE (Ortiz de Montellano et al., 1979; Ortiz de Montellano and Kunze, 1980; Johnston et al., 1991). The MS/MS spectrum for the peak at m/z 927 is displayed in Fig. 8B. The predominant fragment ion at m/z 616 is indicative of the presence of heme moiety, indicating that the oxygenated EE has been lost. The fragment ion at m/z 870 is from the elimination of iron from the precursor ion. The fragment ion at m/z 365 is difficult to assign; it may result from the loss of the two vinyl and propionic acid side chains from the iron-depleted tetrapyrrolic skeleton. The mass of the species with MH+ ions at m/z 579 is equivalent to the sum of oxygenated EE and a dipyrrolic fragment minus two hydrogen atoms. A heme fragment containing the A and B rings and having a mass of 268 Da can be derived from the degradation of the heme tetrapyrrolic structure (He et al., 1998). It is possible that the two species with ions at m/z 579 are derived from the degradation of adducted heme in which the oxygenated EE can react with more than one pyrrole nitrogen. These would involve alkylation at pyrrole ring A or B. The MS/MS spectra of the peak with m/z 579 were not helpful to elucidate the structure (data not shown). The proposed structures for the heme adduct and one of the possible heme fragment adducts shown in Fig. 8C are based on previous studies (Ortiz de Montellano and Kunze, 1980; Kunze et al., 1983; Johnston et al., 1991; He et al., 1998).

Structural identification of the two GSH conjugates with precursor ions at m/z 620. The experimental conditions were the same as in Fig. 6. The two species with MH+ ions at m/z 620 are indicated as G3 and G4. A, XIC of the GSH conjugates of the EE metabolites. B, MS/MS spectra of G3 and G4. C, proposed structures of G3 and G4. The spectra were obtained in positive mode using the Excalibur software package. The dashed lines indicate the sites of fragmentation. The linkage of GSH to the ethynyl moiety following the addition of oxygen to the internal or terminal carbons of the ethynyl triple bond forms G3 and G4, respectively.
Discussion
The inactivation of human P450 3A5 by EE in the presence of cytochrome b5 was concentration- and time-dependent, required NADPH, and was irreversible. The inactivation exhibited a KI of 26 μM and a kinact of 0.06 min–1. The physiological relevance of this reaction is not clear, because the concentrations of EE used in the P450-reconstituted system exceed the concentrations of EE expected to be in the circulation during normal drug treatment. However, we cannot rule out local accumulation in certain tissues may occur, leading to significantly higher local concentrations of EE. The mechanism of inactivation resulted in the formation of adducts to the heme and to the apoprotein. The partition ratio was ∼25, and the stoichiometry of binding was ∼0.3 mol of EE metabolite bound/mol of P450 inactivated. We have previously seen a binding stoichiometry that was less than 1:1 for the mechanism-based inactivation of P450 3A5 by bergamottin (Lin et al., 2005). Two GSH conjugates, G1 and G2, were trapped in the presence or absence of b5, and an additional two GSH conjugates, G3 and G4, were trapped during the b5-dependent inactivation.

LC-MS/MS analysis of the native heme and modified heme and heme fragments from 3A5. A, XIC of three heme or heme-derived molecular ions having values for the MH+ ions of m/z 616, 927, and 579. B, MS/MS spectrum of the precursor ion having m/z 927. C, structures proposed for adducts to the native heme and a dipyrrolic fragment formed by alkylation of the heme by EE with the activated oxygen added to the internal carbon of the ethynyl moiety.
After the inactivation of 3A5 by EE, ∼40% of native heme was destroyed, and a modified EE-heme adduct was observed by HPLC analysis. The maximal absorbance for the native heme is 398 nm, whereas the maximal absorbance for the heme adduct was red-shifted to 408 nm. LC-MS/MS analysis revealed that the molecular ion for the heme adduct is m/z 927. The covalent binding of a reactive intermediate of EE to the apoprotein was demonstrated by two approaches: 1) SDS-PAGE analysis showed covalent binding of the radiolabeled EE to the 3A5 apoprotein and 2) [3H]EE-labeled peptides were observed by HPLC analysis after Lys C digestion of the inactivated 3A5 apoprotein. The mechanism for the oxygenation of acetylenic compounds leading to the inactivation of P450s is well documented (Ortiz de Montellano and Kunze, 1980; Ortiz de Montellano and Komives, 1985; CaJacob et al., 1988; Chan et al., 1993). The addition of the activated oxygen from the P450 to the internal carbon of the acetylene results in alkylation of the nitrogen atom of the pyrrole, whereas the addition of the oxygen to the terminal carbon may result in covalent binding to nucleophilic residues of the apoprotein. To form a stable product with the MH+ ion at m/z 620, the GSH is most likely to react with the terminal carbon; otherwise, the steric strain would be expected to result in deethynylation (Helton et al., 1977). Here, we investigated the inactivation of 3A5 by EE involving both modification of the heme and the apoprotein. The metabolic activation of EE resulted in the formation of four different electrophilic metabolites that could be trapped as GSH conjugates.
On the basis of the structures of the GSH conjugates determined, potential sites and mechanisms for the bioactivation of EE can be proposed (Baillie and Davis, 1993; Samuel et al., 2003). As shown in Fig. 9, the GSH conjugates G1 and G2 were formed by the reaction of GSH with EE at the C1- and C4-positions on the A ring of 2-OH-EE. These same reactive intermediates can also react with microsomal proteins to form covalent adducts as described previously (Maggs et al., 1983). Because G1 and G2 can be detected during the metabolism of EE in the absence of b5, the reactive intermediates trapped by GSH to form G1 and G2 may also bind to proteins in the reconstituted system, but they do not specifically bind to P450, resulting in inactivation. Thus, the metabolic activation of EE to 2-OH-EE followed by further oxidation to a reactive o-quinine is not involved in the inactivation of 3A5 by EE. The GSH conjugates G3 and G4 were formed by GSH trapping of the oxygenated ethynyl group, presumably a 17α-oxirene-related reactive species, with the activated oxygen subsequently being transferred to either the internal or the terminal carbons. Because both the inactivation of 3A5 by EE and the generation of the GSH conjugates G3 and G4 by 3A5 are b5-dependent, it seems that the same reactive intermediates responsible for forming G3 and G4 are also responsible for the inactivation of 3A5. These findings are consistent with previous studies on the inactivation of a number of mammalian P450s by terminal acetylenic compounds. In short, two reactive intermediates having different structures have been trapped during EE metabolism, and they are responsible for the inactivation of P450 3A5 as well as 3A4.
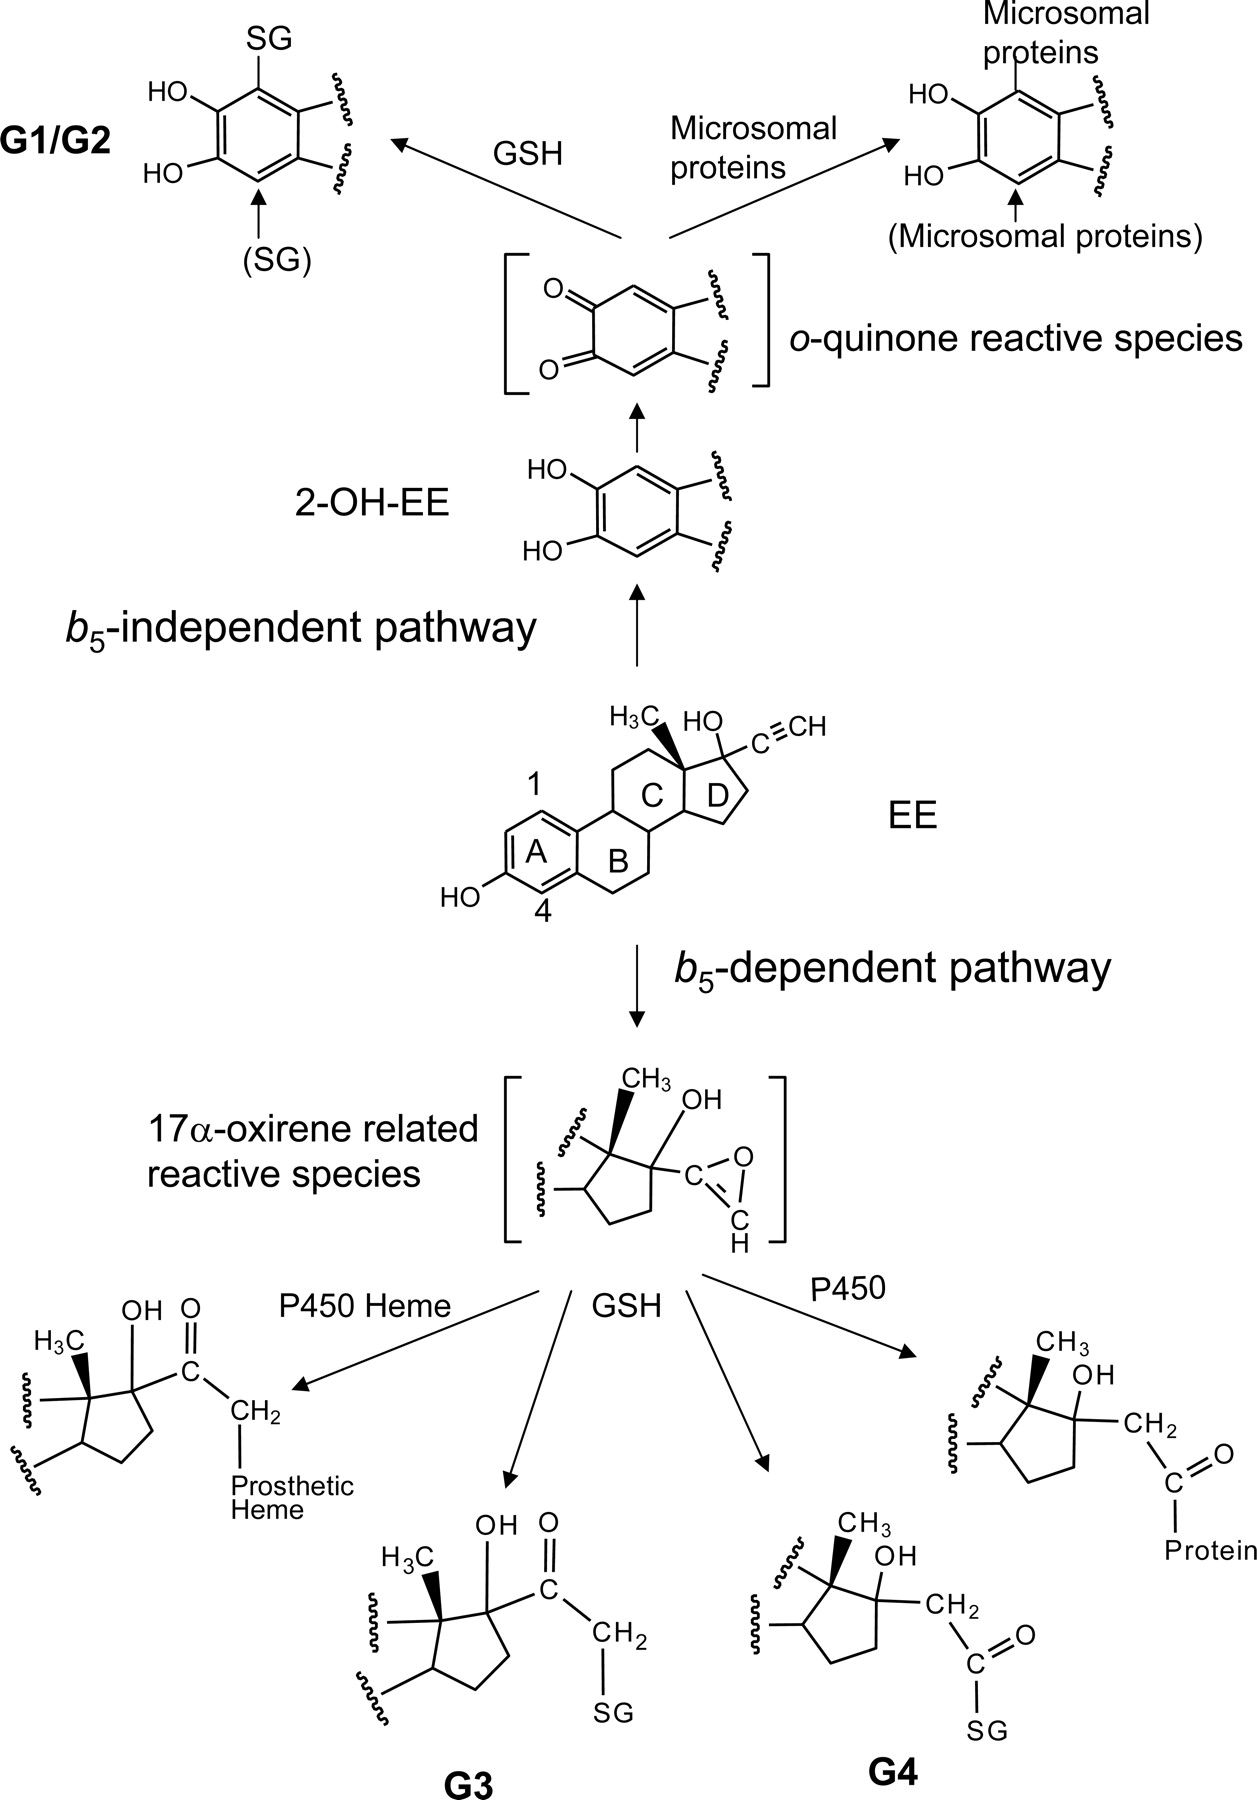
Pathways proposed for the formation of the reactive electrophilic intermediates, GSH conjugates, and heme adducts and for the covalent binding to proteins during the metabolism of EE by P450 3A5. The reactive intermediates contributing to the inactivation of 3A5 by EE are proposed and discussed in the text.
Although 2-OH-EE can be formed in the absence of b5 (Fig. 3A, 3A5-b5), the radiolabeling of 3A5 apoprotein (Fig. 4A, condition 1) is negligible, suggesting that the reactive intermediates formed from 2-OH-EE, presumably the same reactive intermediates responsible for forming G1 and G2, do not contribute to the inactivation in P450. That the reactive intermediates responsible for the formation of G3 and G4 are also responsible for EE-inactivation is supported by the b5- and NADPH-dependent covalent binding of EE to the P450 apoprotein (Fig. 4A, condition 2). The reactive intermediate of EE that forms G4, where the oxygen is attached to the terminal carbon, plays an important role in covalent binding to the apoprotein. Because EE inactivation of 3A5 is b5-dependent, the functions of the different reactive intermediates derived from the A ring of 2-OH-EE and the ethynyl moiety of EE can be differentiated by SDS-PAGE analysis (Fig. 4A) and the formation of GSH conjugates (Fig. 7A). Taken together, these results demonstrate that only the b5-specific reactive intermediates play a role in the modification of 3A5 and that they mediate the inactivation process.
Figure 9 illustrates the pathways proposed for both the b5-independent and b5-dependent activation of EE. 2-OH-EE, the major metabolite formed by both 3A4 and 3A5, can undergo further oxidation on the A ring to form a reactive o-quinone intermediate that can then react with GSH at the C1- and C4-positions on the A ring of 2-OH-EE to form conjugates G1 and G2. These reactive metabolites can also bind covalently to microsomal proteins, but they do not react specifically with P450 leading to inactivation. Thus, the metabolic activation of 2-OH-EE to the o-quinone is not involved the inactivation of 3A5 by EE. Oxygenation of the carbon–carbon triple bond in the presence of b5 seems to form a very unstable 17α-oxirene-related reactive species (unsaturated epoxide) that then can react with GSH, resulting in the formation of G3 and G4. Thus, the metabolic activation of the ethynyl moiety contributes to the mechanism of inactivation. Recently, we have detected several EE-GSH conjugates following incubation of EE with human liver microsomes and liver microsomes from rats induced with dexamethasone. The full masses and fragmentation patterns of the two GSH conjugates are identical to G3 and G4, and they are very abundant from these microsomes (data not shown). The structures of G3 and G4 will be investigated in detail by liquid chromatography-NMR to verify the structures proposed in Fig. 7.
In this study, we demonstrated that b5 is required for the inactivation of 3A5 by EE but not for 3A4. However, we have observed that b5 is not required for the inactivation of 3A5 by bergamottin (Lin et al., 2005). Other studies have reported that the role of b5 in the drug oxidation activities of P450s 3A4 and 3A5 is different from those of P450 3A7 (Yamaori et al., 2003). These results suggest that the contribution of b5 to substrate metabolism and mechanism-based inactivation of various P450s is substrate- and enzyme-specific. There are at least two hypotheses to explain the stimulatory effect of b5 on P450 catalysis: 1) b5 is directly involved in an electron transfer reaction or 2) it causes a conformational change of P450 protein (Guryev et al., 2001). We have observed that EE did not inactivate 3A5 in the presence of manganese-b5, suggesting that electron transfer from b5 may be required for the metabolic activation of EE leading to the inactivation of 3A5 in the P450-reconstituted system (data not shown). However, the exact role of b5 in this reaction as well as in many others is poorly understand and still controversial. The identities of the residues that contribute to the interaction of b5 and 3A5 resulting in inactivation of 3A5 by EE remain to be investigated.
3A5 is expressed in the adrenal glands, prostate, and kidney, and it exhibits significant genetic polymorphisms and interindividual/interracial differences in expression (Kuehl et al., 2001; Koch et al., 2002; Huang et al., 2004). Under conditions where P450 3A5 represents a significant fraction of the total P450 3A pool for an individual, the contribution of 3A5 to drug-drug interactions needs to be considered.
In conclusion, we have demonstrated that EE is a mechanism-based inactivator of P450 3A5 in the presence of b5 and that the inactivation results from two mechanisms: heme destruction and covalent binding to apoprotein. The observation of two GSH conjugates of EE that are only detected in the presence of b5 aided in the determination that two reactive intermediates responsible for the inactivation were formed by oxygenation of the ethynyl moiety.
Acknowledgments
We are especially grateful to Drs. Ute M. Kent and Kathleen Noon for help with the LC-MS/MS analyses and informative discussions. We also thank Drs. T. M. Rajendiran and Yoshimasa Kobayashi for helpful discussion. Technical support from Mohamad Shebley and Natasha Snider is appreciated.
Footnotes
-
This work was supported in part by National Institutes of Health Grant CA-16954
-
Article, publication date, and citation information can be found at http://jpet.aspetjournals.org.
-
doi:10.1124/jpet.106.117861.
-
ABBREVIATIONS: 3A4, cytochrome P450 3A4; 3A5, cytochrome P450 3A5; EE, 17α-ethynylestradiol; b5, cytochrome b5; GSH, glutathione; LC-MS/MS, liquid chromatography-tandem mass spectrometry; BFC, 7-benzyloxy-4-(trifluoromethyl)-coumarin; HPLC, high-pressure liquid chromatography; PAGE, polyacrylamide gel electrophoresis; Lys C, lysyl endopeptidase; Ni-NTA, nickel-nitrilotriacetic acid; TFA, trifluoroacetic acid; ESI, electrospray ionization; M, metabolite; XIC, extracted ion chromatogram; G, glutathione adduct.
- Received November 30, 2006.
- Accepted January 22, 2007.
- The American Society for Pharmacology and Experimental Therapeutics


