


Abstract
The dispositions of 50 marketed central nervous system (CNS) drugs into the brain have been examined in terms of their rat in situ (P) and in vitro apparent membrane permeability (Papp) alongside lipophilicity and free fraction in rat brain tissue. The inter-relationship between these parameters highlights that both permeability and brain tissue binding influence the uptake of drugs into the CNS. Hydrophilic compounds characterized by low brain tissue binding display a strong correlation (R2 = 0.82) between P and Papp, whereas the uptake of more lipophilic compounds seems to be influenced by both Papp and brain free fraction. A nonlinear relationship is observed between logPoct and P over the 6 orders of magnitude range in lipophilicity studied. These findings corroborate recent reports in the literature that brain penetration is a function of both rate and extent of drug uptake into the CNS.
The development of new drugs targeting the central nervous system (CNS) is the fastest growing franchise within the pharmaceutical sector, although this growth has been tempered by relatively poor success of novel candidates (Alavijeh et al., 2005). One of the significant challenges in treating CNS conditions is drug passage across the blood-brain barrier (BBB), a layer of endothelial cells connected with tight junctions that express numerous drug-metabolizing enzymes and efflux transporters (Pardridge, 1997; Tamai and Tsuji, 2000). Therefore, investigation of drug properties that are favorable for CNS delivery can greatly improve efforts in drug discovery.
A number of methods are available to determine the rate of uptake of drugs from blood into brain parenchyma (Begley, 1999). In the pharmaceutical industry, CNS penetration is usually assessed in rodents following either intravenous or oral dosing to determine the brain-to-blood concentration ratio. This takes into account not only BBB penetration but also binding, metabolism, and clearance. However, there can be marked species differences in the influence of these parameters on overall BBB penetration; hence, there is significant value in removing some of this complexity and assessing brain penetration at the level of the BBB in situ. Considering that the BBB is conserved across species (Cserr and Bundgaard, 1984), this may represent a more meaningful indicator of the intrinsic ability of the compound to cross the BBB in humans. Furthermore, in situ techniques offer an ideal validation tool for assessing in vitro BBB models, and they also provide further insight into the molecular descriptors that are crucial for BBB penetration.
Brain perfusion has been used in neurochemical research for more than 50 years. Early methods focused on long-term perfusion of isolated brain and required extensive surgical preparation (Woods and Youdim, 1977). Then, in the 1980s, the development of the in situ rat brain perfusion technique (Takasato et al., 1984) provided a simple method for performing short-term studies of brain uptake following less complex surgery. Several variants have been published that modify and extend the original method, including those of Greenwood et al. (1985) and Zloković et al. (1986). The in situ brain perfusion method involves cannulation of the carotid artery and infusing whole blood, physiological buffer, or saline containing the compound of interest. Because of the possibility of extending perfusion time, this model allows transport studies of slowly penetrating and metabolically unstable drugs. Furthermore, because there is complete control over perfusate composition, perfusate flow, and perfusion time, investigation of other variables is possible, including plasma protein binding or the influence of specific drug transporters. There are many examples in the literature of the successful application of in situ brain perfusion to study the CNS uptake of compounds (Takada et al., 1992; Chikhale et al., 1995). Comparisons have been made with results obtained with in vitro models of the BBB (Pardridge et al., 1990; Chikhale et al., 1994), and in situ perfusion data have also been used to refine or develop predictive computational models of BBB permeability (Liu et al., 2004).
Reports have shown that drug permeation into the CNS is influenced by physicochemical properties as well as the potential to interact with transport systems at the BBB. It has been suggested that the optimal molecular mass for passage into the brain lies in the region of 300 to 400 Da (Fischer et al., 1998), ideally with low polar surface area (<80 Å2) (Clark, 1999), and permeability into the CNS (Takasato et al., 1984). However, previous investigations have been performed on a limited number of compounds, many of which are not therapeutic agents (Takasato et al., 1984; Murakami et al., 2000). In this work, brain disposition of 50 CNS-marketed drugs has been investigated, covering a wide range of physicochemical characteristics. The present study investigated the relationship among drug in situ brain permeability product (P), lipophilicity (log octanol/water partition coefficient; clogPoct), and in vitro permeability (Papp) across multidrug resistance Madin-Darby canine kidney (MDR1-MDCK) type II cell monolayers (Mahar Doan et al., 2002; Wang et al., 2005), and the unbound drug fraction in rat brain tissue, a parameter recently reported to influence CNS penetration (Kalvass and Maurer, 2002). Over a clogPoct range of approximately 0 to 6, there is a nonlinear relationship observed between lipophilicity and P. In addition, P seems to be influenced not only by the drug permeability across the BBB but also by binding to brain tissue.
Materials and Methods
Chemical structures for the 50 compound set are supplied in Supplemental Material 1. The following compounds were obtained from commercial sources: risperidone, chlorpromazine, bupropion, pergolide mesylate, amitriptyline, diazepam, meprobamate, temazepam (all from Sigma Chemical, Poole, Dorset, UK), venlafaxine, citalopram, pemoline, and midazolam (all from Sequoia Research Products Ltd., Oxford, UK). All other compounds were available from in-house sources.
Calculated Physicochemical Properties. clogPoct values were calculated using CLOGP software (Biobyte Corporation, Claremont, CA). Calculation of polar surface area was based on the work of Clark (1999).
Equilibrium Dialysis Measurements. We used a 96-well equilibrium dialysis apparatus to determine the free fraction in the blood and brain for each drug (HT Dialysis LLC, Gales Ferry, CT). Membranes (3-kDA cut-off) membranes were conditioned in deionized water for 40 min, followed by conditioning in 80:20 deionized water/ethanol for 20 min, and then they were rinsed in deionized water before use. Rat brains were obtained fresh on the day of the experiment, and they were homogenized with PBS to a final composition of 1:2 brain/PBS by means of ultrasonication (Tomtec autogiser; Receptor Technologies, Adderbury, Oxon, UK) in an ice bath. Diluted brain homogenate was spiked with the test compound (1000 ng/g), and 100-μl aliquots (n = 6 replicate determinations) were loaded into the 96-well equilibrium dialysis plate. Dialysis versus PBS (100 μl) was carried out for 5 h in a temperature-controlled incubator at 37°C (Stuart Scientific, Watford, UK), using an orbital microplate shaker at 125 rpm (Stuart Scientific). At the end of the incubation period, aliquots of brain homogenate or PBS were transferred to Matrix ScreenMate tubes (Matrix Technologies, Hudson, NH), and the composition in each tube was balanced with control fluid, such that the volume of PBS to brain was the same. Sample extraction was performed by the addition of 200 μl of acetonitrile containing an internal standard. Samples were allowed to mix for 15 min and then centrifuged at 2465g in 96-well blocks for 20 min (Eppendorf 5810R; VWR International, Poole, Dorset, UK). The unbound fraction was determined as the ratio of the peak area in buffer to that in brain, with correction for dilution factor according to eq. 1 (Kalvass and Maurer, 2002):  where D is dilution factor in brain homogenate and fu(apparent) is the measured free fraction of diluted brain tissue.
MDR1-MDCKII Cell Passive Membrane Permeability Measurements. Cell culture media, bovine serum albumin, medium supplements (l-glutamine, 20 mM sodium bicarbonate, nonessential amino acids, sodium pyruvate, and colchicine), Hanks' balanced salt solution was purchased from Invitrogen (Carlsbad, CA). Transwells (12-well; 1.13-cm2 area; 0.4-μm pores) were purchased from Corning Life Sciences (Acton, MA). Krebs-Ringer bicarbonate buffer was obtained from Sigma-Aldrich Co. (St. Louis, MO).
MDR1-MDCK type II cells were obtained from National Institutes of Health (Bethesda, MD). Cells were maintained in minimum essential Eagle's medium containing 2 mM l-glutamine, 20 mM sodium bicarbonate, 0.1 mM nonessential amino acids, 1 mM sodium pyruvate, and 10% bovine serum albumin supplemented with 0.2 mM colchicine to maintain P-gp expression. For permeability experiments, cells with passage numbers 24 to 33 were seeded at a density of 60,000 cells/cm2 on rat type I collagen-coated polycarbonate membranes in 12-well transwell plates. The experiments were performed on the 8th day after seeding. Before the permeation assay, the transepithelial electrical resistance (TEER) was measured on each cell monolayer using an Endohm voltameter (WPI, Sarasota, FL). The MDR1-MDCK cell systems used in transport experiments had a high TEER value ranging from 1800 to 2000 Ω cm2, which differs from lower TEER MDR1-MDCK models often employed in CNS screens (Braun et al., 2000). The permeability assay buffer was Hanks' balanced salt solution containing 10 mM HEPES and 15 mM glucose at pH 7.4. The cells were dosed on the apical side and basolateral side, incubated at 37°C with 5% CO2 and 90% relative humidity under shaking conditions (150 rpm) to reduce the influence of the unstirred water layer. The test compounds were prepared to a final concentration of 3 μM. In the P-gp inhibition assays, the cells were incubated with 2 μM GF 120918A, a known P-gp inhibitor. Drug permeation was tested in two directions, apical to basolateral and basolateral to apical, in triplicate. Sampling was done 60 min after dosing. The Papp value was calculated as follows:  where, dCr/dt is the slope of the cumulative concentration in the receiver compartment versus time in micromolar per second, A is the area of the cell monolayer, and C0 is the drug concentration in the dosing solution, and Vr denotes the volume of the receiver compartment. The recovery of most compounds exceeded 80%.
Rat in Situ Brain Perfusion Model. The in situ rat brain perfusion procedure was similar to that described previously (Smith, 1996). Adult male Sprague-Dawley rats (300–350 g) were purchased from Hilltop Labs (Scottdale, PA). Animals were housed in a temperature-controlled animal facility at West Chester University, West Chester, PA). All of the procedures were approved by the Institutional Animal Care and Use Committee of West Chester University, and they were conducted in accordance with approved standards for laboratory animal care.
The rats were anesthetized with a solution containing 50 mg/kg ketamine and 3 mg/kg xylazine. The left common carotid artery was cannulated with a polyethylene-60 catheter (BD Biosciences, Sparks, MD) that was inserted into the left internal carotid artery for perfusion. The perfusion fluid consisted of Krebs-Ringer bicarbonate buffer, pH 7.4, and was oxygenated with a mixture air of 95% O2 and 5% CO2 before starting the perfusion. The perfusion was started immediately after the cardiac blood supply was cut off. The perfusion flow rate was 20 ml/min, and perfusate contained one of the compounds (5–50 μM). In addition, perfusate also contained the intravascular space marker atenolol at 50 μM (Street et al., 1979) and a moderate brain permeability marker, 5 μM antipyrine (Wang et al., 2005). Each compound was perfused in three animals. Following 30-s perfusion, brains were quickly removed from the skull, and the left cerebral hemisphere was excised. The isolated left brain tissue was homogenized in 4 ml of a methanol/water mixture. The resulting homogenates were stored at -80°C until analysis.
Calculation of in Situ Brain Permeability. The unidirectional transfer constant Kin (milliliters per minute per gram) and brain permeability P (centimeters per second) were determined using the following equation for the single-point perfusion assay:  and
and  where Cbr/Cpf is the apparent brain distribution volume, Cbr is the amount of drug in the brain tissue (nanograms of drug per gram of brain tissue), Cpf is the drug concentration in the perfusion fluid (nanograms of drug per milliliter of fluid), T is the net perfusion time, and S is the luminal area of the brain vascular space (taken as 150 cm2/g; Fenstermacher et al., 1988). To compensate for the drug contained in the capillary vascular space from the brain parenchymal concentration values, the apparent brain distribution volume for atenolol was subtracted from the drug values in each animal. The apparent vascular space volume in this study was 11.5 ± 1.4 μl/g brain tissue (average ± S.D.; n = 150 animals), which is in good agreement with the sucrose intravascular volume reported by Smith et al. (1988).
Analysis of Test Compounds. The analytical conditions for in situ perfusion experiments were performed at Absorption Systems (Exton, PA) as follows. Samples were introduced into the mass spectrometer by injecting 10 μl of sample through either a PerkinElmer Life and Analytical Sciences (Wellesley, MA) Series 200 HPLC system made up of an autosampler and two micropumps, or on a Leap Technologies (Carrboro, NC) HPLC system made up of a FLUX Instruments quaternary pump and a CTC Analytics HTC PAL autosampler (Presearch, Hitchin, UK). Chromatography was conducted in the reverse-phase mode on either a BDS Hypersil C18, 30- × 2.1-mm column (3 μm; Thermo-Hypersil Keystone, Bellefonte, PA), an AQUASIL C18, 30- × 2.1-mm column (3 μm; Thermo-Hypersil Keystone), or on a Capcell Pak MF C8, 50- × 2.0-mm column (5 mm; Phenomenex, Torrance, CA). The aqueous mobile phase consisted of 10% 25 mM ammonium formate buffer at pH 3.5 and 90% water. The organic mobile phase consisted of 10% 25 mM ammonium formate buffer at pH 3.5 and 90% acetonitrile. Analytes were eluted using a gradient of aqueous and organic mobile phase at a flow rate of 300 μl/min. Determination of all analytes was performed by HPLC-MS/MS detection. Analysis was performed on type API3000 or API4000 triple quadrupole mass spectrometers purchased from Applied Biosystems (Foster City, CA), equipped with an electrospray source at 450°C, and operated in the multiple reaction monitoring (MS/MS) mode. Mass spectrometer parameters were individually optimized for each analyte. Typical run times ranged from 3.5 to 4.5 min, and the optimized HPLC/MS/MS are supplied in Supplemental Material 2.
The analytical conditions for equilibrium dialysis experiments were performed at GlaxoSmithKline as follows. All samples were analyzed by means of HPLC-MS/MS on a PE-Sciex API-4000 tandem quadrupole mass spectrometer (Applied Biosystems, Streetsville, ON, Canada), using a Turbo V Ionspray operated at a source temperature of 700°C (80 psi of nitrogen). Samples (3–10 μl) were injected using a CTC Analytics HTS Pal autosampler onto a Hypersil Aquastar 3.0- × 30-mm, 3-μm column (Thermo, Runcorn, Cheshire, UK) operated at 40°C and at an eluent flow rate of 1 ml/min. Analytes were eluted using a high-pressure linear gradient program, by means of an HP1100 binary HPLC system (Agilent Technologies, Stockport, Cheshire, UK), using acetonitrile as solvent B. For HPLC-MS/MS analysis in positive ion mode, solvent A was composed of 1 mM ammonium acetate containing 0.1% (v/v) formic acid, whereas in negative ion mode, solvent A was composed of 1 mM ammonium acetate. The gradient was held at 5% solvent B for 2 min, before increasing to 90% at 1.2 min, remaining at 90% until 1.6 min before returning to the starting conditions. The cycle time was 2.5 min per sample. Relative peak areas between the PBS and tissue half-wells were used to determine the respective free fractions. Typical run times ranged from 3.5 to 4.5 min and the optimized HPLC-MS/MS are supplied in Supplemental Material 3.
Results
The compounds selected in this study included 50 drugs marketed for CNS indications, covering a wide range of physicochemical properties and chemical space. These properties vary as follows: molecular mass (136–582 Da; median 306 amu), lipophilicity (clogPoct of -0.2 to 6.1; median 3.0), and polar surface area (3–118; median 38). Hydrogen bond acceptors range between zero and five, whereas hydrogen bond donors range between zero and three. Because all of the 50 drugs have been used to treat conditions of the CNS, this compound set represents a composite profile of physiochemical properties that are required to facilitate drug disposition into the brain and achieve therapeutic concentrations.
For most CNS drugs that act directly at targets within brain tissue, it is a requirement for these molecules to first cross the BBB to elicit a therapeutic effect. No single factor dictates their CNS uptake, although lipophilicity does seem to exhibit a strong influence on this process (Table 1). The role of lipophilicity was examined against three CNS-related parameters: fu(brain) (Fig. 1a), apical-to-basolateral passive membrane permeability across a cell monolayer, measured in the presence of the P-gp inhibitor elacridar (Fig. 1b), and P (Fig. 2).
Data summary for marketed drug set showing several CNS-related parameters, lipophilicity (clogP), free fraction in brain tissue homogenate [fu(brain)], passive membrane permeability in the MDR1-MDCK cell system in the presence of elacridar (Papp), in vitro P-gp efflux ratio, and P/Papp
Influence of Lipophilicity on fu(Brain), Papp, and P. The unbound fraction in brain tissue decreases markedly with increasing lipophilicity (Fig. 1a), varying more than 1000-fold from trifluoperazine [clogPoct of 5.1, fu(brain) = 0.0007] to ethosuximide [clogPoct of 0.4, fu(brain) = 0.73]. There is, however, a notable degree of scatter in the correlation of clogPoct and fu(brain). Although measured lipophilicity data were generated on a subset of these compounds (logD and chromatography hydrophobicity index logP; data not shown), no improvement was noted over in silico estimates. In part, this degree of scatter may be related to the fact that clogPoct assesses partitioning from the aqueous phase into octanol, whereas the composition of brain tissue (either homogenate or slice) is appreciably more complex than this aliphatic alcohol. Despite this, there does seem to be a general trend toward a reduction in fu(brain) with increasing lipophilicity, and a similar observation has been noted for lead optimization compounds being screened in the current drug discovery paradigm (Summerfield et al., 2006).
In passive membrane permeability, there is a nonlinear relationship noted between clogPoct and Papp (Fig. 1b). Papp values range from 0.4 to 55 × 10-6 cm/s across the compound set, and there seems to be an inverted U-shape distribution in Papp over the 6 orders of magnitude range in lipophilicity. Papp values seem to attain a plateau around clogPoct 2 to 4, indicating an optimum range of values for transfer across the cell monolayer. This parabolic inverted “U” distribution is reminiscent of the in vivo hypnotic effect of barbiturates where the maximum in vivo effect is obtained at a logPoct of ∼2 (Hansch et al., 1968). Increasing hydrophobicity and hydrophilicity both result in a reduction of the hypnotic effect, highlighting the possibility that similar factors may influence drug distribution and activity (in both in vivo and in vitro systems) when there are aqueous phases on either side of a barrier. To reduce the influence of the unstirred water layer gentle agitation was applied to the MDR1-MDCKII incubations. In addition, correction for the unstirred layer using antipyrine as a reference yielded no change in the trends observed.

a, graph showing the relationship between fu(brain) and lipophilicity (clogPoct). Regression analysis (Y = 0.7656 × [Poct]-0.4462; R2 = 0.664) includes P-gp substrates (□), in vitro efflux ratio ≥3) and P-gp nonsubstrates (♦). b, graph showing the relationship between passive membrane permeability from MDR1-MDCK assay and lipophilicity (clogPoct).

Graph showing the relationship between permeability surface product (P) and lipophilicity (clogPoct) for P-gp substrates (□, in vitro efflux ratio ≥3) and P-gp nonsubstrates (♦).
Lipophilicity and its relationship to in situ brain permeability are examined in Fig. 2. In this study, brain perfusions were performed over a 30-s period to ensure that the Kin values were determined on the linear region of the brain uptake curve. This also facilitated the analysis of a large set of compounds (n = 50) to examine trends across a wide lipophilicity range. Brain permeability was calculated by normalizing Kin for the luminal area of the brain vascular space, which gives comparable units to the in vitro Papp values measured for each compounds (i.e., centimeters per second). Similar units for P and Papp were considered more appropriate for subsequent data analysis (Fig. 4b). Converting Kin to permeability surface product via the Crone-Renkin equation yields comparable correlations to those presented for P. The flow component was taken as the highest Kin measured (Sertraline; data not shown).
The perfusion fluid contained the analyte of interest in addition to two reference compounds: atenolol as a marker of vascular volume, and antipyrine as an indicator of perfusate flow and relatively free unrestricted passive transfer through the endothelial cell membrane. From the atenolol brain concentration measurements, the vascular volume was consistent across all animals in the study (11.5 ± 1.4 μl/g; n = 150), whereas the P of antipyrine (0.046 ± 0.001 × 10⁻³ cm/s; n = 150) was similar to that determined previously (Ohno et al., 1979).
The CNS drug set used in this analysis covers a wider range of lipophilicity (6 orders of magnitude), with 75% of the compounds being characterized by clogPoct values in excess of 2. Figure 2 shows that P displays a nonlinear relationship with clogPoct, characterized by a linear portion (clogPoct < 2–3) and a plateau region (clogPoct > 2–3). Furthermore, above a clogPoct of approximately 3, most of the compounds are characterized by P values between 0.2 and 0.5 × 10⁻³ cm/s; this includes diazepam (P = 0.22 × 10⁻³ cm/s). Previous studies have highlighted a good correlation (R2 > 0.9) between octanol/water partition ratios and P, although these assessments were generally restricted to compounds where the logPoct was less than 2 (for review, see Smith, 1996). Likewise, in this analysis some correlation is noted between lipophilicity and P below a clogPoct of 2. The plateau effect noted in Fig. 2 would suggest that the uptake of these lipophilic drugs may be due to flow limited distribution into the brain during the in situ perfusion, i.e., the rate of brain penetration is maximal. One notable outlier is lamotrigine (P = 0.014 × 10⁻³ cm/s; clogPoct of -0.2), which is characterized by a higher P than would be expected from the compounds lipophilicity. In human subjects, lamotrigine has been shown to freely pass into the brain with a mean brain/serum ratio of 2.8:1 (Meyer et al., 1999). None of the physicochemical properties examined would indicate this behavior, whereas no evidence is available for active brain uptake. Further analysis of lamotrigine is required.
No clear difference in P is observed between P-gp substrates and P-gp nonsubstrates. This is in contrast to previous reports that P-gp substrates showed reduced permeability surface product values relative to nonsubstrates for a given lipophilicity (Youdim et al., 2004). Generally, however, these reports have used radiotracers for the determination of P, whereas this study used HPLC-MS/MS analysis, which requires higher analyte concentrations (5000–50,000 pmol/μl) relative to radiodetection. Hence, the similarity of P-gp substrates and nonsubstrates in this study is likely to be a function of the higher perfusion concentrations and a possible partial or complete saturation of the efflux transporter.
Influence of Passive Membrane Permeability and fu(Brain) on P. Figure 3 examines the relationship between P and Papp in which two differing groups of behavior are defined, group A and B. In group A, P lies in the region of 0.15 to 0.5 × 10⁻³ cm/s, and it is relatively insensitive to changes in Papp over the range 1 to 50 × 10-6 cm/s. For group B, P increases in proportion to Papp over the 1 to 50 × 10-6 cm/s range. A rationale for this behavior becomes apparent when lipophilicity is factored into the plot (Fig. 3). Group A seems to be made up of largely lipophilic compounds (clogPoct > 3), whereas group B is largely made up of the less lipophilic drug molecules (clogPoct < 3). This suggests that multiple parameters need considering to rationalize the magnitude of P.
Because the CNS compartment makes up both the BBB and the brain parenchyma, it is possible that drug uptake into the brain is a composite function of both permeability across the BBB and binding to brain tissue. Figure 4, a and b, consider the inter-relationship between P, Papp, clogPoct, and fu(brain). Here, Papp has been used as a surrogate for the intrinsic passive permeability across the BBB in the absence of tissue binding. In an attempt to factor out the influence of passive permeability across the BBB, a hybrid term has been used in this analysis, P/Papp. Against lipophilicity there is a rather weak correlation with P/Papp (R2 = 0.45); however, this is improved markedly by the comparison with fu(brain) (R2 = 0.74; Fig. 4b). This raises the possibility that P may be influenced not only by intrinsic BBB permeability (with Papp used as a surrogate in this analysis) but also the drugs affinity for brain tissue. The classic view of brain permeability would suggest that due to the short time frame of the perfusion (30 s), the brain acts as an infinite sink with respect to distribution. Under this assumption, the rate of drug transfer across the BBB would then be the dominant factor. Figure 4b offers the alternative hypothesis that even at short perfusion times binding to brain tissue acts as a sink to help drive CNS uptake. Again, the P-gp substrates are distributed evenly around the regression line, indicating that this transporter is not influencing P under these experimental conditions.

Graph showing the relationship between passive permeability (Papp in presence of GF 120918) and permeability surface product (P). Group A (denoted as ▪) are characterized by clogPoct ≥ 3. Group B (denoted as ▴) are characterized by clogPoct < 3.

a, graph showing the relationship between lipophilicity (clogP) and P/Papp. Regression analysis (Y = 0.7988 × [Poct]0.3149; R2 = 0.46) includes P-gp substrates (□, in vitro efflux ratio ≥3) and P-gp nonsubstrates (♦). b, graph showing the relationship between fu(brain) and P/Papp. Regression analysis (Y = 0.5984 × [Poct]-0.7095; R2 = 0.74) includes P-gp substrates (□) and P-gp nonsubstrates (♦). Gabapentin was omitted from the correlation due to BBB transporter interactions (Uchino et al., 2002).
Despite the correlation noted in Fig. 4b, there are four outliers to the trend, namely, fluphenazine, isocarboxazid, phenelzine, and ziprasidone. The reason for the discrepancy in this correlation is not clear, and based on their physicochemical properties, they do not form a homogenous group. One possibility is the existence of active uptake, because, for example, fluphenazine has been found to interact with the brain glucose transporter (Ardizzone et al., 2001). Excluding these points from the regression analysis would lead to a further improvement in the correlation (R2 = 0.87), but more analysis is required to understand these outliers.
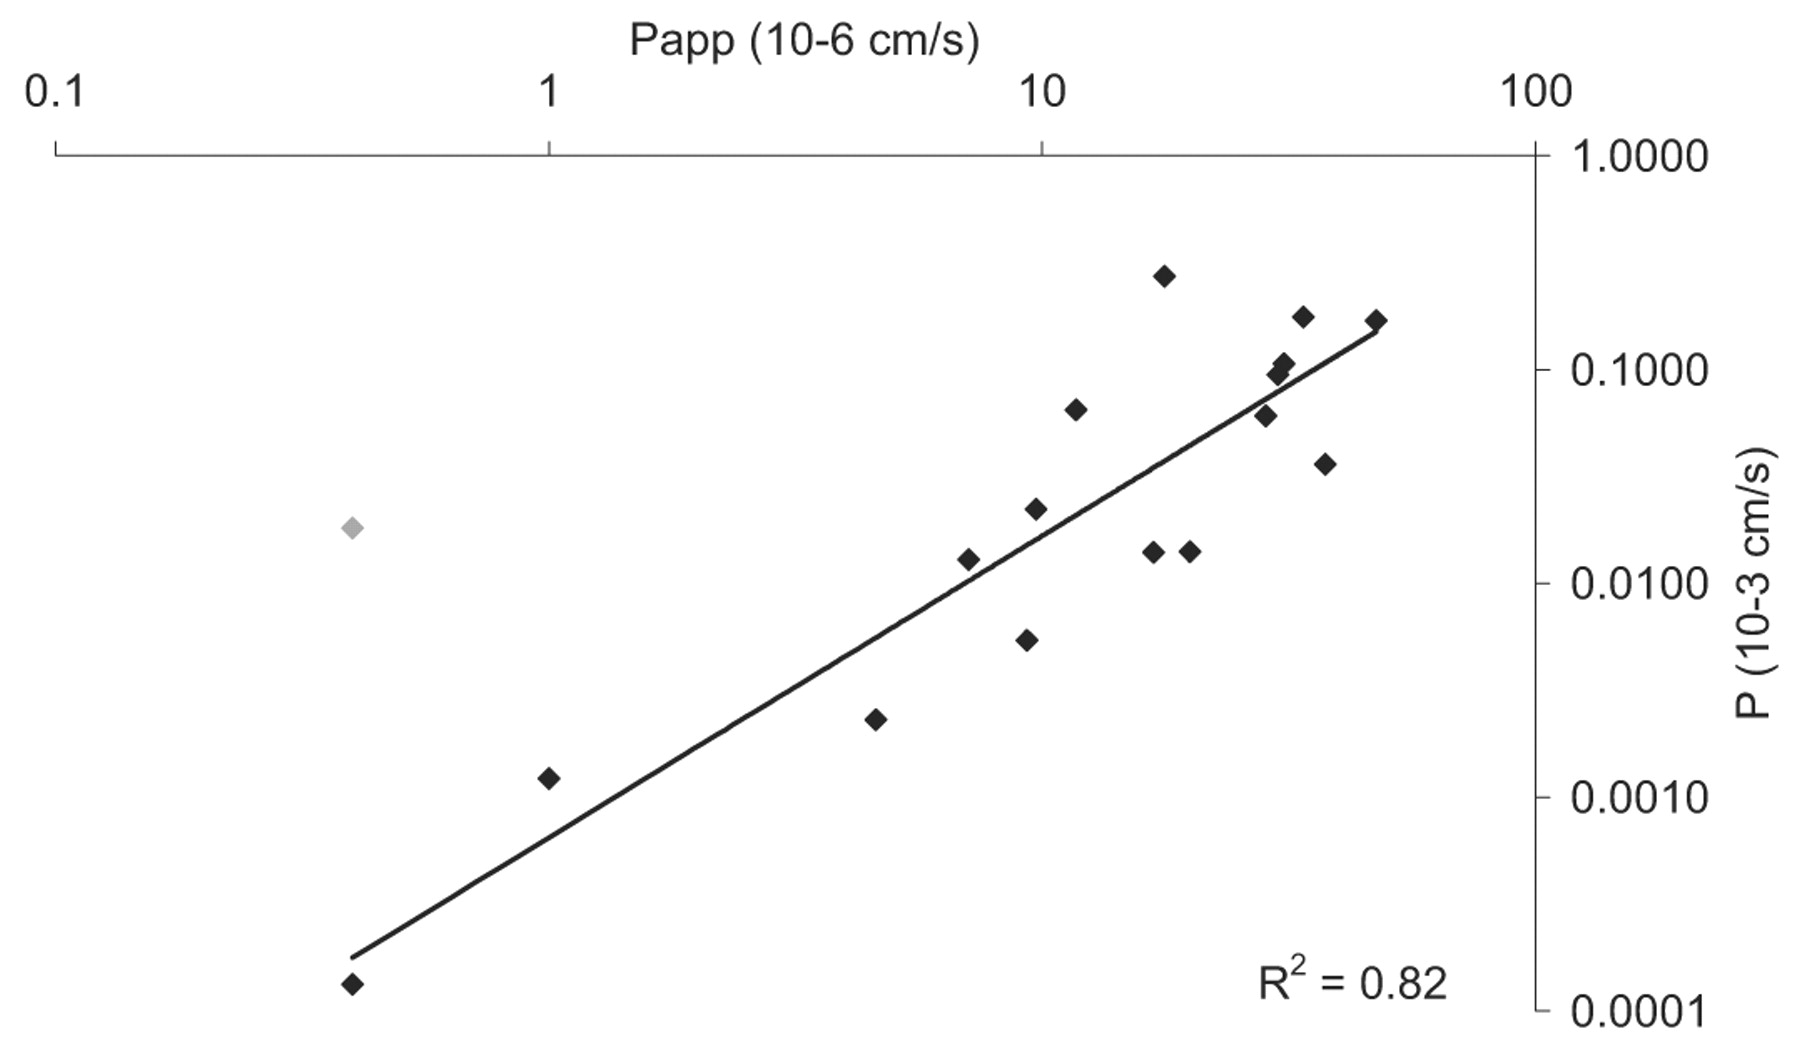
Despite the overall nonlinear relationship highlighted in Fig. 2 between clogPoct and P, there does seem to be a more a linear region for drugs characterized by a clogPoct below approximately 2. The low lipophilicity of these drugs results in a low degree of brain tissue binding, and under these circumstances, it may be expected that passive membrane permeability across the BBB would have a greater influence on the magnitude of P, rather than fu(brain). Indeed, this seems to be the case (Fig. 5) when fu(brain) is greater than 0.1 (R2 = 0.82), although gabapentin has been excluded as an outlier from this correlation. The lipophilicity of gabapentin (clogPoct of 1.2) would suggest a lower P values than observed (0.018 × 10⁻³ cm/s), although this may be due to active transport at the level of the BBB (Uchino et al., 2002). Incorporating additional compounds with lower fu(brain) leads to a rapid deterioration in the correlation coefficient between P and Papp, suggesting a progressively important and influential role for the extent of brain tissue binding.
In summary, P may be influenced not only by the permeability across the BBB but also the affinity of a given drug for brain tissue, particularly where tissue binding begins to increase [fu(brain <0.1]. It is clear that there are outliers to this correlation (Fig. 4b) along with some variance not accounted for. These factors require further study.
Discussion
Drug delivery to targets within the brain represents a major obstacle in the development of CNS drugs, Because more than 98% of all new candidates do not cross the BBB efficiently (Terasaki and Pardridge, 2000). For that reason, significant efforts have been made to elucidate the factors that influence drug permeation across the BBB and to develop predictive absorption, distribution, metabolism and elimination models early in drug discovery (Fischer et al., 1998; Mahar Doan et al., 2002; Wang et al., 2005). This analysis comprises a set of compounds spanning a wide range of both physicochemical properties and targets within the CNS. Lipophilicity ranges 6 orders of magnitude, which is representative of the distributions noted in previous reviews of the properties for a variety of marketed CNS drugs (Bodor and Buchwald, 2003). In terms of P measurements, however, this current study greatly increases the number of compounds assessed above a logPoct of 2 and provides new insight on the inter-relationship between BBB permeability and tissue binding within the brain.

Plot of passive membrane permeability against P for compounds where fu(brain) > 0.1 (regression analysis: Y = 0.0007 × [Poct]1.4076; R2 = 0.82). Gabapentin has been omitted from the correlation (♦) as an outlier, possibly due to interaction with BBB transporters (Uchino et al., 2002).
The fraction of free drug available within the brain extracellular fluid is clearly seen to depend on lipophilicity, differing up to a 1000-fold between the most hydrophilic and lipophilic compounds in the test set. Hansch et al. (1968) were among the first to use the octanol/water partitioning system to represent the two extremes of the biophase and this scale of lipophilicity has been invaluable in understanding the trends in biological activity and absorption, distribution, metabolism and elimination properties. The use of 1-octanol lends itself well to the high-throughput assessment of drug partitioning, but it does represent a great simplification in terms of the composition of the biophase compartment, or brain tissue in this instance. This can be seen in Fig. 1a where the correlation of clogPoct and fu(brain) can show marked scatter and also in Fig. 4, a and b, where the relationship with P and Papp is improved with the use of fu(brain) over clogPoct. In this instance, octanol/water partitioning provides a first approximation to the in vivo situation, whereas binding in brain tissue homogenate is more representative of intact tissue.
The influence of lipophilicity also highlights an intriguing difference between the permeability measured either in vitro (Papp) or in vivo (P). In terms of Papp, there seems to be an inverted U-shape distribution with increasing lipophilicity, showing a plateau around a clogPoct of 2 to 4. These results are in accordance with a previous indication that drug membrane permeation is not proportionally elevated with respect to increases in lipid solubility (Cohen and Bangham, 1972). In the in situ paradigm, P shows a similar trend when clogPoct is less than 4, although the plateau extends to higher lipophilicities (clogPoct > 6). A possible rationale for this behavior is presented in Fig. 6, which depicts the compartments of the two experimental techniques. For the in vitro permeability experiment, the apical and basolateral compartments are both aqueous environments where the free fraction is unity, because no protein is added to either reservoir. Compounds in the clogPoct range 2 to 4 are able to partition sufficiently into both membranes and the aqueous environment, such that the drug is first able to enter the cell membrane and then favorably partition out again into the aqueous basolateral compartment. With increasing lipophilicity, there is a reduced driving force for the compound to partition back into the aqueous media in vitro, or alternatively, a greater significance of the unstirred water layer. This latter effect was minimized by the experimental design of the in vitro permeability experiment. In addition, no correlation was observed between recovery and lipophilicity (data not shown), highlighting that the trends in Fig. 1b are probably the result of the physicochemical characteristics of the drug.

Comparison of the compartments and barriers between in situ brain perfusion and in vitro BBB model, such as MDR1-MDCK. Free fraction in each compartment is denoted by fu.
In contrast to in vitro models, the in situ perfusion experiment is characterized by a protein-free perfusate (i.e., fu = 1) but a brain compartment where tissue binding may occur, i.e., fu(brain). Flow limited uptake into the CNS seems to occur around a clogPoct of approximately 2, and hence P becomes relatively insensitive to further increases in lipophilicity. Therefore, at high lipophilicities (clogPoct > 4), the brain tissue binding may be acting as a drug sink, which then helps to maintain the diffusion gradient across the BBB. This facilitates the brain penetration of lipophilic drugs that would otherwise seem to be poorly permeable as in the in vitro system. Other differences between the two systems may also play a part in the shapes of the distributions shown in Figs. 1 and 2, such as the volume of the acceptor compartment in the in vitro assay. Also the in vivo brain tissue volume substantially surpasses that of the acceptor chamber in the in vitro system. For the most hydrophilic drugs present in the set [fu(brain) < 0.1], there is a linear correlation between Papp and P (R2 = 0.82). Polli et al. (2000) observed a similar trend between rat in situ brain perfusion (Kin) and the apparent permeability (Papp) derived from MDCK type I cells. Here, an initial rising linear phase was followed by a plateau comparing Papp and Kin. The majority of the hydrophilic compounds in the set made up the initial linear phase (R2 = 0.86). Additionally Lundquist et al. (2002) observed a linear correlation between brain uptake index and the permeability coefficient derived from a passaged bovine brain endothelial coculture cell model for a range of predominantly hydrophilic molecules. An R2 value of 0.86 was noted on the logarithm-transformed data.
Figures 3 and 4 also suggest that there is an intrinsic link between BBB permeability and brain tissue binding; therefore, in vivo measures are likely to be influenced by both factors. In the range of lipophilicities lower than a clogPoct of 1, it seems that passive membrane permeability plays a greater influence on uptake into the CNS, whereas the sink action of tissue binding becomes important for more lipophilic drug molecules. An additional factor that may influence discrepancies between Papp and P is the presence of active uptake mechanisms in vivo that are absent in the in vitro model. Gabapentin is recognized by the large neutral amino acid transporter at the BBB (Uchino et al., 2002). In the absence of active uptake, gabapentin has a relatively poor passive permeability (0.4 × 10⁻⁶ cm/s), suggesting it would be too hydrophilic to significantly cross the BBB, yet its P value is quite substantial (0.018 × 10⁻³ cm/s). Knowledge of fu(brain) provides a means to place in vitro Papp values into a context relative to in situ measurements of P. From the results presented in this analysis, the MDR1-MDCKII cell model in conjunction with brain tissue binding and brain permeability across the BBB seems to be a useful tool in helping to rationalize CNS drug disposition. Clearly, careful consideration should be made in the choice of cell model. Lundquist et al. (2002) demonstrated a poor correlation between brain uptake index and the permeability coefficient derived from the Caco-2 cell line. However, as Caco-2 cells express a number of enzymes and transporters not found in brain endothelium, this finding may not be too surprising. Conversely, MDCK cells have low expression of transporters and little metabolic activity (Braun et al., 2000); therefore, they offer a more neutral test bed for which to study passive permeation.
In summary, BBB permeability and brain tissue binding play important roles in the disposition of CNS drugs. As cautioned recently by several authors, the success of CNS compounds as therapeutics should be viewed in terms of BBB permeability, drug pharmacological profile at the target as well as interaction with brain parenchyma (Lee et al., 2001; Doran et al., 2005; Summerfield et al., 2006).
Permeability seems to be an important factor for compounds characterized by low brain tissue binding [fu(brain > 0.1] and low lipophilicity (clogPoct < 1). Brain tissue binding becomes important with increasing lipophilicity and may act as sink to help maintain the diffusion gradient across the BBB. Eventually, however, further increases in fu(brain) do not realize further increases in uptake across the BBB due to flow limited distribution into the brain. This raises the notion that a more complete picture CNS disposition is gained by considering the role of fu(brain) together with a measure of BBB permeability, such as Papp or P, and such approaches may serve to improve the selection of new chemical entities with optimal physicochemical properties for CNS disposition. Information on the potential for drug efflux at the BBB is a further factor to consider when placed in the context of the extent of brain tissue binding (Summerfield et al., 2006). A recent physiologically based pharmacokinetic model was reported by Liu et al. (2005), which highlighted the dual role of P and fu(brain) in determining the rate of drug entry into the brain. These findings are consistent with the results reported in this study and may contribute to improved compound selection for CNS delivery.
Acknowledgments
We thank Kim Matthews, Maria Osuna, Alexander Stevens, Adam Lucas, Sue Fenwick, Joseph Rager, and Glenn Dobson for contributing to this article.
Footnotes
-
Article, publication date, and citation information can be found at http://jpet.aspetjournals.org.
-
doi:10.1124/jpet.107.121525.
-
ABBREVIATIONS: CNS, central nervous system; BBB, blood-brain barrier; P, in situ brain permeability; Papp, apparent membrane permeability; fu(brain), in vitro free fraction in brain tissue; clogPoct, log octanol/water partition coefficient; MDR, multidrug resistance; MDCK, Madin-Darby canine kidney; PBS, phosphate-buffered saline; TEER, transepithelial electrical resistance; P-gp, P-glycoprotein; HPLC, high-performance liquid chromatography; MS/MS, tandem mass spectrometry; GF120918A, N-(4-{2-[6,7-bis(methyloxy)-3,4-dihydro-2(1H)-isoquinolinyl]ethyl}phenyl)-5-(methyloxy)-9-oxo-9,10-dihydro-4-acridinecarboxamide hydrochloride.
-
↵
 The online version of this article (available at http://jpet.aspetjournals.org) contains supplemental material.
 - Received February 15, 2007.
- Accepted April 2, 2007.

- The American Society for Pharmacology and Experimental Therapeutics


