


Abstract
Inflammatory stimuli such as bacterial lipopolysaccharide (LPS) have been shown to down-regulate the mRNA and protein expression of hepatic cytochrome P-450 (P-450) isozymes 2C11, 2C12, 2E1 and 3A2 and to induce the mRNA expression of the P-450 4A subfamily. In this study, we examined the effects of irritants on the hepatic and renal expression of P-450 2C11, 2E1 and 3A2 and the 4A subfamily in the rat. Fischer 344 rats were administered doses of SiO2 (Celite), BaSO4, kaolin and LPS intraperitoneally and killed after different times for hepatic and renal RNA and microsome isolation. The administration of each irritant was found to suppress hepatic P-450 2C11 mRNA and protein and to induce P-450 4A1, 4A2 and 4A3 mRNA expression while having no significant effect on P-450 2E1 or 3A2. P-450 4A2, 4A3 and 2E1 mRNAs were all induced in the kidney cortices of the irritant- and LPS-treated rats. The effects of BaSO4and SiO2 were found to be dose dependent. Chlorzoxazone-6-hydroxylase activity increased in the kidneys of irritant-treated rats, which is consistent with an increased expression of P-450 2E1. All irritants were found to induce the mRNA for the acute-phase protein fibrinogen; however, in contrast to LPS treatment, none of the irritants that were tested induced hepatic inducible nitric oxide synthase mRNA expression. These findings demonstrate the induction of renal P-450 isozymes after irritant and LPS administration. The findings of this study also suggest that different inflammatory stimuli affect the individual P-450 isozymes differentially.
During infection or inflammatory stress, the capacity of the liver to metabolize many drugs is impaired due to a reduction in the hepatic P-450 content (Mahu and Feldman, 1984; Renton, 1986). The administration of inflammatory stimuli such as LPS (Gorodischer et al., 1976), IFN inducers (Morgan and Norman, 1990; Renton and Knickle, 1990) or irritants (Beck and Whitehouse, 1974) to laboratory animals causes these effects. In rats injected with LPS, the hepatic levels of several constitutively expressed P-450 mRNAs and proteins are significantly down-regulated (Morgan, 1989, 1993). Recently, we demonstrated an induction of the P-450 4A subfamily mRNAs in the livers of rats injected with LPS (Seweret al., 1996). This induction of P-450 4A mRNAs was found to exhibit strain differences, whereas the suppression of P-450 2C11, 2E1 and 3A2 did not.
Although treatment of rats with LPS or irritants that cause systemic inflammation results in decreased drug metabolism and a decrease in total hepatic microsomal P-450, it is not known whether LPS and agents that cause systemic inflammation affect individual P-450s in the same manner. LPS administration directly activates Kupffer cells, resulting in high hepatic concentrations of IL-6, TNF-α (Billiar et al., 1992) and NO (Curran et al., 1990). Both in vitro and in vivo studies have shown that the cytokines IL-1β (Barker et al., 1992), IL-6 (Chen et al., 1992), TNF-α and IFN-γ (Chen et al., 1995) can act directly on the hepatocyte to bring about changes in P-450 gene expression. After the localized injection of an irritant, however, cytokines are released into the systemic circulation. Thus, the levels of cytokines that the hepatocyte encounters after administration of an irritant are lower (Billiar et al., 1992). Although both LPS and systemic inflammatory stimuli cause induction of hepatic acute-phase protein expression, only LPS induces hepatic iNOS (Gelleret al., 1994).
Two of the classes of the P-450 isozymes (4A and 2E1) that were affected by inflammation are also expressed in the kidney cortex, with highest concentrations in the S3 segment of the proximal tubules (Endou, 1983). The P-450 4A isozymes in the rat kidney are induced after the administration of the peroxisome proliferator clofibrate (Kimura et al., 1989; Sharma et al., 1989). Induction of the P-450 4A subfamily results in increased ω-hydroxylation, notably of arachidonic acid (Omata et al., 1992). The production of 20-hydroxyeicosatetraenoic acid, the major arachidonate metabolite in the kidney cortex and a potent vasoconstrictor (Escalante et al., 1993), also correlates with increased P-450 4A expression (Lin et al., 1994). Renal P-450 2E1 has been shown to be induced by ethanol (Roberts et al., 1994) and pyridine (Hotchkiss et al., 1995), and during ketosis, it is induced by a high-fat diet (Yun et al., 1992). To our knowledge, there have been no studies in which the effect of inflammatory stimuli on renal P-450 expression was examined.
In the present study, we investigated the effects of LPS and several irritants that elicit a systemic inflammatory response on both renal and hepatic expression of several constitutively expressed P-450 isozymes. We demonstrate that both LPS and the irritants SiO2 (Celite), kaolin and BaSO4 suppress hepatic P-450 2C11 mRNA and protein and concomitantly induce the mRNAs of the P-450 4A subfamily. We also show an induction of P-450 4A and 2E1 mRNAs in the kidneys of rats that had been administered LPS or any of the above-mentioned irritants.
Materials and Methods
Animals and treatments.
Male Fischer 344 rats (Harlan, Inc., Indianapolis, IN) that were 6 to 8 weeks old were used. The animals were allowed free access to food and water at all times. Chromatographically purified Escherichia coli LPS, serotype 0127:B8 (Sigma Chemical Co., St. Louis, MO), was dissolved through sonication in sterile 0.9% saline to 1.0 mg/ml and injected intraperitoneally at a dose of 1.0 mg/kg b.wt. Suspensions of BaSO4 (5 g/kg), kaolin (500 mg/kg) and SiO2(200 mg/kg) in phosphate-buffered saline were injected intraperitoneally. BaSO4-treated rats received a 2.0-ml volume, whereas all other irritants were administered in a volume of 1.0 ml. For dose-response studies, animals were injected intraperitoneally with BaSO4 at doses of 0.1, 0.3, 1 and 3 g/kg or with SiO2 at doses of 25, 100, 200 and 400 mg/kg. Control animals received an equivalent volume of sterile saline. The animals were killed by CO2 asphyxiation at the appropriate times. These procedures were approved by the Institutional Animal Care and Use Committee of Emory University.
Preparation of microsomes and total RNA.
Livers and kidney cortices were excised and perfused with cold 1.15% KCl. Pyrophosphate-washed hepatic and renal microsomes were prepared as described by Haugen and Coon (1976). Total RNA was prepared according to the method of Chomczynski and Sacchi (1987). Microsomes and total RNA were stored at −80°C.
RNA Northern and slot blots.
Total RNA concentration was determined spectrophotometrically at 260 nm. Northern blotting was performed as described previously (Sewer et al., 1996). Formaldehyde-containing agarose gels (1.5%) were used to subject denatured RNA to electrophoresis at 70 V for 4 hr. The RNA was blotted onto MagnaGraph nylon transfer membrane filters (Micron Separations Inc., Westboro, MA) overnight and was fixed by both UV irradiation and baking at 80°C. The blots were hybridized to cDNA or oligonucleotide probes, washed and subjected to autoradiography.
Slot blots were prepared as described previously (Morgan, 1989). Total RNA was denatured using formaldehyde and loaded onto Nytran maximum-strength filters (Schleicher & Schuell, Keene, NH) in the slot blot manifold. The RNA was immobilized by both UV irradiation and baking at 80°C. All slot-blot results were normalized to the content of poly(A)+ RNA as measured by probing slot blots with an oligo(dT)30 probe (Hollander and Fornace, 1990; Wright and Morgan, 1991).
cDNA and oligonucleotide probes.
CYP2C11 andCYP2E1 mRNAs were detected using full-length cDNAs forCYP2C11 (Ström et al., 1988) andCYP2E1 (generously donated by Dr. F. J. Gonzalez, National Institutes of Health, Bethesda, MD). Levels of iNOS were determined using a 956-base-pair cDNA corresponding to region 3007–3943 of the rat astroglial iNOS (generously donated by Dr. D. L. Feinstein, New York Hospital-Cornell Medical Center, New York, NY). Glyceraldehyde-3-phosphate dehydrogenase and fibrinogen mRNA levels were detected as previously described (Morgan et al., 1994). The P-450 4A1 oligonucleotide probe used and its characterization have been previously described (Sewer et al., 1996). The P-450 4A2 and 4A3 oligonucleotide probes were those described by Kimuraet al. (1989). Hybridization conditions for the P-450 4A oligonucleotides are described in Sundseth and Waxman (1992). Relative abundancies of CYP3A2 and AGP mRNAs were measured using oligonucleotides complementary to nucleotides 1690–1729 ofCYP3A2 (Gonzalez et al., 1986) and nucleotides 655–684 of AGP mRNA (Ricca and Taylor, 1981). A 28S rRNA oligonucleotide probe (Barbu and Dantry, 1989) was used to control for loading and transfer artifacts on Northern blots. The Megaprime labeling kit (Amersham, Arlington Heights, IL) and [α-32P]dCTP were used to radiolabel cDNA probes. T4 polynucleotide kinase and [γ-32P]ATP were used to 5′-end radiolabel oligonucleotide probes. Blots probed with the P-450 4A oligonucleotides were washed as previously described (Sewer et al., 1996). The hybridization and stringency wash conditions for all other oligonucleotide probes have been described before (Morganet al., 1994). All blots probed with cDNA probes were hybridized at 42°C and washed at 62°C. Bound32P-labeled probes were detected by autoradiography and quantified by analysis on either a Lynx video densitometer (Applied Imaging, Santa Clara, CA) or a Personal laser densitometer (Molecular Dynamics Ltd., Sunnyvale, CA). All assays were performed under previously established conditions of linearity between the amount of the target mRNA on the filter and the densitometric response.
Assays of hepatic microsomes.
Total microsomal protein was determined by the method of Lowry et al. (1951). P-450 concentrations were determined from the CO difference spectrum of the reduced protein at 450 nm (Omura and Sato, 1964).
Western blot immunoassays.
The relative levels of various P-450 isozymes in the microsomes were measured by Western blotting. Proteins were separated by polyacrylamide gel electrophoresis (7.5% polyacrylamide) in the presence of sodium dodecyl sulfate and electrophoretically blotted onto nitrocellulose membranes (Schleicher & Schuell). Levels of P-450 4A proteins in microsomal samples were measured with a polyclonal antibody to P-450 4A1 (generously donated by Dr. G. G. Gibson, University of Surrey) as described previously (Seweret al., 1996) using the ECL detection system (Amersham Life Sciences) according to the manufacturer’s instructions. The intensities of the stained bands were measured by laser densitometry and were determined to be proportional to the amount of antigen loaded on the blot within the experimental range used. Procedures for measuring P-450 2C11, 2E1 and 3A2 have been described previously (Morgan et al., 1994). The antibodies to P-450 2E1 and 3A2 were generous gifts from Dr. Magnus Ingelman-Sundberg (Karolinska Institute, Stockholm, Sweden) and Dr. James Halpert (University of Arizona), respectively.
Laurate and chlorzoxazone assays.
Lauric acid ω- and ω-1 hydroxylase activities of the microsomes were determined using reverse-phase high performance liquid chromatography (Laethem and Koop, 1992; Okita et al., 1991; Sewer et al., 1996). Chlorzoxazone-6-hydroxylation activities were determined under conditions that were linear with respect to time and protein concentration at 37°C. Reaction mixtures contained 200 μM chlorzoxazone (added from a stock solution of 10 mM chlorzoxazone prepared fresh daily in 60 mM KOH), 100 mM potassium phosphate buffer, pH 6.8, and 0.2 mg of microsomal protein in a final volume of 1 ml and were initiated by the addition of 1 mM NADPH. After a 10-min incubation, the reactions were terminated with 50 μl of 43% phosphoric acid, and 2.5 nmol of 5-fluoro-benzoxazole was added as an internal standard (Peter et al., 1990). The reactions were extracted as described by Mapoles et al. (1993), and the metabolites were separated by reverse-phase high performance liquid chromatography using a Supelco Supelcosil LC-18 column (150 × 4.6 mm, 5 μm). The mobile phase consisted of 10% acetonitrile/90% water with 0.5% glacial acetic acid isocratically for the first 16 min, after which the acetonitrile concentration was increased to 25% for the last 4 min. The flow rate was 2.0 ml/min. The effluent was monitored at 287 nm, and the amount of product was determined from the peak area ratio of the metabolite and internal standard compared with standard curves generated with known amounts of product.
Statistical analysis.
One-way analysis of variance and the Student-Newman-Keuls test were used to test for significant differences between the group mean values. All results are expressed as mean ± S.E.M. for each group of animals.
Results
Suppression of multiple hepatic P-450 mRNAs by irritants.
We have shown previously that in vivo administration of LPS down-regulates the expression of P-450 2C11, 3A2 and 2E1 mRNAs and proteins (Morgan, 1989; Sewer et al., 1996). There have been only a few reports OR has the expression of P-450s after the administration of an agent that elicits a systemic inflammatory response from a remote site of initiation. Muntane et al.(1995) found that carrageenan-induced granuloma caused decreased expression of P-450 2E1, 2D, 4A and 3A1 in rat liver. We also found that turpentine suppresses hepatic P-450 2C11 expression (Morgan, 1989). However, due to the complex hydrocarbon mixture in turpentine, we decided to pursue this question by analyzing the effects of particulate irritants. It has been previously shown that kaolin, when administered intraperitoneally at 100 mg/kg, results in acute inflammation and lengthened hexobarbital sleep time (Beck and Whitehouse, 1974). Intraperitoneal injection of 2 ml of a 50% (w/v) BaSO4 suspension causes a well-tolerated, sterile, chemical peritonitis and induces the hepatic acute-phase reactants (Ufkeset al., 1988). Similarly, SiO2 has been shown to result in a sterile peritonitis and induction of acute-phase proteins (Arrhenius and Hutlin, 1962). To determine whether a systemic inflammation produced by injection of sterile irritants could affect P-450 expression, doses of BaSO4, kaolin and SiO2, which have been shown to cause acute inflammation and increased acute-phase reactants in the studies cited above, were injected intraperitoneally in male Fischer 344 rats, and hepatic total RNA and microsomes were prepared 48 hr later. The 48-hr time point was chosen on the basis of the effects observed in the above-mentioned studies after this treatment duration.
Figure 1A shows a Northern blot of hepatic RNA isolated from rats treated with BaSO4, kaolin or SiO2. All irritants that were tested resulted in decreased P-450 2C11 mRNA expression (fig. 1A). Densitometric analysis of slot blots of the same samples probed for P-450 2C11 revealed that the most effective irritants in decreasing hepatic P-450 2C11 mRNA levels were SiO2 and BaSO4, which suppressed P-450 2C11 mRNA to 12% and 10% of control levels, respectively. Although both Northern and slot blots were probed to assay for the various mRNAs examined in this study, all quantitative data presented are from slot blots. Densitometric scanning and quantitation of Northern blots yielded similar results in each case.

Effects of irritant treatment on hepatic P-450 mRNA expression. Rats were administered SiO2, BaSO4, or kaolin and killed after 48 hr. Total hepatic RNA was isolated and was subjected to Northern blot analysis as described in Materials and Methods. A, Representative Northern blot probed with cDNAs for P-450 2C11 and 2E1, glyceraldehyde-3-phosphates dehydrogenase and an oligonucleotide for P-450 3A2. B, Northern blots dehydrogenase probed with oligonucleotides for P-450 4A1, 4A2 and 4A3 rRNA. The numerical data presented under the Northern blots represent densitometric analysis of slot blots probed for the respective mRNAs (n = 5 animals per group). Treated groups are expressed as a percentage of the control group mean. Numerical averages for the individual P-450 mRNAs were normalized to the poly(A)+ content of the sample. *Significantly different from control, P < .05.
Hepatic P-450 2E1 and 3A2 mRNA levels were not significantly different from those in untreated animals (fig. 1A). This finding differs from our previous studies with LPS showing decreased P-450 2E1 and 3A2 expression at both the mRNA and protein levels (Sewer et al., 1996). However, in the present study, animals were treated with the irritants for 48 hr, whereas in our previous experiments rats were treated with LPS for 24 hr.
Induction of hepatic P-450 4A mRNAs by irritants.
Prior studies of the effects of LPS on the P-450 4A subfamily revealed induced hepatic expression of P-450 4A1, 4A2 and 4A3 mRNAs (Seweret al., 1996). The Northern blots in figure 1B show a significant increase in the amount of hepatic P-450 4A1 mRNA after treatment with all irritants tested. SiO2, BaSO4 and kaolin increased P-450 4A1 mRNA levels by 2.0-, 2.0- and 2.2-fold, respectively (fig. 1B). P-450 4A2 and 4A3 mRNA levels in rats treated with the irritants were not significantly different from those in control animals. We previously conducted experiments examining the effect of clofibrate on hepatic P-450 mRNA expression. The injection of 500 mg/kg clofibrate intraperitoneally resulted in a 7.0-fold induction of P-450 4A1, a 1.6-fold induction of P-450 4A2 and a 50.1-fold induction of P-450 4A3 at 24 hr later (data not shown). These experiments, however, were carried out in Sprague-Dawley rats. Sundseth and Waxman (1992) found increases in P-450 4A1, 4A2 and 4A3 hepatic mRNA expression of 39-, 8.4- and 10.5-fold, respectively, after intraperitoneal injection of 400 mg/kg clofibrate into Fischer 344 rats.
Analysis of hepatic P-450 proteins after irritant treatment.
Western blot analysis of microsomal P-450 protein expression from rats treated with the irritants indicated decreased P-450 2C11 levels after the administration of all four of the irritants tested (fig.2A). SiO2 and BaSO4 were again the most effective agents in decreasing P-450 2C11 protein, causing declines in P-450 2C11 protein to 19% and 16% of levels in saline-treated control rats, respectively. Kaolin decreased P-450 2C11 protein to 40% of control levels.

Effect of irritant treatment on levels of P-450 proteins in hepatic microsomes of Fischer 344 rats. Rats were administered SiO2, BaSO4 and kaolin and killed 48 hr later. Hepatic microsomes were isolated, and Western blot analysis was performed on the microsomes. A, P-450 2C11 protein expression was assayed by probing with a P-450 2C11 antibody. P-450 2C11 protein expression from three animals from each group are shown. B, Densitometric analysis of Western blots probed for P-450 2C11, 2E1 and 3A2 protein levels (n = 5). Also presented on the graph is the total hepatic P-450 content (see Materials and Methods). Values for irritant-treated groups are expressed as a percentage of the untreated control group mean. C, Western blot was probed using a P-450 4A1 polyclonal antibody. Top band, P-450 4A3; bottom band, P-450 4A1/2. D, Densitometric analysis of the Western blot in figure 2C probed for the P-450 4A subfamily. *Significantly different from control, P < .05.
Despite these large declines in P-450 2C11 protein, the most abundant hepatic isozyme expressed in the rat, total P-450 content was reduced to a lesser extent. Both SiO2 and kaolin administration decreased total hepatic P-450 content, as measured by the difference spectrum of the reduced protein, to 77% of control. The largest decline in total hepatic P-450 content (70% of control) was seen in animals treated with BaSO4 (fig. 2B). Levels of P-450 3A2 and 2E1 protein in the microsomes were not significantly different from those of control animals.
We previously found that the administration of LPS to Fischer 344 rats results in an increase in P-450 4A3 protein expression and a decrease in P-450 4A1/2 protein levels (Sewer et al., 1996). These changes in P-450 4A protein expression were not consistent with the large increases in the mRNA expression of the P-450 4A subfamily members. Treatment of Fischer 344 rats with the three irritants resulted in no significant change in P-450 4A1/2 and 4A3 protein levels (fig. 2D). The polyclonal antibody to P-450 4A1 used to probe this Western blot recognized two protein bands. Based on the data of Okitaet al. (1993) and of Sundseth and Waxman (1992), we infer that the top (slower moving) band corresponds to P-450 4A3 and the bottom band is P-450s 4A1 and 4A2, which we have been unable to resolve.
Induction of P-450 2E1 and 4A subfamily mRNAs after irritant treatment in the kidneys of Fischer 344 rats.
Northern blot analysis of renal cortex RNA isolated from Fischer 344 rats treated with BaSO4, kaolin and SiO2 suggested an induction of renal P-450 2E1 mRNA expression (fig. 3A). Densitometric analysis of slot blots of the same samples revealed 4.0-, 3.1- and 1.9-fold increases in P-450 2E1 in kidneys of rats treated with BaSO4, SiO2 and kaolin, respectively (fig.3A). SiO2, BaSO4 and kaolin treatment also caused increases in P-450 4A2 mRNA of 8.0-, 5.4- and 3.3-fold and in P-450 4A3 mRNA of 1.9-, 3.0- and 2.0-fold, respectively (fig. 3A).

Induction of P-450 2E1 and 4A subfamily mRNAs after irritant treatment in the kidneys of Fischer 344 rats. Rats were administered the irritants and killed 48 hr later. Total RNA was isolated from the kidney cortex as described in Materials and Methods and subjected to Northern blot analysis. A, Representative Northern blot probed with oligonucleotides for P-450 4A2 and 4A3 and a cDNA for 2E1. The numerical data presented under the Northern blots are taken from slot blots of the same samples (n = 5 animals per group). Numerical values for the individual P-450 mRNAs were normalized to the poly(A)+ content of the samples. B, Representative Western blot of P-450 2E1 protein expression assayed by probing with anti-P-450 2E1 antibody. Densitometric analysis of the Western blot probed for P-450 2E1 protein expression is shown under the blot (n = 5). *Significantly different from control, P < .05.
P-450 2E1 protein levels increased by 2.1- and 1.7-fold in kidney microsomes isolated from rats treated with SiO2 and kaolin, respectively (fig. 3B), but there was no significant effect of BaSO4. No significant effect was detected in 4A1/2 or 4A3 protein levels in kidney microsomes isolated from rats treated with the irritants.
Dose response of P-450 hepatic and renal mRNAs after BaSO4 and SiO2 treatment.
Dose-response studies were carried out to determine whether the effects of the irritants that we used were maximal and could be reproduced at lower doses. BaSO4 and SiO2 were chosen for dose-response studies on the basis of the magnitude of the effects seen on both hepatic and renal P-450 expression. This time, rats were killed 24 hr after injection for RNA and microsome preparation to determine whether differences between the effects of the irritants and LPS in the previous experiments might be due to the different treatment times. As shown in figure 4A, the suppressive effects of BaSO4 on P-450 2C11 mRNA could be achieved at doses 5-fold lower than the 5 g/kg dose used in the above-mentioned studies. BaSO4 administration suppressed P-450 2C11 mRNA to 47% of control at 0.3 g/kg and to 12% of control at 3 g/kg. P-450 4A1 expression was induced by 2.3-fold at 0.3 g/kg and by 2.6-fold at 3 g/kg. In the kidney, P-450 2E1, 4A2 and 4A3 mRNA expressions increased (fig. 4B). P-450 2E1 increased by 3.3-fold and P-450 4A3 increased by 2.9-fold at 3 g/kg. At 3 g/kg, P-450 4A2 was induced by 1.6-fold relative to control levels.

Dose response of hepatic and renal mRNAs after BaSO4 treatment. Rats were administered the indicated doses of BaSO4 and killed 24 hr later. Total RNA was isolated as described in Materials and Methods. A, Densitometric analysis of hepatic RNA slot blots probed for P-450 2C11 and 4A1 mRNA expression. B, Densitometric analysis of renal P-450 2E1, 4A2 and 4A3 mRNA expression. Values for the individual P-450 mRNAs were normalized to the poly(A)+ content of the samples (n= 5). *Significantly different from control, P < .05.
SiO2 administration resulted in a dose-dependent decrease of P-450 2C11 mRNA expression in the range of 100 to 400 mg/kg (fig.5A). Induction of hepatic P-450 4A1 expression was also dose dependent. Significant increases were seen at the 100 mg/kg dose and higher. At the 400 mg/kg dose, P-450 4A1 expression increased to only 2.3-fold of control, possibly reflecting adverse effects of this dose on the animals. None of the doses of SiO2 tested produced a statistically significant induction of renal P-450 2E1, 4A2 or 4A3 mRNAs, although there was a tendency toward an increase in P-450 2E1 mRNA. The induction of P-450 4A mRNA expression seen after 48 hr of SiO2 treatment (fig. 3A) contrasts with the lack of effect seen in the 24-hr dose-response studies presented here and presumably reflects a delayed response to this irritant. No effect on hepatic P-450 2E1 or 3A2 mRNAs was detected in either dose-response experiment.

Dose response of hepatic and renal P-450 mRNAs after SiO2 treatment. Rats were injected with various doses of SiO2 and killed 24 hr later. Total RNA was isolated and subjected to slot blot analysis. A, Densitometric analysis of hepatic P-450 2C11 and 4A1 mRNA expression. B, Densitometric analysis of renal P-450 2E1, 4A2 and 4A3 mRNA expression, normalized as described in the legend to figure 1. *Significantly different from control, P < .05.
Induction of P-450 2E1 and 4A subfamily mRNAs in the kidneys of LPS-treated rats.
Our previous work demonstrated an induction of the P-450 4A subfamily in the livers of LPS-treated Fischer 344 rats (Sewer et al., 1996), but renal expression was not tested in that study. Densitometric analysis of slot blots of RNA isolated from the kidneys of LPS-treated rats revealed an induction of P-450 4A2 and 4A3 mRNAs similar to that seen in irritant-treated animals (fig.6), with increases of 1.8- and 1.7-fold in P-450 4A2 and 4A3 mRNA expression; respectively. Renal P-450 2E1 mRNA expression was also increased by 2.0-fold after LPS treatment (fig. 6).

LPS-mediated induction of P-450 2E1, 4A2 and 4A3 in the kidneys of Fischer 344 rats. Rats were injected with LPS and killed after 24 hr. After isolation of total RNA, Northern and slot blot analyses were carried out. P-450 2E1, 4A2 and 4A3 mRNA expression was assayed as in the legend to figure 3. A, Northern blot probed for P-450 2E1, 4A2 and 4A3 and glyceraldehyde-3-phosphate dehydrogenase mRNA expression is presented. The numerical data presented under the Northern blots represent densitometric analysis of slot blots probed for the respective mRNAs, as described in the legend to figure 1(n = 5). *Significantly different from control, P < .05.
Catalytic activities of CYP4A and CYP2E1 proteins in liver and kidney microsomes isolated from rats treated with irritants.
Lauric acid ω-hydroxylase and chlorzoxazone-6-hydroxylation activities of the microsomes prepared 48 hr after SiO2, BaSO4 and kaolin injections were assayed to test whether changes in levels of P-450 4A and P-450 2E1 mRNAs resulted in changes in catalytic activities associated with these enzymes. As shown in table 1, lauric acid ω-hydroxylase activity increased by 1.7-fold in liver microsomes isolated from rats treated for 48 hr with SiO2. ω-1-Hydroxylase activities were increased in hepatic microsomes isolated from rats administered all three of the irritants tested. No significant changes were observed in either lauric acid ω- or ω-1-hydroxylase activities in microsomes isolated from the kidneys of these animals.
Microsomal lauric acid hydroxylase activities
Chlorzoxazone-6-hydroxylase activity, which is associated with P-450 2E1 (Yamazaki et al., 1995), increased in the kidneys of SiO2-, BaSO4- and kaolin-treated rats by 1.5-, 1.5- and 1.9-fold, respectively (table 2). This increase in chlorzoxazone-6-hydroxylation in the kidney corresponds with the increases in P-450 2E1 mRNA and protein expression.
Renal chlorzoxazone 6-hydroxylase activity
Induction of acute-phase protein mRNAs after irritant treatment and comparison of iNOS mRNA levels in animals treated with the irritantsvs. animals administered LPS.
Increases in the mRNA levels of fibrinogen was detected in the livers of rats administered all three irritants. Fibrinogen mRNA expression increased significantly in the livers of rats treated with the three irritants. We also detected an increase in renal fibrinogen mRNA in rats administered the irritants (fig. 7). No significant increase in AGP mRNA was detected in the 48-hr experiment; however, in both the SiO2 and BaSO4 dose-response studies, significant increases in AGP mRNA were found. AGP mRNA increased by 11-fold after 24-hr treatment with 3 g/kg BaSO4 (data not shown). A significant dose-dependent induction of AGP mRNA expression was also found in animals treated for 24 hr with doses of SiO2 ranging from 100 to 400 mg/kg (data not shown). LPS treatment has been shown to result in the induction of hepatic iNOS mRNA both in vivo and in vitro (Billiar et al., 1992; Geller et al., 1994). Figure8 shows a Northern blot probed with a labeled iNOS cDNA probe. As illustrated, hepatic iNOS expression is induced in animals treated with LPS for 24 hr but not in rats after 48 hr of SiO2, BaSO4 or kaolin treatment. An induction of iNOS mRNA could not be detected in rats administered SiO2 or BaSO4 in the 24-hr dose-response experiments, and no elevation in serum nitrate plus nitrite was detected in the sera of any of the groups treated with irritants (data not shown).

Acute-phase protein mRNA expression in Fischer 344 rats treated with the irritants. Rats were administered the three irritants and killed as in the legend to figure 1. Total RNA was electrophoresed and blotted onto nylon membranes as described in Materials and Methods. Slot blots were probed with an oligonucleotide to AGP and a cDNA to fibrinogen mRNA. The graph depicted represents the mean ± S.E.M. of five animals per treatment group. Values for the individual acute-phase mRNAs were normalized to the rRNA signals on the blots. *Significantly different from control, P < .05.
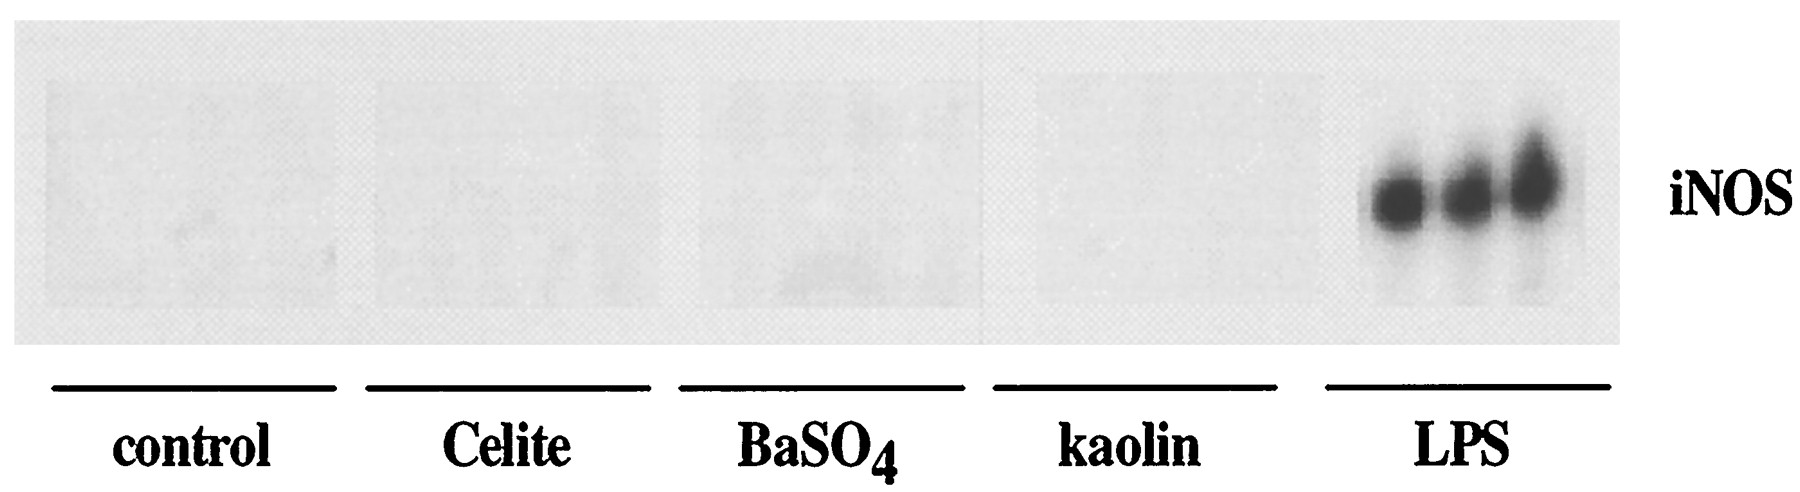
Comparison of iNOS mRNA expression in the livers of Fischer 344 rats treated with LPS and the irritants. Rats were administered LPS, SiO2, BaSO4 or kaolin and killed 24 hr later. Total RNA was isolated and subjected to Northern blot analysis as described in Materials and Methods. A radiolabeled cDNA to iNOS was used to detect iNOS mRNA expression.
Discussion
This study shows that several irritants that evoke a systemic inflammatory response initiated at extrahepatic sites down-regulate the hepatic mRNA and protein expression of P-450 2C11. This is similar to the response caused by bacterial endotoxin (Morgan, 1989). However, in contrast to our previous findings with LPS, the irritants tested did not affect hepatic P-450 3A2 or 2E1 expression. An induction was shown in the mRNA levels of the members of the P-450 4A subfamily after irritant administration; thus, the effects of LPS previously shown on the P-450 4A subfamily are not unique to LPS. We have also demonstrated for the first time an induction of both P-450 2E1 and P-450 4A subfamily mRNAs in the kidneys of Fischer 344 rats after administration of LPS and the various irritants.
The difference between the LPS and irritant models in the expression of P-450 2E1 and 3A2 is unlikely to be simply due to different time courses because the mRNAs for these enzymes were unaffected by SiO2 or BaSO4 at either 24 or 48 hr after treatment. Thus, we infer that different inflammatory agents affect the expression of individual P-450 isozymes differentially. It can be speculated that some P-450s (e.g., P-450 2C11) may be more sensitive than others to changes in the levels of circulating cytokines. This may be particularly important due to the high concentrations of cytokines that occur in the liver on LPS injection (Billiar et al., 1992) compared with those with a remote localized irritation. In addition, there may be direct effects of LPS injected in vivo on the expression of certain P-450s in the hepatocyte. Indeed, we observed that LPS down-regulates P-450 2C11 in cultured hepatocytes.2 These differences in the environment of the hepatocyte after the injection of LPS or irritants are thought to be responsible for the fact that LPS, but not irritants, induces hepatic iNOS (Geller et al., 1994; the present study).
Although the intraperitoneal injection of the irritants we used in the present study is thought to initiate a hepatic inflammatory response by causing sterile peritonitis (Arrhenius and Hutlin, 1962; Ufkes et al., 1988), it is possible that a portion of the irritants could be absorbed into the blood and be phagocytosed by Kupffer cells.Peterson and Renton (1986) demonstrated that latex beads administered intravenously to mice cause a decrease in P-450 content due to phagocytosis of the beads by Kupffer cells; the presence of Kupffer cells was necessary for the depression of P-450 content by latex particles in hepatocyte cultures. Whether the reticuloendothelial system participates in the hepatic response to the intraperitoneally administered irritants that we describe here is not known, but the absence of iNOS induction suggests that the response is similar to that caused by turpentine, which is a classic model of remote localized inflammation (Geller et al., 1994).
The induction of hepatic P-450 4A1 mRNA by all of the irritants tested conforms with our findings of induced P-450 4A1, 4A2 and 4A3 mRNAs in the livers of rats administered LPS. As shown in figure 1, P-450 4A1 mRNA levels are increased substantially by all three of the irritants tested. Hepatic expression of the other two P-450 4A subfamily members is substantially lower. It is possible that the responses of the different 4A subfamily members may have different time courses. The SiO2 and BaSO4 dose-response studies, which were carried out for a 24-hr treatment period, revealed larger increases in P-450 4A2 and 4A3 in the livers of rats treated with the two irritants. Subsequent studies with these irritants (data not shown) have shown that the magnitudes of the increases in the P-450 4A subfamily, although significant, are variable.
In our studies showing induction of P-450 4A subfamily mRNA in LPS-treated rats (Sewer et al., 1996), we saw conflicting changes in P-450 4A protein and the associated ω-hydroxylase activities. These inconsistencies in the changes in the levels of P-450 4A mRNA and protein were also observed in the current study. Despite the induction in P-450 4A1 mRNA expression, the protein levels of P-450 4A1/2 were significantly decreased (fig. 2). As we suggested previously for LPS, it is possible that these irritants also activate mechanisms for decreased protein translation or increased protein turnover. Another possible explanation for this inconsistency could be our inability to resolve the 4A1 and 4A2 bands on the Western blot. An induction of P-450 4A1 could, for example, be masked by a decrease in P-450 4A2.
Irritant administration results in the induction of the hepatic acute-phase proteins. LPS treatment has been previously shown to induce both fibrinogen and AGP expression (Birch and Schreiber, 1986). Fibrinogen is a type 2 protein, which is stimulated by IL-6, whereas AGP, a type 1 protein, is induced by both IL-1 and IL-6 (Baumann and Gauldie, 1990). As shown in figure 7, an induction of β-fibrinogen expression was also detected in the kidneys of animals treated with the irritants, a phenomenon that has not been reported previously. Further studies must determine whether all of the chains of the fibrinogen protein are present in the kidney and are also induced. The induction of the hepatic acute-phase protein expression confirms that our irritant treatments did result in an inflammatory response. However, the effects of LPS and the irritants on the expression levels of individual P-450s (as well as of iNOS) are different.
Several in vivo (Khatsenko et al., 1993) andin vitro (Carlson and Billings, 1996; Stadler et al., 1994) studies have postulated a role for NO in the cytokine and LPS-evoked down-regulation of several P-450 isozymes. In contrast,Hodgson and Renton (1995) demonstrated that treatment of mice with NOS inhibitors could not protect against the interferon inducer-evoked down-regulation of total P-450 content. Our present findings illustrate that different types of inflammatory stimuli (LPS vs.irritants) affect P-450 expression differentially, and the lack of hepatic iNOS induction by irritants in our study demonstrates that the expression of some P-450 isozymes (e.g., P-450 2C11 and 4A) can be affected by inflammatory stimuli in the absence of iNOS induction and NO production. Conversely, the fact that we observed suppression of P-450 2E1 and 3A2 by LPS (Sewer et al., 1996) and not by the irritants raises the possibility of a role for NO in the LPS-mediated down-regulation of these two isozymes.
To our knowledge, the effects of irritants or LPS treatment of rats on renal expression of P-450s has not been described before. We found that mRNAs for P-450 2E1, 4A2 and 4A3 are all elevated in the kidneys of rats treated with either LPS or the irritants. P-450 2E1 protein and activity levels also increased in rats treated with all three irritants. The mechanism underlying increased renal P-450 2E1 mRNA and protein expression and increased chlorzoxazone-6-hydroxylation is unclear at the present time, as is its physiological significance. P-450 2E1 mRNA levels have been shown to be increased in the kidneys after ethanol administration (Zerilli et al., 1995), in high-fat diets (Yun et al., 1992) and during partial hepatectomy (Babany et al., 1985; Solangi et al., 1988). Whether these phenomena share a common mechanism for P-450 2E1 induction with that of the irritants and LPS remains to be seen. Careful studies in which the changes in P-450 2E1 mRNA, protein and activity are examined over time are required to elucidate possible modes of action.
We speculated previously that the induction of P-450 4A activities in the liver by LPS might have consequences for regulation of blood pressure, based on the abilities of these enzymes to 20-hydroxylate arachidonic acid (Sewer et al., 1996). The administration of clofibrate to Sprague-Dawley rats results in a ∼2-fold increase in P-450 4A2 mRNA and a ∼10-fold increase in P-450 4A3 mRNA in the kidney (estimated from the qualitative data of Kimura et. al., 1989). Thus, the magnitudes of the induction seen in this study using the irritants are similar to the level of induction achieved after administration of a model inducer of the P-450 4A subfamily. An increase in the renal production of such metabolites would be expected to have even greater consequence for regulation of blood pressure, but no increased activity of 4A proteins was detected in the present study. It will be important to determine whether the increases in renal P-450 4A mRNAs seen in the present study result in increases in activities associated with these enzymes at time points later than 48 hr.
Hypolipidemic agents and fatty acids regulate the P-450 4A subfamilyvia activation of PPAR, a member of the steroid hormone receptor superfamily (Muerhoff, et al., 1992). One might speculate that the irritants and LPS may be stimulating the production of an endogenous ligand of the PPAR. Prostaglandins are abundant inflammatory mediators, and it has been shown that shown that 15-deoxy-Δ12,14-prostaglandin J2 is a ligand for the PPAR γ isoform (Forman et al., 1995). Other studies have demonstrated differential activation of the three PPAR subtypes (α, δ and γ) by prostaglandins A, D and J (Yu et al., 1995). This group also found that 8-hydroxyeicosatetraenoic acid was the most effective in inducing the PPAR α isoform, which is most abundantly expressed in the liver. It is possible that irritant and/or LPS administration results in increased ω-hydroxylation of arachidonate and the formation of naturally occurring activators of the PPAR.
The present work illustrates commonalties in the effects of LPS (a model of bacterial infection and septicemia) and a localized inflammation on the hepatic and renal expression of P-450s 4A and 2C11. However, it also shows differences in the effects of these agents on the hepatic expression of other P-450 enzymes (2E1 and 3A2). These results illustrate possible differences in the mechanisms by which irritants administered at sites remote from the liver and LPS may exert their changes in the drug-metabolizing capacity of P-450 isozymes and suggest that inflammation or infection may have different consequences for drug metabolism in the clinical situation.
Acknowledgments
We thank Qi Chen and Karen Hausman for excellent technical assistance.
Footnotes
-
Send reprint requests to: Dr. Edward T. Morgan, Department of Pharmacology, Emory University School of Medicine, 5119 Rollins Research Center, Atlanta, GA 30322-3090. E-mail:etmorga{at}bimcore.emory.edu
-
↵1 This work was supported by National Institute of General Medical Sciences Grants GM46897 and GM/OD53093 (E.T.M.), National Institute on Alcohol Abuse and Alcoholism Grant AA08608 (D.R.K.) and a Howard Hughes Predoctoral Fellowship (M.B.S.). This work was presented in part at the American Society for Biochemistry and Molecular Biology Conference in May 1995 (San Francisco, CA).
-
↵2 M. B. Sewer and E. T. Morgan, unpublished observations.
- Abbreviations:
- LPS
- lipopolysaccharide
- iNOS
- inducible nitric oxide synthase
- IL
- interleukin
- TNF-α
- tumor necrosis factor-α
- IFN-γ
- interferon-γ
- AGP
- α1-acid glycoprotein
- PPAR
- peroxisome proliferator activated receptor
- NO
- nitric oxide
- Received August 12, 1996.
- Accepted November 25, 1996.
- The American Society for Pharmacology and Experimental Therapeutics


