


Abstract
To evaluate the degree of drug-drug interaction concerning metabolic inhibition in the liver quantitatively, we tried to predict the plasma concentration increasing ratio (R) of midazolam (MDZ) by erythromycin (EM), diltiazem (DLZ), or verapamil (VER) in rats. MDZ was administered through the portal vein at the steady state of plasma concentration of these inhibitors. The R values in the area under the plasma concentration curve of MDZ in the presence of EM, DLZ, and VER were 2.02, 1.64, and 1.30, respectively. The liver to plasma unbound concentration ratios of EM, DLZ, and VER at the steady state after infusion were 20.8, 1.02, and 3.01, respectively, suggesting concentrative uptake of EM and VER into the liver. The predicted R value in the presence of EM calculated by use of plasma unbound concentration was 1.03, whereas the value calculated with liver unbound concentration was 1.61, which was very close to the observed value. These findings indicated the need to consider the concentrative uptake of inhibitors into the liver for the quantitative prediction of metabolic inhibition. However, the predicted values in the presence of DLZ or VER calculated by use of liver unbound concentration were still underestimated. This result may be due to the metabolic inhibition by the metabolites of both inhibitors. Therefore, when predicting the degree of metabolic inhibition quantitatively, the inhibitory effect by coadministered drugs and the disposition of these metabolites in the liver must also be considered.
The metabolic inhibition of one drug by another in the liver is one of the most important events among pharmacokinetic drug-drug interactions. Such interactions may induce adverse effects by elevating the plasma concentration of the interacted drugs. In clinical cases, azole antifungal agents, macrolide antibiotics, and histamine H2-receptor antagonists are well known inhibitors of the oxidative metabolism of various drugs in the liver (Fee et al., 1987; Olkkola et al., 1993, 1994, 1996; Backman et al., 1994;Ahonen et al., 1995; Baldwin et al., 1995). Most of the enzymes concerning drug-drug interactions are cytochrome P450 (CYP). Isoforms of metabolic enzymes can be identified with anti-CYP antibodies or specific inhibitors of CYP (Ghosal et al., 1996), which make it possible to predict potential drug-drug interactions qualitatively. Moreover, the degree of interactions can be quantitatively estimated to some extent by the following equation; R = 1 +I/Ki, where I is the concentration of inhibitor and Kiis the inhibition constant. However, it still remains difficult to predict the increasing ratio (R) of plasma concentrations of the interacted drug precisely. The following points must be taken into account: 1) disposition of inhibitors in the liver, 2) concentrations of inhibitors in the portal vein or hepatic vein, 3) inhibition of metabolism in the gastrointestinal tract, and 4) drug-drug interaction in the absorption process (Sawada et al., 1996; Ito et al., 1998). On point 2, because the drug concentration in the portal vein is higher than that in the systemic circulation after oral administration (Hoffman et al., 1995; Tabata et al., 1995), it is necessary to estimate the concentrations of inhibitors in the portal vein after oral administration from the absorption constant in the gastrointestinal tract. On points 3 and 4, because it was reported in clinical studies that CYP3A substrates such as tacrolimus and cyclosporin are metabolized and secreted by P-glycoprotein in the intestine (Gomez et al., 1995; Floren et al., 1997; Lown et al., 1997), it is also necessary to take into account the drug-drug interaction in the intestine for these drugs. In this study, we focused on point 1 and tried to predict the increase in plasma concentration in rats. To exclude points 2, 3, and 4, inhibitors and the interacted drug were administered i.v. and intraportally, respectively. The hypnotic midazolam (MDZ), as an interacted drug, and erythromycin (EM), diltiazem (DLZ), and verapamil (VER), as inhibitors, were used in this study. Recently, we reported the quantitative prediction of R values of MDZ with concomitant administration of histamine H2-receptor antagonists (cimetidine and nizatidine) or azole antifungal agents [itraconazole (ITZ) and ketoconazole (KTZ)] by using the same procedure (Takedomi et al., 1998; Yamano et al., 1999).
Experimental Procedures
Materials
EM was a gift from Dainippon Pharmaceutical Co. (Osaka, Japan). MDZ was purchased as MDZ injection (Dormicam Inj.) from Yamanouchi Pharmaceutical Co. (Tokyo, Japan). DLZ hydrochloride, VER hydrochloride, and troleandomycin were purchased from Wako Pure Pharmaceutical Co. (Osaka, Japan). All other chemicals used as reagents were of reagent grade and reagents for HPLC.
Animals
Sprague-Dawley male rats (7 weeks) weighing 220 to 250 g were purchased from Nippon Bio-Supp Center (Tokyo, Japan). The rats were allowed access to water and food pellets ad libitum.
In Vivo Studies
Preparation of Drug Solutions.
DLZ hydrochloride and VER hydrochloride were dissolved in saline. EM was dissolved in 0.04 M phosphate buffer (pH 5) for i.v. injection and was suspended in corn oil for i.p. injection. Troleandomycin was suspended in corn oil. MDZ injection (Dormicam Inj., 10 mg/2 ml) was used for intraportal administration.
Plasma and Liver Concentration Profiles of EM, DLZ, and VER.
The loading dose and subsequent maintenance dose were calculated by the pharmacokinetic parameters of EM, DLZ, and VER obtained in a preliminary study. Briefly, EM, DLZ, or VER was administered through the femoral vein to rats by bolus injection at doses of 50, 5, or 5 mg/kg, respectively. The blood was collected from the femoral artery at 2, 5, 10, 15, 30, 60, 90, 120, and 180 min after administration.
In the infusion study, EM, DLZ, or VER was administered through the femoral vein at a bolus dose of 32.3, 5.1, or 3.2 mg/kg and infused at a constant rate of 4.9, 1.0, or 0.69 mg/h/body using a syringe infusion pump (Terufusion, STC-525; Terumo Co., Tokyo, Japan) for 6 h, respectively. The blood was collected at 0.25, 0.5, 1, 2, 3, 4, 5, and 6 h after the start of infusion. At 6 h, the liver was removed.
To investigate the concentration dependence of liver-to-plasma concentration ratio (KpH), EM, DLZ, or VER was administered through the femoral vein at a bolus dose of 50, 5, or 5 mg/kg, respectively. At 0.5, 1, 2, and 3 h after administration of each drug, the blood was collected from the abdominal aorta, and the liver was removed. The blood was centrifuged at 12,000 rpm for 2 min to obtain the plasma. Plasma and liver were stored at −20°C until analysis.
Effect of EM, DLZ, and VER on Plasma Concentration Profiles of MDZ.
To investigate the effect of EM, DLZ, and VER on the plasma concentration profiles of MDZ, MDZ was administered through the portal vein at the steady state of EM, DLZ, or VER. Rats were cannulated in the femoral vein, artery, and portal vein under light ether anesthesia. After recovery from anesthesia, EM, DLZ, or VER was administered through the femoral vein at a bolus dose of 32.3, 5.1, or 3.2 mg/kg and infused at a constant rate of 4.9, 1.0, or 0.69 mg/h/body, respectively. At 120 min after the beginning of infusion of each drug, MDZ was administrated through the portal vein at a dose of 10 mg/kg. The blood was collected at 2, 5, 10, 15, 30, 60, 90, 120, and 180 min after administration of MDZ and then centrifuged at 12,000 rpm for 2 min to obtain the plasma. At 180 min, the liver was removed. The plasma and liver were stored at −20°C until analysis.
In Vitro Studies
Unbound Fractions of EM, DLZ, and VER in Plasma and Liver Tissue.
The plasma protein binding of EM, DLZ, and VER was evaluated by the equilibrium dialysis method. Dialysis was performed with an apparatus made of clear acrylic resin and consisting of two 1.5-ml chambers separated by a cellulose dialysis membrane (SC-101-M10H; DIACHEMA, Zurich, Switzerland). EM, DLZ, or VER was added to rat plasma at a concentrations of 5 and 20 μg/ml and applied to one chamber, and isotonic phosphate buffer (pH 7.4) was applied to the other chamber. After incubation at 37°C for 6 h, 0.1 ml of sample was collected from both chambers for assay.
For determination of the liver tissue binding of EM, DLZ, and VER, liver tissues were homogenized with 0.1 M phosphate buffer (pH 7.4) to prepare 10, 20, and 30% tissue homogenates. Tissue homogenates were dialyzed two times with 100 volumes of 0.1 M phosphate buffer (pH 7.4) for 12 h to remove coenzymes. EM, DLZ, or VER was mixed with the tissue homogenates at concentrations of 2, 10, or 50 μg/ml, respectively. The mixture and isotonic phosphate buffer (pH 7.4) were added to the dialysis chamber and incubated at 25°C for 6 h. After the incubation, 0.5 ml of sample was collected from both sides for assay.
The liver tissue unbound fraction (fH) was calculated according to the following equation:
Inhibitory Effect of EM, DLZ, and VER on the Metabolism of MDZ in Rat Hepatic Microsomes.
Rat hepatic microsomes were prepared by the method of Kremers et al. (1981). From the preliminary experiment, we confirmed that substrate depletion increased proportionally up to 5 min and in the range of 0.2 to 2 mg/ml of protein concentration on the condition of metabolic inhibition experiment. The kinetic and inhibition studies for MDZ in rat liver microsomes were performed on the incubation condition described as follows; 0.32 ml of incubation mixture containing rat liver microsome (final protein concentration, 0.4 mg/ml) and an NADPH regenerating system (100 mM phosphate buffer, pH 7.4, 2 mM NADP, 10 mM glucose 6-phosphate, 1 U glucose 6-phosphate dehydrogenase, 0.1 mM EDTA, 5 mM MgCl2) were preincubated at 37°C for 2 min. The reactions were initiated by adding 0.04 ml of inhibitor solutions (EM, DLZ, VER) and 0.04 ml of MDZ solution. The concentrations of MDZ were 1, 2, 5, 10, and 20 μM. The concentrations of inhibitors were as follows: EM, 100, 200, and 500 μM; DLZ, 20, 50, 100, and 200 μM; VER, 20, 50, and 100 μM. After incubation at 37°C for 5 min, the enzyme reactions were terminated by adding 0.4 ml of cold acetonitrile, and the reaction mixture was centrifuged at 3000 rpm for 2 min. To determine the concentration of MDZ, 0.4 ml of the supernatant was removed. The reaction velocity was estimated from the decrease in MDZ. The following equation was fitted to the observed data with the nonlinear iterative least-squares method (Yamaoka et al., 1981) to estimate kinetic parameters for the metabolism of MDZ and inhibition by EM, DLZ, and VER in rat liver microsomes.
EM is metabolized by CYP3A and produces a CYP Fe(II)-metabolic intermediate (MI) complex, which is a metabolically inactive CYP species. Lindstrom et al. (1993) reported that, when troleandmycin (TAO), which leads to mechanism-based inhibition in a manner similar to EM, was incubated in rat hepatic microsome containing NADPH, it formed a time-dependent MI complex until 20 min. Preincubation of TAO in human hepatic microsome increased the inhibitory potency for testosterone 6β-hydroxylation (Yamazaki H., et al., 1996). Accordingly, the inhibitory effect of EM for the in vitro metabolism of MDZ was investigated as follows: 0.04 ml of EM solution was added to 0.32 ml of incubation mixture containing rat liver microsome (final protein concentration, 0.4 mg/ml) and an NADPH regenerating system and then was incubated at 37°C for 20 min. The concentrations of EM were 100, 200, and 500 μM. The reactions were initiated by adding 0.04 ml of MDZ solution, and the reaction velocity of MDZ was estimated as described above. The observed data were fitted to eq. 2 use of the nonlinear iterative least-squares method to estimate kinetic parameters for the metabolism of MDZ and inhibition by EM in rat liver microsomes.
The determination of the unbound fractions of EM, DLZ, and VER in the microsomal protein was evaluated by the equilibrium dialysis method. EM, DLZ, or VER was mixed with the reaction solution without NADP at a concentration of 50 or 200 μM and applied to one chamber, and 0.1 M phosphate buffer (pH 7.4) was applied to the other chamber. After incubation at 37°C for 6 h, 0.1 ml of sample was collected from both chambers to determine the concentration.
In Vivo Formation of MI Complexes of EM, DLZ, and VER in Rat Hepatic Microsomes
The in vivo formation of MI complexes of EM, DLZ, and VER in rat hepatic microsomes was investigated as follows. Rats were cannulated in the femoral vein, artery, and portal vein under light ether anesthesia as the effect study of EM, DLZ, and VER on the plasma concentration profiles of MDZ. After recovery from anesthesia, EM, DLZ, or VER was administrated through the femoral vein at a bolus dose of 32.3, 5.1, or 3.2 mg/kg and infused at a constant rate of 4.9, 1.0, or 0.69 mg/h/body to make the plasma concentration of each drug steady, respectively. At 2 and 5 h from the start of infusion, rats were euthanized by decapitation, and then the liver was removed. As the positive control, rats were treated with repeated doses (500 mg/kg for 3 days) of EM or TAO suspension in corn oil by i.p. injection and were sacrificed 24 h after the last administration. The rat hepatic microsomes were then prepared by the method of Kremers et al. (1981), and protein concentration was determined by the colorimetric method ofLowry et al. (1951).
Uncomplexed, complexed, and total CYP in rat hepatic microsomes were measured by the conventional method (Omura and Sato, 1964;Pessayre et al., 1983; Delaforge et al., 1984; Franklin, 1991). These techniques are based on the following properties of MI complexes. MI complexes cannot bind to carbon monoxide and thus show an absorbance maximum (Soret peak) at approximately 456 nm. Addition of potassium ferricyanide results in resolution of complexes and release of uncomplexed CYP.
The microsome suspensions (0.15 M KCl, 0.01 M phosphate buffer, pH 7.4) containing 2 mg/ml of protein were placed in reference and sample cuvettes. Potassium ferricyanide, 50 μM, was added to the contents of the reference cuvette to destroy the complex in this cuvette. MI complexes were approximately quantified from the absorbance difference between 456 and 490 nm relative to the baseline with an extinction coefficient of 64,000 M−1 cm−1. Then a small amount of sodium dithionite was added to the contents of the sample cuvette, and a wavelength scan between 370 and 500 nm was recorded until constant. Carbon monoxide was ventilated to the contents of the sample cuvette for 60 s. The uncomplexed CYP content was calculated from the gain in absorbance difference at 450 nm relative to 490 nm by addition of the carbon monoxide with an extinction coefficient of 91,000 M−1cm−1. A small amount of sodium dithionite was added to the contents of the reference cuvette, and then wavelength scans between 370 and 500 nm were recorded until constant. The reference cuvette was gassed with carbon monoxide for 60 s. The total CYP content was determined from the loss in absorbance difference at 450 nm relative to 490 nm by addition of the carbon monoxide with an extinction coefficient of 91,000 M−1 cm−1.
Measurement of the Concentrations of Various Drugs
For the determination of EM concentrations in the plasma and liver, 0.1 ml of plasma or 0.5 ml of 20% liver homogenate, 0.1 ml of 0.5 N NaOH, and 3 ml of tert-butylmethylether were mixed and shaken for 5 min, then centrifuged at 3000 rpm for 5 min. Two milliliters of the organic phase were transferred to another tube and evaporated under nitrogen gas. The residue was dissolved with 50 μl of the mobile phase, and 20 μl was injected into an HPLC. The chromatographic system consisted of a pump LC-10AD and an ECD-10A electron chemical detector (Shimadzu, Kyoto, Japan). The detector cell potential for the oxidation was 1000 mV. The column was a reversed-phase TSK gel 80TM ODS, 4.6 × 150 mm (Toso, Tokyo) and was maintained at 30°C. The mobile phases were acetonitrile/100 mM phosphate buffer (50:50 v/v, pH 6.4) and were pumped isocratically at a flow rate of 1 ml/min. The calibration curves were linear within the range of 0.2 to 50 μg/ml for both plasma and blood and 1 to 100 μg/g for liver (r = 0.999).
For the determination of DLZ and VER concentrations in the plasma and liver, 0.1 ml of plasma or 0.5 ml of 20% liver homogenate, 0.1 ml of methanol, 0.5 ml of 1 N NaOH, and 2.5 ml of isopropylether were mixed and shaken for 5 min, then centrifuged at 3000 rpm for 5 min. Two milliliters of the organic phase was transferred to another tube and evaporated under nitrogen gas. The residue was dissolved with 0.2 ml of the mobile phase, and 75 μl was injected into an HPLC. The chromatographic system consisted of an autosampler 717 (Waters, Tokyo), a pump LC-10AD, and an SPD-10A variable-wavelength UV detector (Shimadzu, Kyoto, Japan) operated at 229 and 237 nm for VER and DLZ, respectively. The column was a reversed-phase Inertosil ODS, 4.6 × 250 mm (GL Science, Osaka, Japan) and was maintained at 40°C. The mobile phases were acetonitrile/10 mM phosphate buffer (80:20 v/v, pH 6.5) for VER and acetonitrile/10 mM phosphate buffer (35:65 v/v, pH 3.0) for DLZ and were pumped isocratically at a flow rate of 1 ml/min. The calibration curves were linear within the range of 0.050 to 10 μg/ml for plasma and 0.5 to 50 μg/g for liver (r = 0.999). The concentrations of MDZ in plasma and liver were measured by the methods reported previously (Yamano et al., 1999).
In all measurements, coefficients of variation were less than 10%, and within-run accuracies were less than 10%. When the concentrations in the samples were below the limit of quantitation, levels were determined by increasing the amount of sample.
Analysis of Data
Determination of Kinetic Parameters.
Plasma concentration profiles were fitted to the following biexponential equation via the nonlinear least-squares method (Yamaoka et al., 1981).
Prediction of Increasing Ratio of Plasma Concentration of MDZ.
In the absence of inhibitors, metabolic velocities were expressed as eq. 7. Assuming that the interaction of drug metabolism is of a competitive inhibition type, metabolic velocities in the presence of inhibitors were expressed as eq. 2. Because the interaction of drug metabolism is of a noncompetitive inhibition type for a long period when the in vivo formation of MI complexes with inhibitors occurs, metabolic velocities were expressed as eq. 8. Reaction velocities at varying concentrations of the substrate MDZ were analyzed by nonlinear least-squares regression.
Statistical Analysis.
Statistical analysis was performed by Student's t test. Differences were regarded as statistically significant at P < .05.
Results
Plasma and Liver Concentration Profiles of EM, DLZ, and VER.
Figure 1 and Table1 show the plasma concentration profiles and the pharmacokinetic parameters of EM, DLZ, and VER after bolus injection of each drug. Figure 2 shows the plasma concentration profiles of EM, DLZ, and VER after i.v. infusion. At 2 h from the beginning of infusion of EM, DLZ, and VER, the plasma concentration of each drug became steady. Figure3 shows the concentration dependence of the KpH of EM, DLZ, and VER. The apparent KpH values of EM, DLZ, and VER were 25.71 ± 3.45, 4.22 ± 1.06, and 9.09 ± 1.77 (mean ± S.D.), respectively, and were substantially constant within the range studied.

Plasma concentration profiles of EM (A), DLZ (B), and VER (C) in the experiment of bolus injection of DLZ, VER, and EM. EM, DLZ, and VER were administered through the femoral vein at doses of 10, 5, and 5 mg/kg, respectively. Each point represents the mean ± S.D. (n = 4).
Pharmacokinetic parameters of EM, DLZ, and VER in rats

Plasma concentration profiles of EM (A), DLZ (B), and VER (C) in the experiment of bolus injection and constant infusion of each drug in rats. A, EM was administered at a bolus dose of 32.3 mg/kg and then infused at a constant rate of 4.9 mg/h/body. B, DLZ was administered at a bolus dose of 5.1 mg/kg and then infused at a constant rate of 1.0 mg/h/body. C, VER was administered at a bolus dose of 3.2 mg/kg and then infused at a constant rate of 0.69 mg/h/body. Each point represents the mean ± S.D. (n = 4).

Plasma concentration dependence of theKpH of EM (A), DLZ (B), and VER (C).
Plasma Protein and Liver Tissue Binding Assay of EM, DLZ, and VER.
The plasma unbound fractions of EM, DLZ, and VER were 0.78 ± 0.08, 0.16± 0.01, and 0.063 ± 0.007 (mean ± S.D., n = 3) (Table 2). The liver tissue unbound fractions of EM calculated from eq. 1 were 0.56 ± 0.02, 0.52 ± 0.03, and 0.53 ± 0.03 (mean ± S.D., n = 3) for 10, 20, and 30% homogenates of liver tissue, and those of DLZ were 0.040 ± 0.003, 0.044 ± 0.004, and 0.042 ± 0.004 (mean ± S.D., n = 3). The liver tissue unbound fractions of VER were 0.020 ± 0.002, 0.021 ± 0.003, and 0.019 ± 0.001 (mean ± S.D.,n = 3) for 10, 20, and 30% homogenates of liver tissue and were substantially constant within the above ranges.
Liver and plasma concentrations of EM, DLZ, and VER after infusion in rats
Table 2 also shows the mean concentrations in plasma and liver and theKpH of EM, DLZ, and VER at the steady state after infusion. KpH values of EM, DLZ, and VER were 29.7, 3.97, and 10.1, respectively. The liver unbound concentration to plasma unbound concentration ratios (CHf/Cpf) of EM and VER were more than 1, suggesting a concentrative uptake of both drugs into the liver.
Effect of EM, DLZ, and VER on Plasma Concentration Profiles of MDZ.
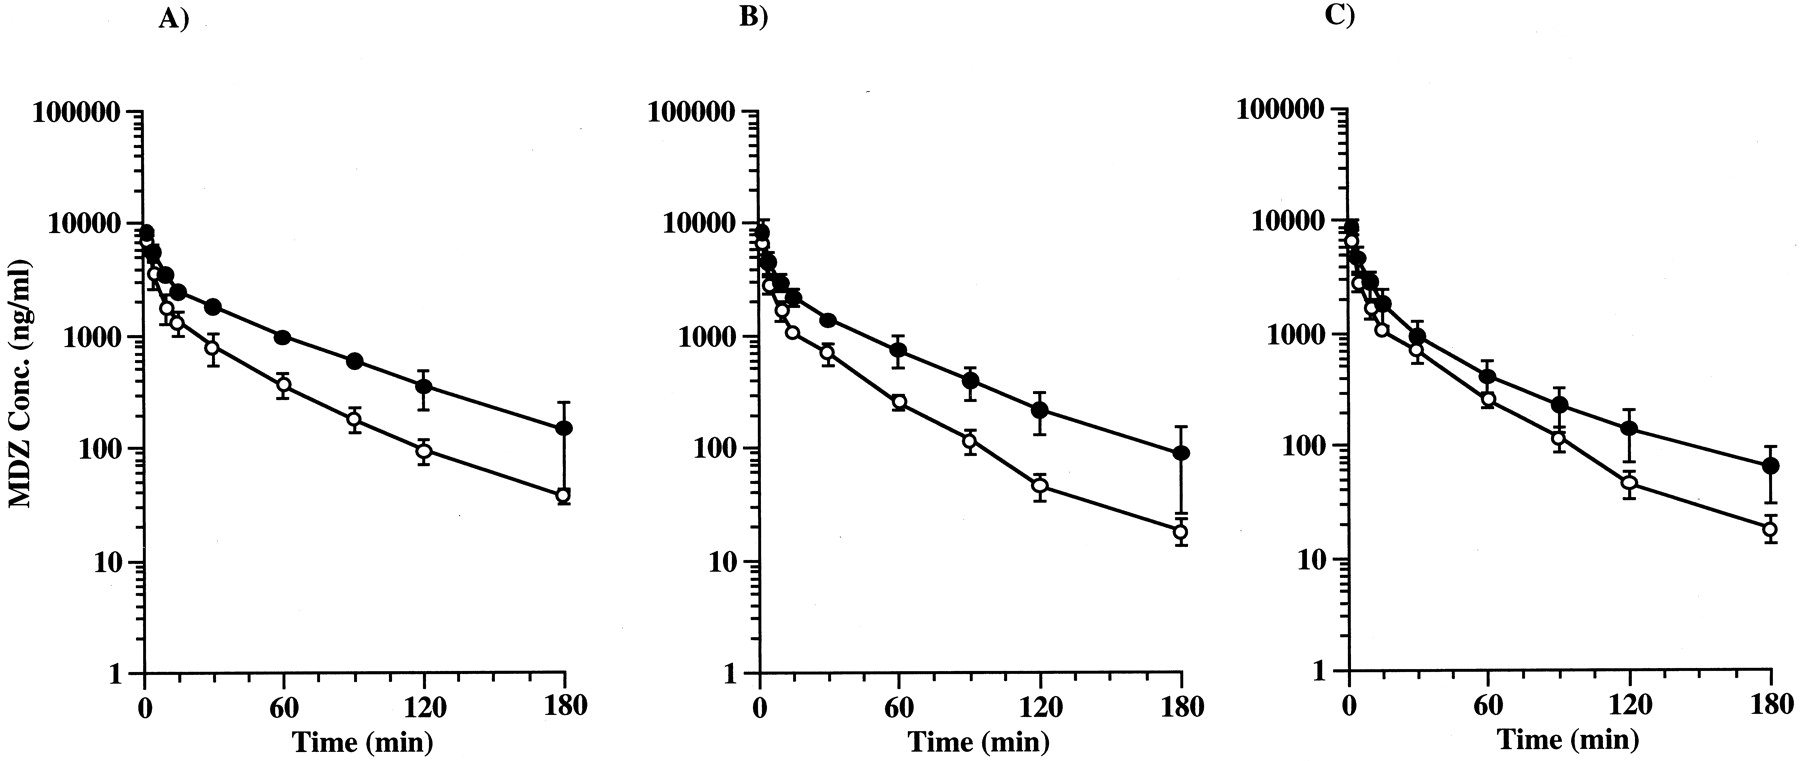
Figure 4 and Table3 show the plasma concentration profiles and pharmacokinetic parameters of MDZ after intraportal administration in the presence or absence of EM, DLZ, and VER. EM, DLZ, and VER increased the AUC of MDZ by 2.02-fold (P < .01), 1.64-fold (P < .01), and 1.30-fold (P< .05), respectively.

Effect of EM (A), DLZ (B), and VER (C) on plasma concentration of MDZ. MDZ was administered through the portal vein at a dose of 10 mg/kg at 120 min after the beginning of infusion of the inhibitors. Each point represents the mean ± S.D. (n = 4). ○, plasma concentration of MDZ only; ●, plasma concentration of MDZ in the presence of inhibitors. A, EM was administered at a bolus dose of 32.3 mg/kg and then infused at a constant rate of 4.9 mg/h/body. B, DLZ was administered at a bolus dose of 5.1 mg/kg and then infused at a constant rate of 1.0 mg/h/body. C, VER was administered at a bolus dose of 3.2 mg/kg and then infused at a constant rate of 0.69 mg/h/body.
Pharmacokinetic parameter of MDZ after intraportal injection in the absence (−) or the presence (+) of EM, DLZ, or VER
Inhibitory Effects of EM, DLZ, and VER on the Metabolism of MDZ in Rat Hepatic Microsomes.
Figure 5shows the inhibitory effect of EM, DLZ, and VER on the metabolism of MDZ in rat hepatic microsomes. The metabolism of MDZ was competitively inhibited by each of the inhibitors. Table4 shows the kinetic parameters for the metabolism of MDZ and inhibition by those inhibitors in rat hepatic microsomes. The average calculated values ofKm andVmax were 7.76 μM and 4.19 nmol mg−1 protein min−1, respectively. Ki values based on unbound concentration of inhibitors were 179, 11.7, and 10.6 μM for EM, DLZ, and VER, respectively. Kivalue with the preincubation of EM at 37°C for 20 min was 186 μM.

Inhibitory effects of EM (A), DLZ (B), and VER (C) on the metabolism of MDZ by rat liver microsomes based on a Lineweaver-Burk plot. The initial concentrations of MDZ in inhibition of metabolism were 1, 2, 5, 10, and 20 μM, and the concentrations of inhibitors were 200, 500, and 1000 μM EM; 20, 50, 100, and 200 μM DLZ; and 20, 50, and 100 μM VER. A: ○, only MDZ; ●, with 200 μM EM; ▪, with 500 μM EM; ▴, with 1000 μM EM. B and C: ○, only MDZ; ●, with 20 μM DLZ, VER; ▪, with 50 μM DLZ, VER; ▴, with 100 μM DLZ, VER; ♦, with 200 μM DLZ.
Kinetic parameters for metabolism of MDZ and inhibition by EM, DLZ, and VER in rat liver microsomes
In Vivo Formation of MI Complexes of EM, DLZ, and VER in Rat Hepatic Microsomes.
Table 5 shows the in vivo formation of MI complexes of EM, DLZ, and VER in rat hepatic microsomes. Formation of MI complexes was not detected on liver microsomes from rats administered through the femoral by infusion of EM, DLZ, or VER. On the other hand, MI complexes were found when rats were treated with repeated doses (500 mg/kg for 3 days) of EM or TAO by i.p. injection.
Effect of various drugs on CYP
Comparison between Predicted Values and Observed Values of Increase of MDZ Concentration in Plasma.
Because formation of MI complexes was not detected in the liver microsomes from rats administered through the femoral by infusion of EM, DLZ, or VER, we predicted the increasing ratio of plasma concentration of MDZ in the presence of EM, DLZ, or VER according to eq. 15 (Table 6). As for EM, the increasing ratio predicted fromCpf was much underestimated, whereas the increasing ratio predicted fromCHf was very close to the observed increase. However, for DLZ and VER, the increase ratios predicted fromCHf were much underestimated.
Comparison between predicted value and observed value of increasing ratios of plasma concentration of MDZ
Discussion
To develop a methodology to predict the risk of drug-drug interaction quantitatively, it is necessary to solve several problems: 1) disposition of inhibitors in the liver, 2) concentrations of inhibitors in the portal vein or hepatic vein, 3) inhibition of metabolism in the gastrointestinal tract, and 4) drug-drug interaction in the absorption process. Prediction of the disposition of inhibitors in the liver is important because many drugs are transported into the liver by carrier-mediated hepatic uptake systems (Meijer et al., 1990;Yamazaki M., et al., 1996). We successfully predicted the increase in the plasma concentration of MDZ by histamine H2-receptor antagonists (cimetidine and nizatidine) and azole antifungal agents (ITZ and KTZ) in rats (Takedomi et al., 1998; Yamano et al., 1999). In those studies, to focus on the metabolic inhibition in the liver only, inhibitors were administered by i.v. injection, and the interacted drug, MDZ, was administered through the portal vein. The increasing ratios predicted fromCpf were much underestimated, whereas the increasing ratios predicted fromCHf were very close to the observed increasing value. It is necessary to take into account the concentrative uptake of inhibitors into the liver for the prediction of the increase of the plasma concentration of MDZ in rat. We tested the prediction for the increase in the plasma concentration of MDZ by other well known metabolic inhibitors (EM, DLZ, or VER) in this study.
The AUC of MDZ after bolus injection from the portal vein in the presence of EM, DLZ, and VER were 2.02, 1.64, and 1.30 times larger, respectively, than those of the control. Tinel et al. (1989) reported that MI complexes formed on hepatic microsomes from rats after administration of repeated doses of EM and that EM and DLZ formed in vitro MI complexes with hepatic microsomes from dexamethasone-treated rat. Drugs with a tertiary amino group, such as lidocaine, form stable metabolic intermediates to inactivate CYP (Gray et al., 1987; Saville et al., 1989; Masubuchi et al., 1992). DLZ and VER possess a tertiary amino group and may form stable metabolic intermediates to CYP (Schwartz et al., 1985; Hung et al., 1988). Therefore, it was considered that the decrease in active CYP content by the formation of MI complexes may lead to noncompetitive inhibition of hepatic metabolism of MDZ, and, therefore, the plasma concentration of MDZ increases by coadministration of EM, DLZ, or VER. Another possibility is that these inhibitors competitively inhibit the metabolism of MDZ. To evaluate the contribution of the former mechanism, we investigated the existence of MI complexes on liver microsomes from rats after infusion of EM, DLZ, or VER for 2 or 5 h. Because MI complexes were not detected, the increase in plasma concentration of MDZ by coadministration of EM, and DLZ or VER was not due to the decrease in active CYP content by the formation of MI complexes in this study. When rats were treated with repeated doses (500 mg/kg for 3 days) of EM or TAO by i.p. injection, MI complexes were formed. This result was in agreement with that of Franklin (1991).
EM is metabolized by CYP 3A and produces an MI complex that is a metabolically inactive CYP species. It was reported that, when TAO, which leads to mechanism-based inhibition similarly to EM, was incubated in rat hepatic microsomes containing NADPH, it formed a time-dependent MI complex until 20 min (Lindstrom et al., 1993). Preincubation of TAO in human hepatic microsomes ;ncreased the inhibitory potency for testosterone 6β-hydroxylation (Yamazaki H., et al., 1996). We calculated the Ki value of EM for the metabolism of MDZ with preincubation for 20 min or without preincubation. As shown in Table 4,Ki values of EM without preincubation or with preincubation were 179 and 186 μM, respectively, and were independent on preincubation. This result was supported by the findings that MI complexes of EM did not form when incubated at 37°C in the presence of NADPH on liver microsomes from rats without the pretreatment of drugs (Yamazaki H., et al., 1996). From these results, we assumed the competitive inhibition of MDZ metabolism by EM and DLZ or VER and predicted the increasing ratio of plasma concentration of MDZ by using concentrations of inhibitors and inhibition constants. As shown in Table 2, the liver unbound concentration to plasma unbound concentration ratios of EM, DLZ, and VER were 20.8, 1.02, and 3.01, respectively, suggesting a concentrative uptake of EM and VER into the liver. Table 6 shows the predicted increasing ratios of plasma concentration of MDZ in the presence of EM, DLZ, and VER and the observed values. The predicted value (1.03) was considerably underestimated with plasma unbound concentrations as the concentration of EM near the metabolic enzymes, whereas the predicted value (1.61) with unbound concentrations in the liver were very close to the observed value (2.02). We successfully predicted the increasing ratios of plasma concentration of MDZ by inhibition of ITZ and KTZ by taking into account the concentrative uptake of both inhibitors into the liver (Yamano et al., 1999), because the metabolic enzymes are localized on the endoplasmic reticulum in the hepatocyte and are physically separated from the blood by the plasma membrane, the Space of Disse, and capillary endothelium.
However, a discrepancy still remains between the observed R values and the predicted values in the presence of DLZ or VER calculated by use of unbound concentration in the liver. The discrepancy may be due to the inhibition of DLZ and VER by the metabolites. Murray and Butler (1996)reported that the Ki of demethyl-DLZ and DLZ for testosterone 6β-hydroxylation were 17 and 23 μM, respectively. Because the AUC of this metabolite is as much as that of DLZ (Yeung et al., 1990), it is expected that the inhibition potency of demethyl-DLZ on the metabolism of MDZ is as strong as that of DLZ. Assuming the protein binding of this metabolite is the same as that of DLZ, the difference between the observed values and the values predicted including this metabolite becomes smaller. However, because the disposition of this metabolite in the liver was unclear, the increasing ratio of plasma concentration of MDZ could not be predicted on the basis of unbound concentration in the liver. VER is metabolized into many metabolites including demethyl-VER (Nelson and Olsen, 1988). Consequently, it is necessary to clarify the disposition of these metabolites in the liver and the inhibition potency to predict the in vivo inhibition of DLZ and VER quantitatively.
The concentrations of inhibitors in the portal vein or hepatic vein, inhibition of metabolism in the gastrointestinal tract, and drug-drug interaction in the absorption process may play an important role in the quantitative prediction of the degree of interaction, because these inhibitors are administered orally in clinical cases. It was suggested that the contributions of metabolic inhibition and inhibition of secretion in the small intestine of MDZ by EM or grapefruit juice were larger than those of metabolic inhibition in the liver (Sawada et al., 1996). In clinical fields, the increasing ratios of AUC of MDZ after oral administration of inhibitors were much larger than the predicted value using the inhibition constants of inhibitors for MDZ 1-hydroxylation in human microsomes and the unbound concentrations in the plasma as the concentrations of inhibitors around the metabolic enzyme or using the unbound drug in the liver estimated on the assumption that there were no species differences between human and rat in the distribution of unbound drugs in the liver (Sawada et al., 1996). This underestimation may be because of the inhibition of drug metabolism in the intestinal wall or the change in absorption process. However, the contribution of these factors remains unclear, and further studies are needed. It is also necessary to take into account that the drug concentration in the portal vein is higher than that in the systemic circulation after oral administration (Hoffman et al., 1995;Tabata et al., 1995). Therefore, to estimate the unbound concentrations in the liver as the concentrations of inhibitors around the metabolic enzymes, it is necessary to estimate the maximum concentrations in the portal vein after oral administration according to eq. 19.
In conclusion, the increase in the plasma concentrations of MDZ by EM could be quantitatively predicted by use of the unbound concentrations of EM in the liver and the Ki on the metabolism of MDZ. When the inhibitors, as EM appeared to be, were actively transported into the liver, the inhibition effects were underestimated by use of the unbound concentrations of inhibitors in the plasma. However, the predicted R values in the presence of DLZ or VER calculated by use of unbound concentration in the liver were underestimated. This result may be due to the inhibition of the metabolites of both inhibitors. When predicting the degree of metabolic inhibition quantitatively, not only must the concentrative uptake of inhibitors into the liver be considered but also the inhibition by the metabolites of the coadministered drug and the disposition of these metabolites in the liver.
Footnotes
-
Send reprint requests to: Katsuhiro Yamano, Biopharmaceutical and Pharmacokinetic Research Laboratories, Fujisawa Pharmaceutical Co., Ltd., 1-6, Kashima 2-chome, Yodogawa-ku, Osaka 532-8514, Japan.
- Abbreviations:
- CYP
- cytochrome P450
- MDZ
- midazolam
- EM
- erythromycin
- DLZ
- diltiazem
- ITZ
- itraconazole
- KTZ
- ketoconazole
- VER
- verapamil
- AUC
- area under the plasma concentration curve
- R
- increasing ratio
- MI
- CYP Fe(II)-metabolic intermediate
- Received May 4, 1999.
- Accepted November 15, 1999.
- The American Society for Pharmacology and Experimental Therapeutics


