


Abstract
The objective of this study was to use recombinant enzymes and human liver microsomes (HLMs) to comprehensively evaluate the functional impact of the three most common nonsynonymous polymorphisms (S7A, T181A, and R184S) identified in the human UDP glucuronosyltransferase (UGT) 1A6 gene. In addition to the known allozymes, other possible amino acid variants were expressed in human embryonic kidney (HEK)293 cells to enable structure-function analysis. Initial studies using different substrates (serotonin, 5-hydroxytryptophol, 4-nitrophenol, acetaminophen, and valproic acid) showed similar results with 2-fold higher glucuronidation by UGT1A6*2 (S7A/T181A/R184S) compared with UGT1A6*1 (reference), and intermediate activities for other variants. Enzyme kinetic analyses with the UGT1A6-specific substrate (serotonin) showed 50% lower Km values for all R184S variants and 2-fold higher Vmax values for both S7A/T181A variants compared with UGT1A6*1. Furthermore, intrinsic clearance (Vmax/Km) values were highest for the UGT1A6*2 allozyme (2.3-fold over UGT1A6*1), resulting from additive effects of higher enzyme affinity and activity. As expected, Km values of *1/*1 genotyped HLMs (5.4 ± 0.2 mM) were similar to recombinant UGT1A6*1 (5.8 ± 0.6 mM). Conversely, *2/*2 HLMs showed higher Km values (7.0 ± 0.3 mM) rather than the lower Km values displayed by recombinant UGT1A6*2 (3.6 ± 0.3 mM), suggesting that this allozyme may display different enzyme kinetic behavior in HLMs compared with HEK293 cells. At best, these polymorphisms were predicted to account for 15 to 20% of the observed 13-fold variability in glucuronidation of UGT1A6 substrates by HLMs, indicating that there are likely other genetic or environmental factors responsible for the majority of this variation.
UDP glucuronosyltransferase (UGT) 1A6 is a major UGT isoform in human liver that catalyzes glucuronidation of a diverse range of drugs, carcinogens, and endogenous substrates (Bock et al., 1993; Court et al., 2001; Ethell et al., 2003; Krishnaswamy et al., 2003b, 2004). Previous work in this laboratory indicates that there is substantial interindividual variability in the glucuronidation of UGT1A6 substrates by human liver that may have important pharmacological, toxicological, and physiological consequences (Krishnaswamy et al., 2003a). Although a proportion of this variability is likely to result from environmental influences, including effects of pharmaceutical and dietary substances, there is also recent evidence for contributions from genetic polymorphisms.
Previous work in our laboratory (Krishnaswamy et al., 2005) and by several other groups (Ciotti et al., 1997; Nagar et al., 2004) indicates that the UGT1A6 gene is highly polymorphic, and contains at least three common coding single nucleotide polymorphisms (cSNPs), including S7A, T181A, and R184S. Haplotype analysis using DNA sequence information obtained from our human liver bank (primarily from white people) revealed significant linkage disequilibrium between each of these cSNPs, with the UGT1A6*2 allele (S7A, T181A, and R184S) representing more than 30% of identified alleles. Less common alleles included UGT1A6*3 (S7A; 6% alleles), UGT1A6*4 (S7A and R184S; 1% alleles), and UGT1A6*5 (T181A; 1% alleles). Comprehensive genotypephenotype analysis of the relationship between each of these alleles with serotonin and 4-nitrophenol glucuronidation activities, immunoquantified UGT1A6 protein, and UGT1A6 mRNA content measured in the same human liver bank did not reveal any significant association (Krishnaswamy et al., 2005). In contrast to our results, a recent study by Nagar et al. (2004) found a higher rate of 4-nitrophenol and 1-napthol glucuronidation in HLMs that were homozygous for the UGT1A6*2 allele compared with HLMs with other genotypes. Furthermore, they showed 2-fold higher 4-nitrophenol glucuronidation in human embryonic kidney (HEK)293 cells expressing recombinant UGT1A6*2 allozyme compared with UGT1A6*1-expressing cells. Interestingly, substantially lower glucuronidation activities were also observed when both UGT1A6*1 and UGT1A6*2 were coexpressed compared with either allozyme expressed alone. Since there was previous evidence in the literature for oligomerization of UGT isoforms, it was suggested that this phenomenon may be the result of unfavorable protein-protein interactions through dimerization of the two UGT1A6 allozymes.
There were, however, several limitations to the studies by Nagar et al. (2004) that should be pointed out. First, both 4-nitrophenol and 1-napthol glucuronidation was determined using a relatively nonspecific colorimetric assay. Second, it is unclear as to whether these findings can be extrapolated to other UGT1A6 substrates, such as other phenolic derivatives (acetaminophen), indoles (serotonin and 5-hydroxytryptophol), or carboxylic acids (valproic acid). Third, only the UGT1A6*2 allozyme, which contains all three amino acid substitutions, was studied. So, it is uncertain as to which of these amino acid substitutions (or combinations of multiple substitutions) are critical to the observed effect. This would be essential for the prediction of effects of the other known UGT1A6 alleles as well as other possible alleles yet to be identified.
Consequently, the objective of the work described here was to generate recombinant UGT1A6 variant enzymes, including all currently known allozymes (UGT1A6*2 to *5) as well as other possible combinations of these three amino acid substitutions (S7A, T181A, and R184S), for comprehensive structure-function analysis. The glucuronidation activities of these variants were then evaluated by HPLC analysis using five substrates, including serotonin, 5-hydroxytryptophol, 4-nitrophenol, acetaminophen, and valproic acid to determine whether the functional effects of these mutations can be generalized to other UGT1A6 substrates. Serotonin, a specific glucuronidation substrate for UGT1A6 (Krishnaswamy et al., 2003a), was then used to determine enzyme kinetic parameters using the different expressed variant enzymes. These results were compared with kinetic parameters determined for HLMs from our human liver bank that had been genotyped as being homozygous for the UGT1A6*1 and the UGT1A6*2 alleles. Finally, serotonin glucuronidation activities and UGT1A6 protein expression were evaluated in HEK293 cells cotransfected with differing proportions of plasmids encoding UGT1A6*1 and UGT1A6*2 to evaluate possible interactions between these allozymes.
Materials and Methods
Reagents. Unless otherwise indicated, most reagents, including alamethicin, UDP-glucuronic acid (UDPGA; sodium salt), 5-hydroxytryptamine hydrochloride (serotonin), 5-hydroxytryptophol, 4-nitrophenol, 4-nitrophenol glucuronide, valproic acid (sodium salt), acetaminophen, and acetaminophen glucuronide were purchased from Sigma-Aldrich (St. Louis, MO). HEK293 cells, transfection reagent (Cellfectin), and cell growth and transfection media were obtained from Invitrogen (Carlsbad, CA). All reagents were of analytical or better grade. Oligonucleotide primers were synthesized by the Tufts Core Facility (Tufts University, Boston, MA) using an automated DNA synthesizer (ABI 380B; Applied Biosystems, Foster City, CA).
Human Liver Microsomes. Liver samples from donors with no known liver disease were obtained from either the National Disease Research Interchange (Philadelphia, PA) or the Liver Tissue Procurement and Distribution Service (Minneapolis, MN) with the approval of the Tufts University Institutional Review Board. Donors were primarily white (n = 48) but also included four African-Americans and two Hispanics. Other available demographic information included gender (16 females and 38 males) and age (median 41 years; range 2-75 years). Complete details of donor demographics for individual livers have been reported previously (Hesse et al., 2004).
HLMs were prepared by differential ultracentrifugation as described previously (Court et al., 1997). Protein concentrations were determined using the bicinchoninic acid protein assay (Pierce Chemical, Rockford, IL).
Heterologous Expression of UGT1A6 Amino Acid Variants. A plasmid containing the full-length cDNA sequence coding for UGT1A6 that was previously used in the study reported by Ciotti et al. (1997) was kindly provided by Dr. Ida Owens (National Institutes of Health, Bethesda, MD). The UGT1A6 coding region was subcloned into pcDNA 3.1 V5/His Topo expression plasmid vector (Invitrogen) by polymerase chain reaction using primers 5′-agg atg gcc tgc ctc ctt cgc t-3′ (sense) and 5′-ctt ctc aat ggg tct tgg att tgt ggg-3′ (antisense). Sequencing of the original clone identified a single base pair difference (c.422a→g) that was predicted to result in a glycine for glutamate substitution at position 141 (based on our reference UGT1A6 sequence that we had previously determined in DNA from 54 human livers; Krishnaswamy et al., 2005). Consequently, this nucleotide was modified (c.422g→a) by site-directed mutagenesis using primer 5′-cac cct gaa ctt ctt taa gga gag caa gtt tga tgc tc-3′ (QuikChange; Stratagene, La Jolla, CA) to derive the reference sequence (designated UGT1A6*1). This plasmid was further modified by site-directed mutagenesis with the indicated primers to yield base changes c.19t→g (S7A) (5′-ggc ctg cct cct tcg cgc att tca gag aat ttc tgc-3′), c.541a→g (T181A) (5′-cgt gtt ccc tgg agc atg cat tca gca gaa gcc c-3′), c.552a→c (R184S) (5′-gca tac att cag cag cag ccc aga ccc tgt gtc c-3′), and c.541a→g with c.552a→c (T181A with R184S) (5′-ccc tgg agc atg cat tca gca gca gcc cag acc c-3′). Nucleotide changes were confirmed by sequencing of the resultant plasmid.
For stable transfection, HEK293 cells were grown in Dulbecco's modified Eagle's medium containing 4.5 g/l glucose, 110 μg/ml sodium pyruvate, and 10% fetal bovine serum at 37°C in a humidified incubator with carbon dioxide. Cells at approximately 50% confluence were transfected with 2 μg of pcDNA 3.1 plasmid using Cellfectin according to the manufacturer's protocol (Invitrogen). At 48 h post-transfection, media containing 400 μg/ml Geneticin were added to allow selection of transfectants over 2 weeks. Remaining resistant cells were then expanded over the next 2 weeks in media containing 200 μg/ml Geneticin. Microsomal fractions were prepared from these cells using a similar technique to that used to prepare HLMs.
For cotransfection studies, HEK293 cells at approximately 80% confluence were transfected with varied amounts of UGT1A6*1 and UGT1A6*2 plasmids (5 μg total). After 48 h, cells were harvested, pelleted by centrifugation, washed twice in phosphate-buffered saline, and whole cell homogenates were produced by sonication on ice (5 by 5-s bursts).
Glucuronidation Assays. The methods used to measure the rates of in vitro glucuronidation of serotonin (4 mM) (Krishnaswamy et al., 2003a), 5-hydroxytryptophol (1 mM) (Krishnaswamy et al., 2004), 4-nitrophenol (1 mM) (Krishnaswamy et al., 2003a), and acetaminophen (5 mM) (Court et al., 2001) were as described in detail previously. For valproic acid glucuronidation activities, incubation mixtures contained 50 mM phosphate buffer, pH 7.5, 5 mM MgCl2, 10 mM valproic acid, 5 mM UDPGA, 6.25 μg of alamethicin, and 0.05 mg of microsomal protein in a final volume of 250 μl. Incubations were performed for 3 h at 37°C and terminated by addition of 250 μl of acetonitrile containing acetaminophen as the internal standard. After centrifugation at 13,000g for 10 min, the supernatants were dried down in a vacuum oven at 45°C, reconstituted with 100 μl of water, and analyzed by HPLC. HPLC apparatus (Agilent 1100; Agilent Technologies, Palo Alto, CA) included a 250 × 4.6-mm C18 column (Synergy; Phenomenex, Torrence, CA) connected to a UV absorbance detector set at 212 nm. The HPLC mobile phase consisted of 20 mM phosphate buffer, pH 4.5, in water (solution A) and acetonitrile (B). The gradient program consisted of 15% B (0-6 min), 15 to 30% B (6-8 min), 30% B (8-20 min), 30 to 70% B (20-22 min), and 15% B (22-30 min) at a flow rate of 1 ml/min. The valproate glucuronide peak was identified by showing disappearance of the peak after both exclusion of UDPGA from the reaction mixture, and treatment of incubation product with β-glucuronidase. Valproate glucuronide peaks were quantified by use of standard curves generated by injecting known amounts of valproic acid (up to 240 nmol), assuming similar UV absorbance for substrate and glucuronide. Initial linear rate conditions with respect to time (up to 6 h) and protein concentration (up to 0.8 mg/ml) for formation of valproate glucuronide were established in preliminary studies. Using 0.2 mg/ml protein concentration and 3-h incubation time, the limit of quantitation of this assay was 0.2 nmol/min/mg protein. Intrassay variation averaged 14%, whereas interassay variation averaged less than 20%.
Enzyme kinetic values for serotonin glucuronidation by expressed UGT1A6 variants were obtained through measuring serotonin glucuronidation activities with serotonin concentrations ranging from 0.5 to 40 mM with a UDPGA concentration of 20 mM. Kinetic analysis was determined by nonlinear regression techniques as described previously (Krishnaswamy et al., 2003b).
UGT1A6 Protein Quantitation by Western Blotting. HEK293 preparations (5 μg/well) were resolved by 4 to 15% gradient SDS-polyacrylamide gel electrophoresis (Bio-Rad, Hercules, CA) and transferred onto polyvinylidene difluoride membranes (Millipore; Waters, Milford, MA). Immunochemical detection of UGT1A6 proteins was by chemiluminescence (Supersignal; Pierce Chemical) using a rabbit anti-human UGT1A6 primary antibody diluted 1:500 (WB-UGT1A6; BD Gentest, Woburn, MA) and a goat anti-rabbit horseradish peroxidase-conjugated secondary antibody (1:10,000 diluted). Blots were imaged (Image Station 440CF; Eastman Kodak, Rochester, NY), and bands were quantified using Kodak 1D Image Analysis Software (Eastman Kodak). UGT1A6 protein values were linearized using a calibration curve obtained by loading 2.5, 5, and 7.5 μg of UGT1A6*1 microsomal proteins.
Data Analysis. Statistical analyses were performed using the SigmaStat program (version 3.1; SPSS Inc., Chicago, IL). Data were routinely evaluated for normality of distribution and equal variance, and in instances where these tests failed, nonparametric methods of statistical analysis were used. Unless otherwise indicated, a p value <0.05 was considered statistically significant.
Differences in activities and enzyme kinetic values between UGT1A6 variants and between genotyped groups of human livers were analyzed initially by ANOVA on rank transformed data. In instances where the ANOVA indicated a significant effect, multiple pairwise comparisons were performed using Dunn's test to identify groups showing a significant difference (p < 0.05) from the control group (UGT1A6*1). Differences in kinetic values for serotonin glucuronidation by genotyped human livers were evaluated by unpaired t test.
Results
Glucuronidation of Representative Substrates by Stably Expressed UGT1A6 Variants. Plasmids encoding each of the eight possible combinations of the known coding variants (S7A, T181A, and R184S) were constructed using the mammalian expression vector pcDNA 3.1. Stable expression of these plasmids in HEK293 cells resulted in immunodetectable quantities of protein with the predicted molecular mass (approximately 52 kDa). As shown in Fig. 1, compared with the wild-type UGT1A6*1 microsomal preparation, the other UGT1A6 preparations showed from 35 to 60% less immunodetectable protein. Consequently, subsequent activity determinations made using each of these preparations were adjusted for these differences by dividing by the ratios given in Fig. 1.
A structurally diverse range of UGT1A6 substrates were screened for glucuronidation activity using each of the UGT1A6 allozymes. Mean activities (±S.D.; n = 3 determinations) for glucuronidation of serotonin, 5-hydroxytryptophol, 4-nitrophenol, acetaminophen, and valproic acid by UGT1A6*1 were 13 ± 0.1, 27 ± 0.2, 71 ± 2, 2.5 ± 0.1, and 1.9 ± 0.1 nmol/min/mg protein, respectively. Compared with activities determined for the UGT1A6*1, UGT1A6*2 showed 71 ± 25, 49 ± 2, 53 ± 8, 60 ± 8, and 66 ± 22% higher activities (p < 0.05 for each, Dunn's multiple comparisons test) for glucuronidation of serotonin, 5-hydroxytryptophol, 4-nitrophenol, acetaminophen, and valproic acid, respectively (Fig. 2). Other differences in activities between enzyme variants were smaller and did not achieve statistical significance (p < 0.05).
Enzyme Kinetics of Serotonin Glucuronidation by UGT1A6 Variants. For each of the UGT1A6 variants, enzyme kinetic parameters (Km and Vmax) were determined for the glucuronidation of serotonin as a representative and UGT1A6-specific substrate. In each instance, the simple Michaelis-Menten model was ascertained to best describe the data based on the appearance of both Michaelis-Menten and Eadie-Hofstee data plots. Representative Michaelis-Menten plots for both UGT1A6*1 and UGT1A6*2 are shown in Fig. 5A, and derived mean (±S.D.; n = 3 determinations) kinetic parameters for each UGT1A6 variant are shown in Fig. 3. Compared with UGT1A6*1 that had a Km value of 5.8 ± 0.6 mM, significantly lower Km values were observed for all UGT1A6 variants with the R184S substitution, including UGT1A6*2 (3.6 ± 0.3 mM; p < 0.05), UGT1A6*4 (3.4 ± 0.5 mM; p < 0.01), UGT1A6-184S (3.1 ± 0.7 mM; p < 0.01), and UGT1A6-181A,184S (4.0 ± 0.04 mM; p < 0.05). In contrast, Vmax values were higher for the two UGT1A6 variants with both S7A and T181A substitutions, including UGT1A6*2 (27 ± 1 nmol/min/mg protein; p < 0.05) and UGT1A6-7A,181A (33 ± 3 nmol/min/mg protein; p < 0.01), compared with UGT1A6*1 (16 ± 3 nmol/min/mg protein). Intrinsic clearance values were then calculated by dividing Vmax by Km and were found to be about 2-fold higher for the UGT1A6-181A,184S (6.2 ± 1.3 ml/min/kg; p < 0.05) and UGT1A6*2 (7.6 ± 0.5 ml/min/kg; p < 0.01) variants compared with UGT1A6*1 (3.3 ± 0.7 ml/min/kg).

Semiquantitative immunoblotting of recombinant UGT1A6 variants. Microsomal fractions from HEK293 cells stably expressing eight UGT1A6 amino acid variants (including the known allozymes *1 to *5) were resolved by gradient SDS-polyacrylamide gel electrophoresis, transferred to polyvinylidene difluoride membrane, probed with a rabbit anti-UGT1A6 antibody, and imaged by chemiluminescence. Shown is a representative blot (B) of three separate determinations that were quantified and expressed as a ratio relative to the UGT1A6*1 sample (A; mean ± S.D.).

Glucuronidation of structurally diverse substrates by recombinant UGT1A6 variants. Glucuronidation activities were determined in triplicate using known UGT1A6 substrates, including serotonin (4 mM), 5-hydroxytryptophol (1 mM), 4-nitrophenol (1 mM), acetaminophen (5 mM), and valproic acid (5 mM). Glucuronide formation rates expressed as the mean (±S.D.) percentage of UGT1A6*1 activity were analyzed by ANOVA of rank transformed data (p < 0.05) with Dunn's multiple comparisons test (*, p < 0.05 versus UGT1A6*1 control group).
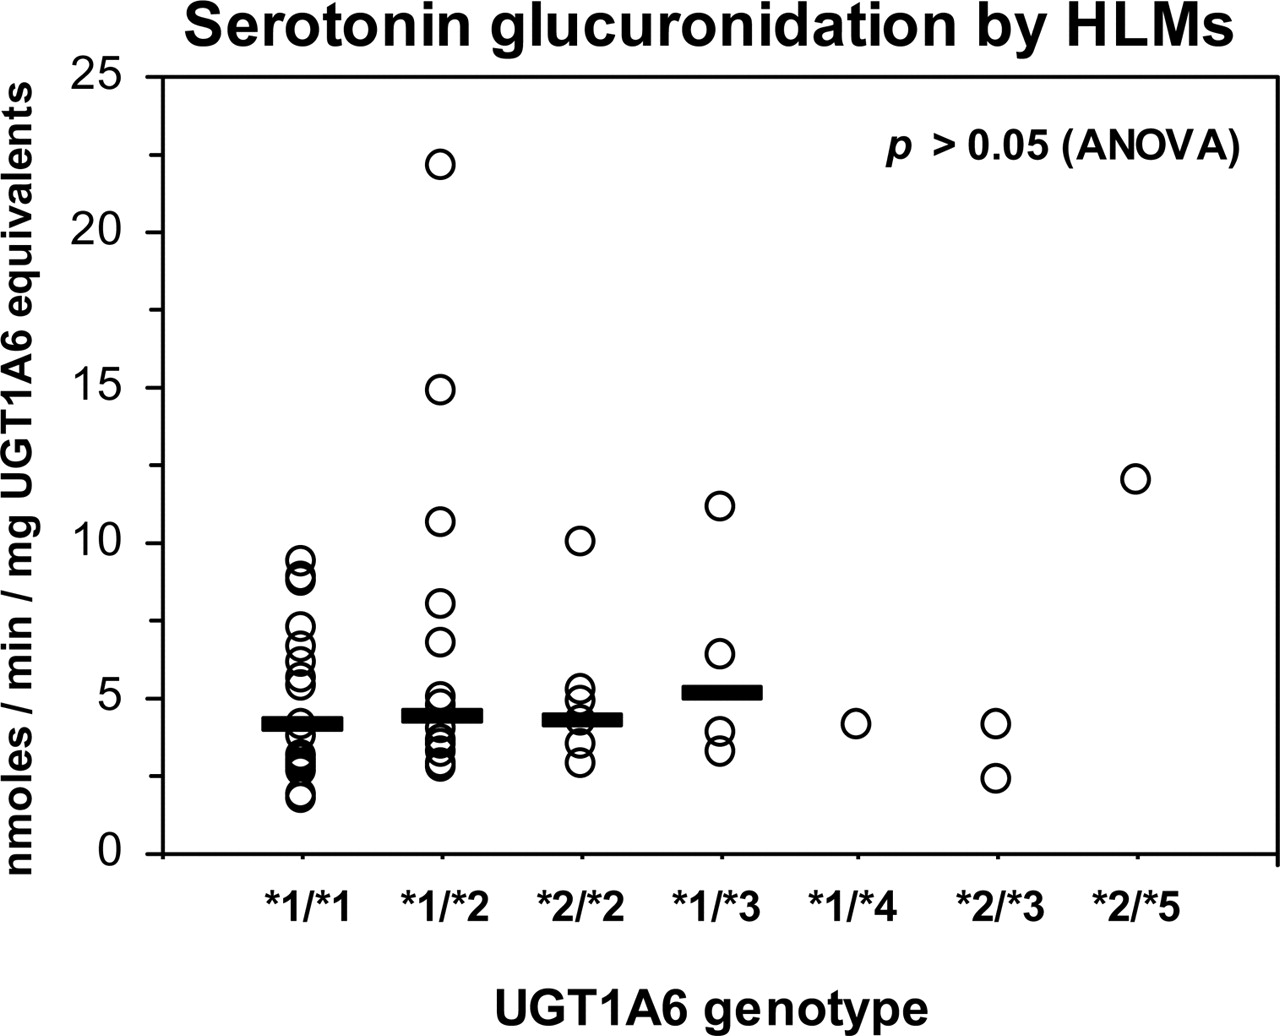
Serotonin Glucuronidation and Kinetics in Genotyped HLMs. Serotonin glucuronidation activities (measured at 4 mM substrate concentration) that we have reported previously (Krishnaswamy et al., manuscript submitted for publication) for a genotyped bank of HLMs were reanalyzed by normalizing values to microsomal UGT1A6 protein content for each liver to derive an estimate of specific activity (nanomoles per minute per milligram UGT1A6 equivalent). As shown in Fig. 4, no differences in serotonin glucuronidation specific activities could be discerned between livers when grouped by UGT1A6 genotype (p > 0.05; ANOVA).
Enzyme kinetic values were then determined for representative HLMs identified as either UGT1A6*1/*1 (n = 3) or UGT1A6*2/*2 (n = 3) genotype (Table 1). As illustrated in Fig. 5B, these data were well characterized by the simple Michaelis-Menten model. UGT1A6*1/*1 livers showed Km values (5.4 ± 0.2 mM) that were similar to recombinant UGT1A6*1 (5.8 ± 0.6 mM). However, rather than showing lower Km values, like recombinant UGT1A6*2 (3.6 ± 0.3 mM), UGT1A6*2/*2 genotyped livers showed higher Km values (7.0 ± 0.3 mM; p < 0.05, unpaired t test) compared with UGT1A6*1/*1 livers. No differences in Vmax or intrinsic clearance values were found between genotyped livers.
Serotonin glucuronidation kinetic values determined for representative genotyped human liver microsomes

Enzyme kinetic parameters for serotonin glucuronidation by recombinant UGT1A6 variants. Glucuronidation activities were determined using 0.5 to 40 mM serotonin with 20 mM UDPGA concentrations. Kinetic parameters, including Km (A), Vmax (B), and intrinsic clearance (Vmax/Km; C), were derived by nonlinear regression using the simple Michaelis-Menten model. Shown are mean (±S.D.) of triplicate determinations analyzed by ANOVA of rank transformed data (p < 0.05) with Dunn's multiple comparisons test (*, p < 0.05; **, p < 0.01 versus UGT1A6*1 control group).
Coexpression of UGT1A6*1 and UGT1A6*2 Allozymes. Transient expression experiments were conducted using HEK293 cell cultures that were cotransfected with differing proportions of UGT1A6*1 and UGT1A6*2 expression plasmids (5 μg of total plasmid per well). Similar to our previous findings using stably transfected HEK293 cells, cells transiently transfected with UGT1A6*2 alone showed about 40% lower UGT1A6 protein compared with UGT1A6*1 alone, whereas cells transfected with both plasmids showed intermediate amounts of UGT1A6 protein (Fig. 6A). These results were mirrored by serotonin glucuronidation and 4-nitrophenol glucuronidation activities normalized to UGT1A6 protein content in that activities were approximately 70 and 30% higher (respectively) in cells transfected with UGT1A6*2 alone compared with UGT1A6*1 alone, whereas cells transfected with both plasmids were also intermediate in activities (Fig. 6B). Similar results were also obtained with the UGT1A6*1 and UGT1A6*2 expression plasmids (also in pcDNA3.1) that had been used in the previous study reported by Nagar et al. (2004) (data not shown).

Influence of UGT1A6 genotype on UGT1A6 specific activity in human liver. Glucuronidation activities for the UGT1A6-specific substrate serotonin (4 mM) were measured using a bank of HLMs (n = 54) that had been previously genotyped for UGT1A6 cSNPs. Activities were normalized to UGT1A6 protein content determined for each HLM sample by immunoblotting using recombinant UGT1A6 as the quantitation standard. The horizontal bar indicates the median value for each group. No differences between genotype groups could be detected by Kruskal-Wallis one-way ANOVA on rank transformed data for each set of data (p > 0.05).
Discussion
The objective of this study was to use recombinant enzymes and human liver bank tissues to comprehensively evaluate the functional impact of three highly prevalent UGT1A6 cSNPs. Recombinant enzymes were generated that included all known allozymes, as well as other possible combinations of these cSNPs to enable structure-function analysis. Initial studies confirmed previous findings of higher 4-nitrophenol glucuronidation by the UGT1A6*2 allozyme compared with wild-type UGT1A6*1 (Nagar et al., 2004). Furthermore, we found similar differences in glucuronidation activities for 4 other UGT1A6 substrates, indicating that this effect was unlikely to be substrate specific. Consequently, subsequent enzyme kinetic analyses of recombinant enzyme and HLMs were performed using serotonin as a highly specific UGT1A6 substrate (Krishnaswamy et al., 2003a).

Representative enzyme kinetic plots for serotonin glucuronidation by recombinant UGT1A6*1 and UGT1A6*2 allozymes (A) and HLMs from human livers genotyped as homozygous *1/*1 (LV12) and *2/*2 (LV40) (B). Shown for each set of data are measured activities (average of duplicate determinations) and a curve illustrating the goodness of fit of the derived kinetic parameters to these experimental data determined by nonlinear regression with the simple Michaelis-Menten model.
Enzyme kinetic parameters were found to differ significantly between allozymes with several notable trends. Interestingly, all enzyme variants that incorporated the R184S substitution, including the *2 and *3 allozymes, showed higher apparent substrate affinity as reflected by 50% lower Km values compared with the *1 wild-type enzyme. The position of this mutation is within a hypervariable region (amino acid residues 164-189) located in the divergent N-terminal half of the UGT1A6 polypeptide that may be important in defining substrate specificity (Tukey and Strassburg, 2001). Although no single amino acid substitution seemed to affect Vmax values, both of the combined S7A/T181A variants, including the *2 allozyme, had 40 to 70% higher Vmax values compared with the *1 allozyme. Since the 181 residue is also located within the previously defined hypervariable region (residues 164-189), it is possible that this mutation may enhance catalysis through active site interactions but without an influence on substrate affinity.
The effect of the S7A mutation is more difficult to explain since it is located within the putative signal peptide region (residues 1-26) of the newly synthesized protein that is likely cleaved soon after microsomal membrane insertion. However, it could be speculated that the alanine substitution within the UGT1A6 signal peptide region may facilitate the function of the signal peptide, thereby enhancing membrane targeting and insertion. In this regard, work by Ouzzine et al. (1999) has shown that deletion of the entire signal peptide region (wild-type sequence) does not affect UGT1A6 membrane targeting, membrane integration, or catalytic activity. These results were suggested by the authors to indicate the presence of an internal signal sequence. However, it also indicates that the UGT1A6 wild-type N-terminal signal sequence is nonessential and may be nonfunctional. Based on our results, it is possible that the N-terminal region of the alanine variant may function normally as a signal peptide, whereas substitution of this alanine for a serine (i.e., the wild-type sequence) eliminates this functionality. Experiments involving deletion of the signal peptide region from both the wild-type enzyme and S7A variant would help to further elucidate the functional relevance of this particular substitution.

UGT1A6 protein content (A), serotonin glucuronidation activities (B), and 4-nitrophenol glucuronidation activities (C) measured in homogenates of HEK293 cells that had been transiently transfected with 0 to 5 μg (5 μg total) of pcDNA3.1 mammalian expression plasmids encoding the UGT1A6*1 and UGT1A6*2 allozymes. All activities were normalized to UGT1A6 protein content determined by immunoblotting.
Species comparative sequence analysis can be useful in speculating as to the adaptive advantages of each of these polymorphisms. Alignment of available UGT1A6 N-terminal sequences from eight species (Fig. 7) indicates that the N-terminal residue 7 is most frequently an alanine (four of eight species), whereas serine is not found at this position in any species, other than humans. This finding suggests that the serine substitution might be disadvantageous to enzyme function. Interestingly, this is in direct contrast to the T181A and R184S polymorphisms where it is the wild-type amino acids (threonine and arginine) that are most frequently identified at these positions in other species (five of eight species), whereas none of the other species possess an alanine or serine at these respective positions. Furthermore, it should be noted that in species that differed from humans at these positions, there was not substitution of one amino acid without substitution of the other amino acid. This suggests either that there might be adverse consequences of substituting one amino acid without the other, or perhaps beneficial effects of simultaneous substitution of both residues. In support of the latter contention, our experimental data showed that only the recombinant enzymes with both T181A and R184S substitutions (including the *2 allozyme) had significantly higher intrinsic clearances compared with the wild-type *1 allozyme, most likely resulting from combined effects of lower Km (R184S), and higher Vmax (T181A) values.

Alignment of human UGT1A6*1 and UGT1A6*2 allozyme sequences with UGT1A6 sequences from eight other species. Sequence information was obtained from GenBank files NM_001072.2 (human), AF_104337 (monkey), MMU_16818 (mouse), J_02612 (rat), OCU_09030 (rabbit), AB_018477 (sheep), AB_008677 (cow), AJ_290948 (dog), and AF_333815 (ferret). Amino acid sequences were derived by virtual translation of cDNA data and aligned by ClustalW. Shown are regions surrounding the known human UGT1A6 cSNPs (S7A, T181A, and R184S) with the most frequently identified residues found at these positions highlighted.
Our findings are similar to those previously reported by Nagar et al. (2004) in that they found lower Km, higher Vmax and high intrinsic clearance values for the *2 compared with the *1 allozyme. They also found lower Km values for the *3 and *4 allozymes, but in contrast to our findings where there was no difference in Vmax values, they also showed higher Vmax values for both the *3 and *4 allozymes. These disparities could be a consequence of the use of different substrates for kinetic analysis (serotonin in this study, 4-nitrophenol in the previous study), although our initial comparison of five substrates suggests that this is unlikely.
Results from both stable and transient (*1 and *2 only) transfections suggest that UGT1A6 protein levels may be lower in cells expressing the UGT1A6 variant allozymes compared with UGT1A6*1. Although this could simply be an effect of the amino acid substitutions on antibody binding, the antibody we used for immunoblotting was prepared using a peptide immunogen from a region that did not include known polymorphic sites (WB-UGT1A6; BD Gentest). Alternatively, it may reflect enhanced protein degradation as a result of the amino acid changes as has recently been described for other drug metabolizing enzymes, including thiopurine methyltransferase (Wang et al., 2003) and sulfotransferase (Wang et al., 2004).
In previous work, we found no significant effect of UGT1A6 genotype on serotonin glucuronidation (normalized to microsomal protein concentration) or on UGT1A6 protein content measured using a bank of HLMs (Krishnaswamy et al., 2005). Results from the present study using recombinant enzyme suggested that there might be an effect if activities were normalized to UGT1A6 protein content. However, as shown in Fig. 4, there were no differences in serotonin glucuronidation-specific activities between livers when grouped by UGT1A6 genotype. These activities were determined using a serotonin concentration approximating the Km value (4 mM) for UGT1A6 to enhance the possibility of finding a genotype effect resulting from differences in either enzyme Km or Vmax. Since we had previously identified livers that could be predicted to express only the *1 allozyme (*1/*1 homozygotes) or only the *2 allozyme (*2/*2 homozygotes), detailed enzyme kinetic analyses were also performed using HLMs from representative livers. As expected, the *1/*1 livers showed essentially identical Km values to that of the *1 recombinant allozyme. However, in contrast to the recombinant *2 allozyme, where Km was lower compared with the *1 allozyme, *2/*2 livers showed consistently higher Km values. The reason for this difference in Km values between recombinant enzyme and HLMs is unclear, although there may be proteins or other factors expressed in human liver but not in HEK293 cells that could influence enzyme-substrate interactions values. UGT enzymes have also been shown to form hetero-oligomers (Miners et al., 2004), and it is possible that heterodimerization of UGT1A6*2 (but not UGT1A6*1) with other UGT isoforms present in liver could influence apparent Km values.
Nagar et al. (2004) also reported very low 4-nitrophenol glucuronidation activities in HEK293 cells coexpressing equal amounts of *1 and *2 allozymes compared with activities of cells expressing each allozyme alone. Since this was an unusual finding, we attempted to replicate and extend upon this work by transfecting HEK293 cells using differing proportions of plasmids expressing either the *1 or *2 allozymes and assessing effects on serotonin and 4-nitrophenol glucuronidation. However, we were unable to demonstrate any interaction, in that coexpressed cell homogenates showed UGT1A6 protein content and glucuronidation activities (normalized to UGT1A6 content) that were essentially intermediate between that of cells expressing *1 and *2 allozymes alone. Similar results were also obtained using UGT1A6*1 and UGT1A6*2 plasmids provided by Nagar et al. (2004).
In conclusion, we have determined that three common UGT1A6 cSNPs have a measurable, although relatively modest effect on glucuronidation of a range of UGT1A6 substrates using recombinant enzymes. Compared with wild-type (*1) enzyme, the *2 allozyme incorporating all three cSNPs showed the greatest difference with more than 2-fold higher intrinsic clearance values resulting from lower Km and higher Vmax values. However, studies using HLMs showed higher Km values for *2/*2 livers compared with wild-type livers indicating that the *2 allozyme may display different enzyme kinetic behavior in human liver compared with HEK293 cells. Despite this, at best these cSNPs are predicted to account for only 15 to 20% (based on the measured 2- to 2.5-fold difference in intrinsic clearance values between *2 and *1 allozymes) of the previously observed 13-fold variability in glucuronidation of UGT1A6 substrates by HLMs (Krishnaswamy et al., 2003a). Consequently there are likely to be other factors, including as yet unidentified genetic variants and environmental influences that are responsible for the majority of interindividual variability in UGT1A6-mediated glucuronidation.
Footnotes
-
This work was supported by Grants GM-61834, DA-05258, MH-58435, DA-13209, DK-58496, AG-17880, AT-01381, AI-058784, and RR-00054 from the National Institutes of Health and by Department of Pharmacokinetics, Dynamics and Metabolism, Pfizer Global Research and Development (Ann Arbor, MI).
-
Article, publication date, and citation information can be found at http://jpet.aspetjournals.org.
-
doi:10.1124/jpet.104.081968.
-
ABBREVIATIONS: UGT, UDP glucuronosyltransferase; cSNP, nonsynonymous (coding) single nucleotide polymorphism; HLM, human liver microsome; HEK, human embryonic kidney; HPLC, high-performance liquid chromatography; UDPGA, UDP-glucuronic acid; ANOVA, analysis of variance.
- Received December 8, 2004.
- Accepted March 3, 2005.
- The American Society for Pharmacology and Experimental Therapeutics


