


Abstract
In this study, we show that peroxisome proliferator chemical (PPC) exposure leads to alterations in the expression of genes in rat liver regulated by the sex-specific growth hormone secretory pattern and induced during inflammation. Expression of the male-specificcytochrome P450 (P450) 2C11 and α2 urinary globulin (α2u) genes and the female-specificP450 2C12 gene was down-regulated by some PPC. Expression ofP450 2C13, also under control by the sex-specific growth hormone secretory pattern, was not altered by PPC treatment, indicating that regulation of CYP2C family members does not involve perturbation of the growth hormone secretory pattern. In contrast to the increases in expression observed when inflammation was induced in male rats, two positive acute-phase response genes, α1-acid glycoprotein and β-fibrinogen, were decreased by PPC exposure. The down-regulation of the P450 2C11 by WY-14,643 could be reproduced in cultured rat hepatocytes, indicating the down-regulation is a direct effect. Experiments in wild-type mice and mice that lacked a functional peroxisome proliferator-activated receptor-α gene showed that down-regulation by WY of α1-acid glycoprotein,β-fibrinogen, and a mouse homologue of α2uwas dependent on peroxisome proliferator-activated receptor-α expression. Our results demonstrate that PPC exposure leads to down-regulation of diverse liver-specific genes, includingCYP2C family members important in hormonal homeostasis and acute-phase response genes important in inflammatory responses.
Peroxisomes are ubiquitous eukaryotic organelles that play a key role in regulating lipid homeostasis in mammals. An ever-increasing number of economically significant pharmaceutical, industrial, agricultural, and laboratory chemicals have been found to induce the proliferation of hepatocellular peroxisomes in test animals. These PPCs are a large group of >100 structurally diverse xenobiotics, including hypolipidemic drugs, herbicides, perfluorinated fluids, chlorinated solvents, and plasticizers (Ashby et al., 1994). Despite the structural dissimilarities and pharmacokinetic properties of these PPCs, chronic administration to rodents leads to a remarkable stereotypical and temporal hepatic response consisting of hepatomegaly, formation of hepatic adenomas, and hepatocellular carcinomas that is concomitant with the peroxisome proliferation (Lapinskas and Corton, 1998). The carcinogenicity of some of these chemicals in rodents, coupled with widespread human exposure, raises concern that PPCs may contribute to human cancer risk (Reddy and Lalwai, 1983). However, the scientific validity of this assumption needs to be established.
Many facets of the molecular mechanism of enzyme induction by PPCs are known. PPCs, as well as long-chain unsaturated fatty acids and a number of eicosanoids, have been shown to activate members of the nuclear receptor superfamily called PPARs (reviewed in Lapinskas and Corton, 1998). Three distinct isoforms of PPAR encoded by separate genes have been isolated and termed PPARα, PPARδ (also known as Nucl and PPARβ), and PPARγ. In the presence of inducers, PPARα, the principal isoform expressed in the liver, activates expression of many genes whose products are involved in the metabolism of fatty acids; these include genes involved in fatty acid β-oxidation (ACO), fatty acid ω-oxidation (P450 4A family members), ketogenesis (3-hydroxy-3-methylglutaryl-CoA synthetase), lipogenesis (malic enzyme), fatty acid transport (fatty acid binding protein), glycerolneogenesis (phosphoenolpyruvate carboxykinase), and serum transport proteins (transthyretin, transferrin, and apolipoproteins). All of these genes have within their regulatory regions two or more copies of the sequence TG(A/T)CCT in the direct repeat orientation separated by one base pair called PPREs. These genes are all likely activated by a heterodimer of PPARα and the receptor for 9-cis retinoic acid (retinoid X receptor), which recognizes PPRE in the presence of PPCs, fatty acids, or eicosanoid activators. PPARα was shown to be a global regulator of genes involved in peroxisomal β-oxidation of fatty acids in the liver because inducibility of these genes by PPCs is abolished in mice that lack a functional PPARα gene (Lee et al., 1995).
To better understand the molecular mechanisms of the pleiotropic responses induced by exposure to PPCs, we made a concerted effort to clone and characterize genes that are modulated in the rat liver after exposure to a PPC. The α2 urinary globulin (α2u) was recently identified by Alvares et al. (1996) and by ourselves (Corton and Gustafsson, 1997) as a gene down-regulated by PPCs. Besides regulation by PPCs, this male-specific gene is controlled by the male-specific pulsatile release of GH (Roy et al., 1983) and negatively controlled by cytokines released during inflammation (Birch and Schreiber, 1986). To begin to understand how PPCs down-regulate α2u, we determined whether other genes regulated by the sex-specific GH secretory pattern or genes induced during inflammation also were regulated by PPC. We report here that PPCs down-regulate the expression of many liver-specific genes, including those in the CYP2C family of steroid hydroxylases and positive acute-phase response genes induced during inflammation.
Experimental Procedures
Materials.
Collagenase was purchased from Worthington Biochemicals (Freehold, NJ). Matrigel and media for culturing rat primary hepatocytes were obtained from Collaborative Biochem (Bedford, MA). Proteinase K was obtained from Merck (Darmstadt, Germany). RNase A and RNase T1 were from Boehringer-Mannheim (Mannheim, Germany). Restriction endonucleases, ligase, plasmid vectors, and reagents for in vitro transcription of cRNA probes were supplied by Promega Biotech (Madison, WI). [35S]UTP (>1000 Ci/mmol) and [32P]UTP (400 Ci/mmol) were from Amersham International (Buckinghamshire, UK).
Animals.
This study was conducted under federal guidelines for the use and care of laboratory animals and was approved by the Chemical Industry Institute of Toxicology Institutional Animal Care and Use Committee. In the first five experiments, F344 [CDF(F344)/CrlBR] and Sprague-Dawley (Harlan Sprague-Dawley derived) rats were obtained from Charles River Breeding Laboratories (Raleigh, NC). In the sixth experiment, male Harlan Sprague-Dawley rats were purchased from Harlan Sprague-Dawley (Indianapolis, IN). In the seventh experiment, male SV129 wild-type mice were purchased from Taconic (Germantown, NY), and male SV129 PPARα null mice (Lee et al., 1995) were a kind gift from Frank Gonzalez (National Cancer Institute, Bethesda, MD). Control and treated rats and mice were provided with NIH-07 rodent chow (Ziegler Brothers, Gardner, PA) and deionized, filtered water ad libitum. Lighting was on a 12-hr light/dark cycle. In the first experiment, F344 rats were given a single gavage dose of WY-14,643 (ChemSyn Science Laboratories, Lenexa, KS) at 50 mg/kg body weight and killed 1, 3, 6, 12, or 24 hr after treatment. In the second experiment, male and female F344 rats and male Harlan Sprague-Dawley rats were fed 500 ppm WY, 8000 ppm GEM (Sigma Chemical, St. Louis, MO), or 20,000 ppm DBP (Aldrich Chemical, Milwaukee, WI) for 13 weeks. In the third experiment, male and female F344 rats were given gavage doses of either vehicle (methylcellulose), WY (50 mg/kg body weight), or DEHP (2000 mg/kg body weight) in methylcellulose each day for 3 days. In the fourth experiment, F344 rats were given an intraperitoneal injection of killed Corynebacterium parvum whole cell (RIBA Immunochemical, Hamilton, MT) at 28 mg/kg body weight and killed 7 days after injection. In the fifth experiment (conducted by the National Toxicology Program, National Institute of Environmental Health Sciences, Research Triangle Park, NC), male Harlan Sprague-Dawley rats were fed the indicated doses of WY (ChemSyn Science Labs), GEM (Sigma Chemical), or DBP (ChemCentral) for 1, 5, or 13 weeks. In the sixth experiment, male SV129 wild-type and SV129 PPARα null mice were fed WY (0.1%), DEHP (0.6%), or a control diet for 3 weeks. At the designated time after treatment, animals were deeply anesthetized by isofluorane anesthesia or pentobarbital injection and killed by exsanguination. The livers were removed, rinsed with isotonic saline, snap-frozen in liquid nitrogen, and stored at −70° until analysis.
Hepatocyte isolation and cell culture.
For preparation of primary hepatocytes, adult male Fischer F344 rats, weight ∼200–250 g, were obtained from Charles River (Raleigh, NC). The animals were maintained under conditions of constant temperature and humidity and allowed chow and water ad libitum. A thin coat of Matrigel was applied to 100-mm-diameter plastic culture dishes and allowed to gel at room temperature. Hepatocytes were isolated by nonrecirculating collagenase perfusion through the portal vein of pentobarbital-anesthetized rats according to the method of Kedderiset al. (1988). Cells (1.5 × 10⁶per 100-mm plate with viability 85–95% as determined by trypan blue exclusion) were plated in 3 ml of modified Waymouth medium containing insulin (0.2 μg/ml) as the only hormone. Cultures were maintained in an incubator at 37° in an atmosphere containing 5% CO2. Medium was replaced daily, commencing 24 hr after the cells were plated. Cells were cultured for 5 days before treatment to optimize for P450 2C11 expression (Chen et al., 1995). DMSO or WY was added at the indicated concentrations, and the cells were incubated for 48 hr. Medium was aspirated from culture dishes and replaced with 2 ml of ice-cold, phosphate-buffered saline, with 5 mm EDTA, pH 7.4. The cells and Matrigel were transferred to 15-ml capped plastic tubes and then allowed to stand on ice for 45 min to dissolve the Matrigel. Cells were then collected by centrifugation at 750 × g for 5 min and lysed in lysis buffer. Extracts were used for analysis of protein expression. Experiments were repeated twice with similar results.
Solution hybridization.
The solution hybridization experiments were carried out essentially as described earlier (Tolletet al., 1990). tNA were prepared by digestion of liver with proteinase K followed by phenol-chloroform extraction. The concentration of tNA in the samples was determined spectrophotometrically, and the DNA concentration was quantified using a specific fluorometric method. Abundance of the respective mRNA for P450 2C11, P450 2C12, and P450 2C13 was determined using35S-UTP-labeled cRNA probes transcribed in vitro from cDNA templates. The cDNA templates corresponding to the full-length cDNA base pairs were P450 2C11, 1580–1884; P450 2C12, 681–731; and P450 2C13, 1537–1720. Temperature and formamide concentration were optimized for each assay: 20% formamide and 75° for P450 2C11 and P450 2C13; 20% formamide and 65° for P450 2C12. Quantification of the mRNA species was achieved by comparison with standard curves obtained from hybridizations to liver tNA calibrated to known amounts of in vitro synthesized mRNA. All samples were analyzed in triplicate.
Northern blot hybridization.
Total RNA was isolated by modification of the guanidinium isothiocyanate method using RNazol according to manufacturer’s instructions (Tel-Test, Friendswood, TX). Denatured total RNA was separated on 1.0% formaldehyde-agarose gels and transferred to Hybond-N Nylon membranes in 20× standard saline citrate. Hybridization and washing conditions were described previously (Fan et al., 1998). The probes include full-length rat α2u-globulin cDNA isolated from a rat heart cDNA library (Corton J. C., unpublished data), an oligonucleotide specific for mouse major urinary protein-I (5′-AGGGAATAGGATTGTCTG-3′) (GenBank Accession no. M16355) (Shahan et al., 1987), rat α1-acid glycoprotein oligonucleotide (5′-TCCCCGGAGTTCAGAGAGCTGAGTTCATGC-3′) complementary to nucleotides 660–689 in the rat cDNA (Ricca et al., 1981) or 645–674 in the mouse cDNA (5′-GAGTTCAGAGAGCTGAGTTCATGCCTGGCC-3′) (Lee et al., 1989), and β-Fib cDNA (kindly provided by Gerald Fuller, University of Alabama at Birmingham). The 700-kb PstI cDNA fragment of the ACO cDNA (kindly provided by Dr. Hilde Nebb-Sörensen, Institute of Medicine and Biochemistry, University of Oslo, Oslo, Norway) was used as a positive control. β-Actin was used as a loading control. The probes for Northern analysis were labeled with α-32P-dCTP (Amersham, Cleveland, OH) using the random-primer DNA labeling kit according to the manufacturer’s instructions (Stratagene, La Jolla, CA).
Western blot analysis.
Whole-cell protein extracts (50–120 μg of total protein) made according to Corton et al.(1996) were denatured and size-separated by 12.5% or 15% SDS-PAGE. Proteins were transferred to nitrocellulose membranes and visualized by Ponceau Red to confirm transfer. The blotted proteins were probed with polyclonal or monoclonal antibodies followed by anti-rabbit or anti-mouse IgG coupled to horseradish peroxidase and visualized by enhanced chemiluminescence (ECL Amersham; or SuperSignal, Pierce Chemical, Rockford, IL). The anti-α2u-globulin antibodies were a kind gift from Otto Neuhaus (University of South Dakota, Vermillion, SD). Levels of the mouse homologue of rat α2u called mouse urinary protein-I could not be measured because the antibodies against the rat α2u did not cross-react with the mouse MUP proteins despite up to 50% amino acid identity shared with α2u. The anti-P450 2C11 (Morganet al., 1985) or anti-P450 2C12 (Morgan et al., 1987) antibodies have been described. The anti-ACO antibody was a kind gift from Stefan Alexson (Huddinge University Hospital, Huddinge, Sweden). The anti-fibrinogen antibodies were purchased from Affinity Biologicals, South Bend, IN. Antibodies to the rat fibrinogen chains were raised starting with the three purified fibrinogen polypeptides, which migrated at 68–70, 55, and 48kDa (personal communication, Hugh Hugodorn, Affinity Biologicals, South Bend, IN) corresponding to the published molecular weights of α-, β-, and γ-fibrinogen. In our experiments, using both rat and mouse liver extracts we detect proteins of 65 and 55kDa, which correspond in size to the α and β chains of fibrinogen. Antibodies against the rat male-specific P450 2C13 (GenTest, Woburn, MA) cross-reacted equally with P450 proteins in male and female rats (data not shown) and thus were not suitable for Western blot analysis. Autoradiograms for Northern and Western blots were densitometrically scanned using Image-1 image analysis system (Universal Imaging Corporation, West Chester, PA) and NIH Image 1.54 software.
Results
Altered expression of CYP2C family members by PPC.
To gain insight into the mechanism of α2u down-regulation by PPC, we examined the expression of other genes that are regulated in a manner similar to α2u, including members of theP450 2C family, known to be important in hydroxylating steroids. Like α2u, members of the P450 2Cfamily have been shown to exhibit sex-specific expression (Legraverendet al., 1992) and to be negatively regulated by bacterial lipopolysaccharide (Chen et al., 1995). Expression of male-specific CYP2C11 and CYP2C13 and female-specific CYP2C12 genes was assessed in the livers of male and female rats treated with PPC by solution hybridization. Male and female F344 rats were fed 500 ppm WY, 8000 ppm GEM, or 20,000 ppm DBP in the diet for 13 weeks. As shown in Table1, WY exposure almost completely abolished expression of CYP2C11 in male rat liver to 0.4% of control levels. GEM and DBP decreased expression to 26% and 40% of control levels, respectively. As expected, CYP2C11expression in untreated female livers was undetectable. Exposure of female rats to PPC did not appreciably affect expression ofCYP2C11. Under these conditions, ACO was strongly induced by each PPC in female livers (Corton et al., 1996). In female rats, GEM decreased P450 2C12 mRNA levels to 37% of control levels (Table 1). WY and DBP exposure did not result in statistically significant changes in P450 2C12 mRNA levels. In male rats, there were no significant changes in P450 2C12 expression in liver. In contrast to P450 2C11, P450 2C13 levels in male rats were not appreciably affected by exposure to any PPC. P450 2C13 expression in female rat liver was not detectable and increased after PPC treatment, although induced levels were far below those in male rat livers. Duplicate experiments with male Sprague-Dawley rats treated identically with PPC demonstrated that the two rat strains exhibited qualitatively similar changes in P450 2C gene expression (data not shown).
Expression of P450 2C family members after PPC exposure
We next determined whether expression of the P450 2C proteins decreased in parallel with mRNA levels. In these experiments, we compared the expression of P450 2C family members with that of α2u-globulin. α2u-Globulin, P450 2C11, and P450 2C12 protein levels were determined by Western analysis of whole-cell liver extracts. Using a polyclonal antibody against α2u, a protein of the correct size (∼18 kDa) was highly expressed in untreated male rat livers but not detectably expressed in female rat livers (Fig. 1A). A protein of ∼65 kDa found in both male and female livers also was detected. The origin of this protein is not known. Exposure to WY or GEM severely decreased expression of α2u (2% and 17% of control, respectively) (Fig. 1D). Exposure to DBP did not alter expression of α2u. Exposure to PPC did not detectably affect expression of α2u in female rats. Few, if any, changes were detected in the expression of the ∼65-kDa protein after PPC exposure.

Decreased expression of α2u, P450 2C11, and P450 2C12 proteins after PPC exposure. Whole-cell liver extracts from male and female F344 rats given a control diet (Control) or a diet of WY (500 ppm), GEM (8000 ppm), or DBP (20,000 ppm) for 13 weeks were separated by 12.5% or 15% SDS-PAGE, transferred to nitrocellulose, and probed with antibodies against α2u (A), P450 2C11 (B), or P450 2C12 (C). A, Numbers on left, position of molecular mass markers (in kDa). D, Quantification of protein expression. The Western data were densitometrically scanned, and protein expression was quantified. Expression of α2u and P450 2C11 in male rats and P450 2C12 in female rats was compared with treated male rats or female rats, respectively. Histograms, mean expression (mean ± standard deviation) from four different samples. ∗, Significantly different from control (p <0.05). E, Expression of α2u and P450 2C11 proteins after C. parvum treatment. Male rats were treated with C. parvum for 7 days, and whole-cell liver extracts were analyzed for protein expression.
Exposure to some PPCs resulted in changes in P450 2C11 protein levels similar to that seen with α2u (Fig. 1B). Using a monoclonal antibody against P450 2C11, one major band of ∼50 kDa was detectable in untreated male, but not untreated female, rat livers. Under these conditions of maximal sensitivity (i.e., 100 μg of protein/lane and long exposure times), a number of smaller immunoreactive proteins also were observed that may have been proteolytic products of P450 2C11. After WY exposure, expression of P450 2C11 was abolished (0% of control) (Fig. 1D). Very little expression was detectable after GEM exposure (9.6% of control). DBP exposure did not result in a significant change in P450 2C11 expression.
Exposure of female rats to WY led to decreases in P450 2C12 protein (9% of control). GEM and DBP treatment did not lead to statistically significant changes in P450 2C12. As expected, little, if any, P450 2C12 expression was detected in male rats fed a control diet or diets containing WY or DBP. Surprisingly, GEM exposure led to a dramatic increase in a protein in male rats that was indistinguishable in size from the female P450 2C12 protein. Because the CYP2C12 gene is not induced in GEM-treated male rats (Table 1), this GEM-inducible protein is unlikely to be P450 2C12 but may be an uncharacterized member of the P450 2C family selectively induced by GEM but not the other PPC.
We also examined the expression of α2u and P450 2C11 proteins in male rats treated for 7 days with the classic inflammatory inducer, killedC parvum bacteria. As expected treatment with C.parvum led to parallel decreases in the expression of α2u and P450 2C11 (Fig. 1E).
Altered regulation of positive acute-phase response genes by PPC.
Because PPC exposure seemed to be mimicking the down-regulation of α2u and P450 2C11 after inflammation, we examined the expression of the positive acute-phase response genes AGP, a positive class I acute-phase gene regulated by interleukin-1 and tumor necrosis factor-α, and β-Fib, a positive class II acute-phase gene regulated by interleukin-6. Expression of β-Fib and AGP mRNAs was shown to be similarly down-regulated in the livers of male rats after exposure to PPCs. β-Fib mRNA levels were down-regulated by WY, GEM, and DBP to 29%, 40%, and 62% of control, respectively (Fig. 2A). AGP mRNA levels were down-regulated to 20%, 36%, and 49% of control, respectively.
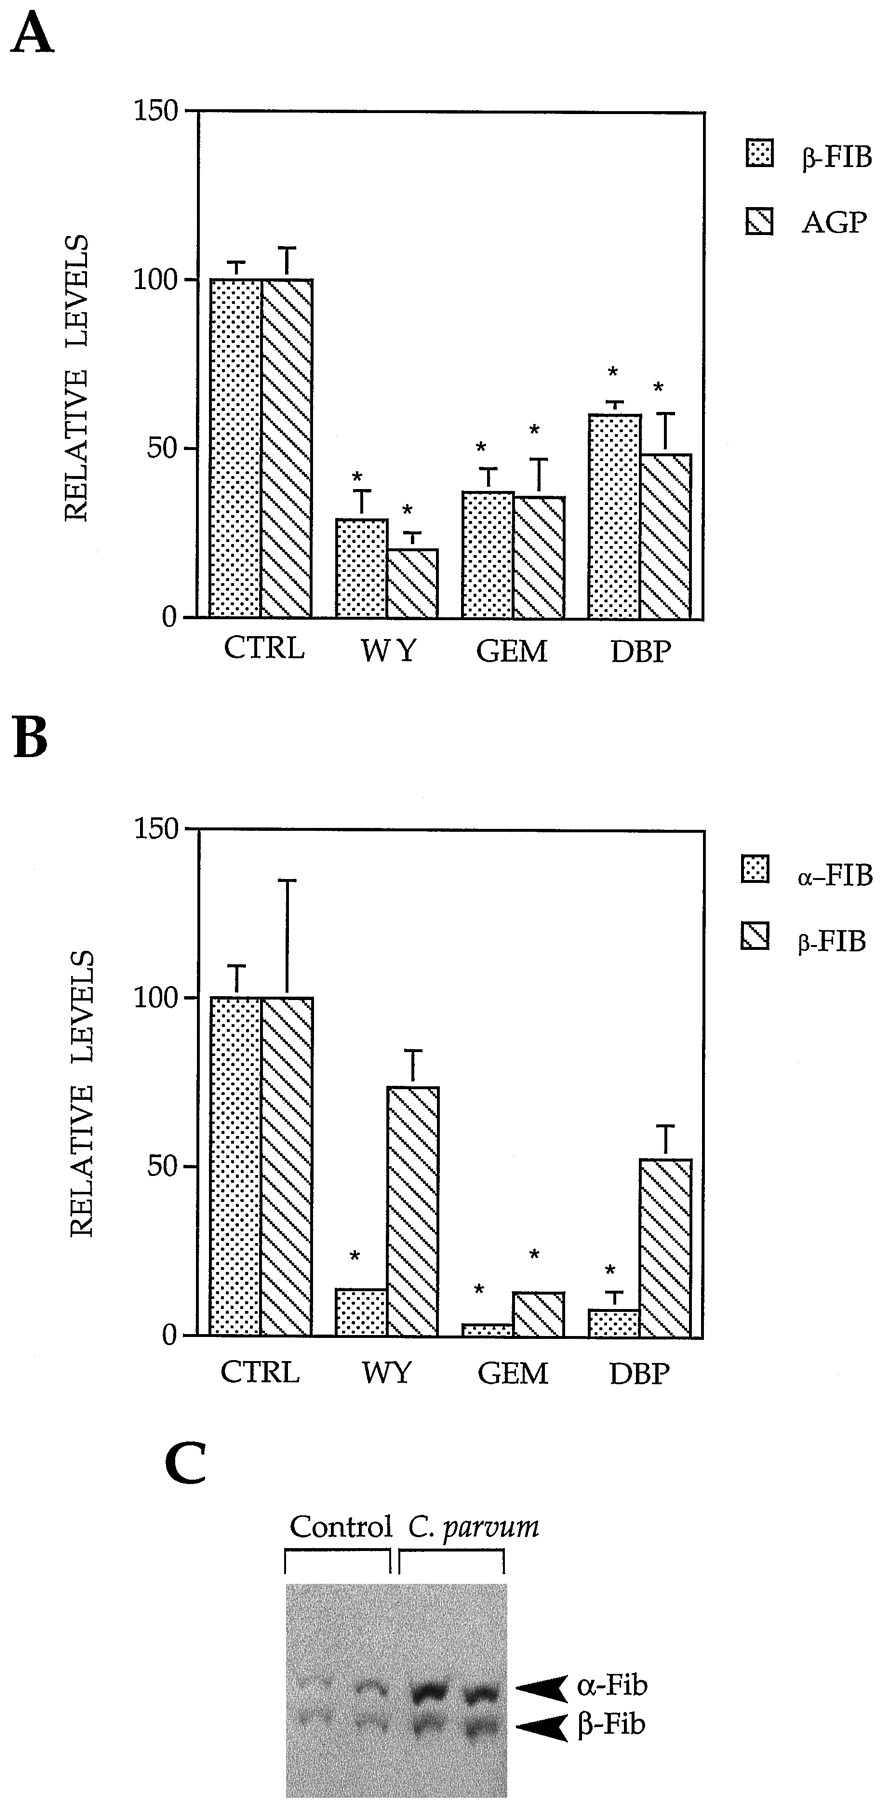
Down-regulation of positive acute-phase response genes by PPC. A, Quantification of mRNA expression of β-Fib and AGP after PPC exposure. Male F344 rats were treated as in Fig. 1, and their RNA was analyzed for expression of β-Fib, AGP, and β-actin. The autoradiograms were densitometrically scanned, and expression was normalized to β-actin expression. Histograms, mean expression (mean ± standard deviation) from two different samples. ∗, Significantly different from control (p < 0.05). B, Analysis of α- and β-Fib protein expression after PPC exposure. Whole-cell liver extracts from male F344 rats treated as in Fig. 1 were separated by 12.5% SDS-PAGE, transferred to nitrocellulose, and probed with antibodies against Fib. Protein expression was quantified as detailed in Fig. 1D. C, Increased expression of α- and β-Fib after C.parvum treatment. Male rats were treated withC. parvum for 7 days, and whole-cell liver extracts were analyzed for Fib protein.
In parallel with the decreases in β-Fib mRNA levels, the levels of the Fib protein decreased after PPC exposure in male rat livers (Fig.2B). Polyclonal antibodies to rat Fib raised to the three fibrinogen polypeptides α, β, and γ reacted with two proteins in control rat liver of ∼66 and ∼56 kDa, corresponding to the α and β forms of fibrinogen, respectively. The expression of α-Fib was almost completely abolished by treatment with all of the PPC (13%, 3%, and 8% of control for WY, GEM, and DBP, respectively). The expression of β-Fib was decreased after treatment with GEM (13% of control). β-Fib was not significantly decreased by WY or DBP. Similar changes in α- or β-Fib were observed in the livers of female rats treated identically with PPCs (data not shown).
To compare with the effects of PPC treatment, we examined the expression of Fib proteins in rats treated with C.parvum as described above. In contrast to the down-regulation of α- and β-Fib observed after PPC treatment,C. parvum treatment resulted in the elevation of both α- and β-Fib proteins (Fig. 2C). Thus, PPCs regulate the expression of the positive acute-phase genes by a mechanism different from the one induced by inflammation.
Expression of α2u, P450 2C11, and β-Fib after different times and doses of exposure to PPC.
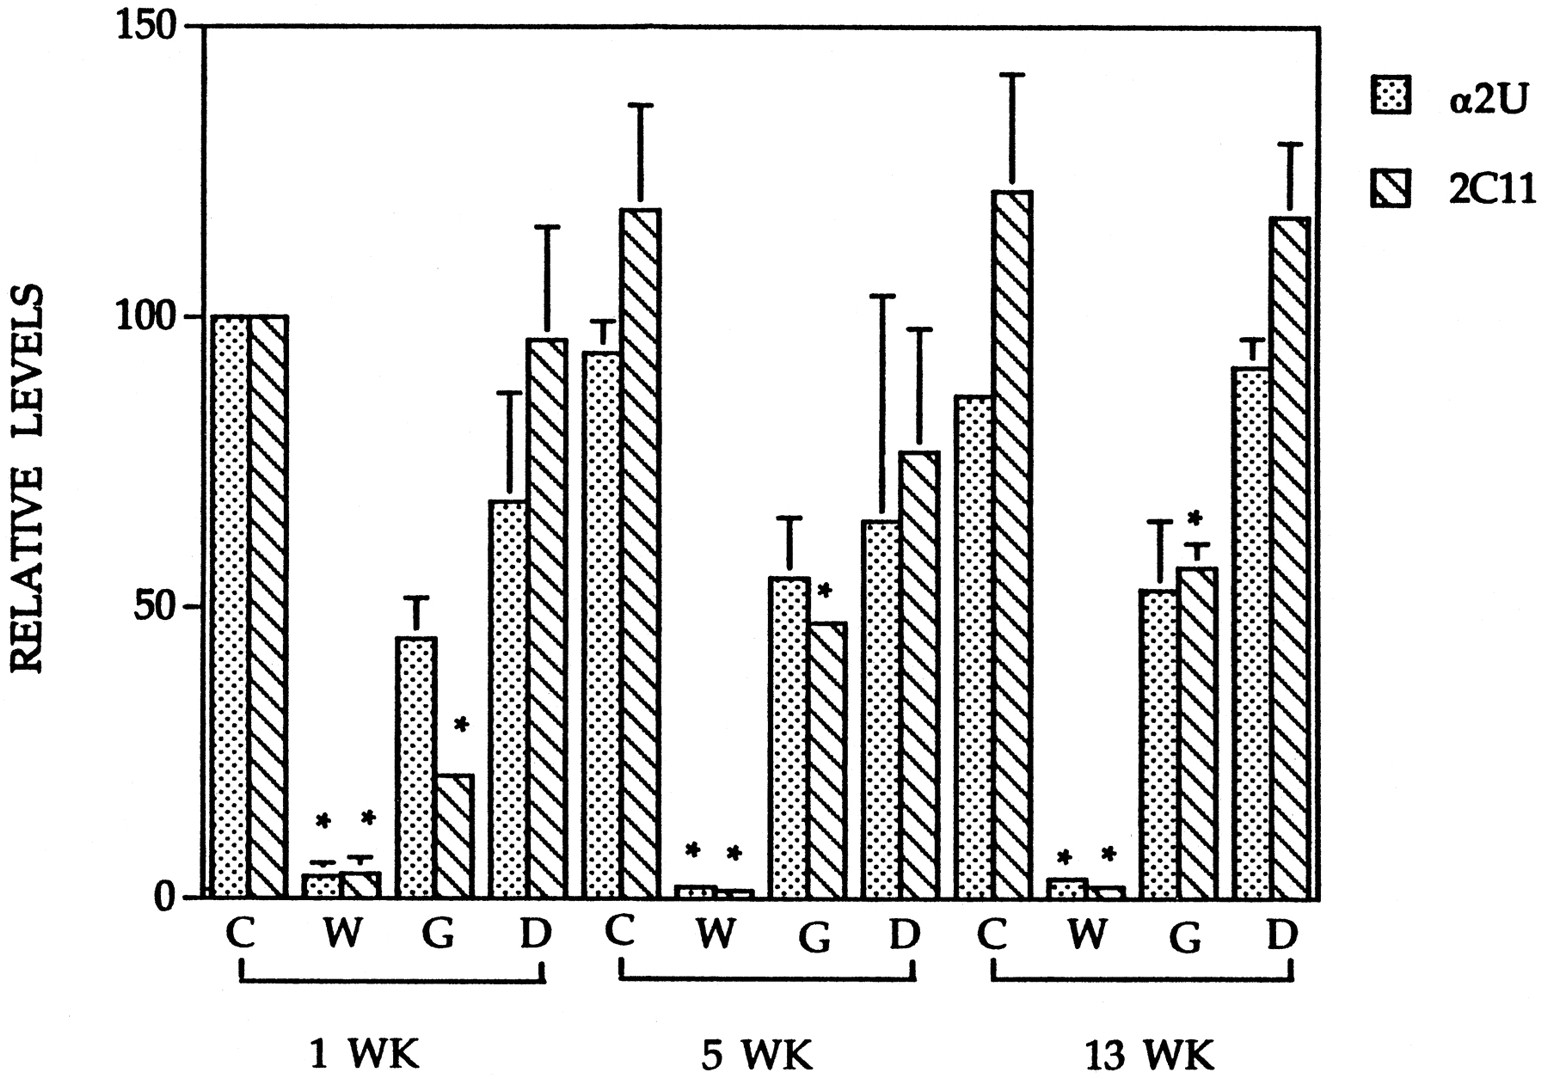
To determine whether protein expression is coordinately regulated by PPCs, we examined the pattern of expression of the two male-specific proteins α2u and P450 2C11 at 1, 5, and 13 weeks after initiating the feeding study using the same dietary concentrations of WY, GEM, and DBP used in Table 1. In this and the dose-response study discussed below, we used male Sprague-Dawley rats. No gross strain-specific differences in expression of α2u, P450 2C11, and ACO proteins between the Fisher and Sprague-Dawley rats after exposure to the three PPC were evident (data not shown). No differences in the expression of α2u and P450 2C11 exist over the time of the experiment in the untreated control animals (Fig.3). The kinetics of the decreases for α2u and P450 2C11 by all three PPC were very similar. Both α2u and P450 2C11 protein levels were severely decreased after 1, 5, and 13 weeks of exposure to WY (Fig. 3). After GEM exposure, maximum decreases in P450 2C11 expression occurred at 1 week. Expression of P450 2C11 was also decreased at 5 and 13 weeks, although the decreases were less than those after a 1-week exposure. The α2u expression was not significantly changed after exposure to GEM at all time points. After DBP exposure, neither α2u nor P450 2C11 expression changed at any of the time points.

Time course of α2u and P450 2C11 protein level changes. Whole-cell liver extracts from male Sprague-Dawley rats fed a control diet (Control) or a diet containing WY (500 ppm), GEM (8,000 ppm), or DBP (20,000 ppm) for 1, 5, or 13 weeks were separated by 12.5% or 15% SDS-PAGE, transferred to nitrocellulose, and probed with antibodies to α2u or P450 2C11. Expression was quantified as in Fig. 1D.
The response of α2u and P450 2C11 to different dietary concentrations of WY, GEM, and DBP after 5 weeks of exposure also was assessed in livers of male Sprague-Dawley rats. Fig.4 shows that decreases of both proteins were observed at 5 ppm WY, the lowest dose tested. The levels of the proteins continued to decrease with increasing doses of WY. Parallel decreases in the two proteins occurred after GEM and DBP exposure. Changes due to GEM exposure were observed at doses as low as 8000 ppm, with maximal effects at 16,000 ppm. Only at the highest dose of DBP (20,000 ppm) were decreases observed for P450 2C11 but not for α2u.

Alteration of α2u and P450 2C11 protein levels after different dietary concentrations of PPC. Whole-cell liver extracts from male Sprague-Dawley rats fed a control diet or a diet containing five different concentrations of WY, GEM, or DBP for 5 weeks were separated by 12.5% (P450 2C11) or 15% (α2u) SDS-PAGE, transferred to nitrocellulose, and probed with antibodies to α2u or P450 2C11. Expression was quantified as in Fig. 1D. Concentrations used in the study: C0, control; WY-C1, 5 ppm; WY-C2, 10 ppm; WY-C3, 50 ppm; WY-C4, 100 ppm; WY-C5, 500 ppm; GEM-C1, 10 ppm; GEM-C2, 100 ppm; GEM-C3, 1,000 ppm; GEM-C4, 8,000 ppm; GEM-C5, 16,000 ppm; DBP-C1, 1,500 ppm; DBP-C2, 2,500 ppm; DBP-C3, 5,000 ppm; DBP-C4, 10,000 ppm; DBP-C5, 20,000 ppm.
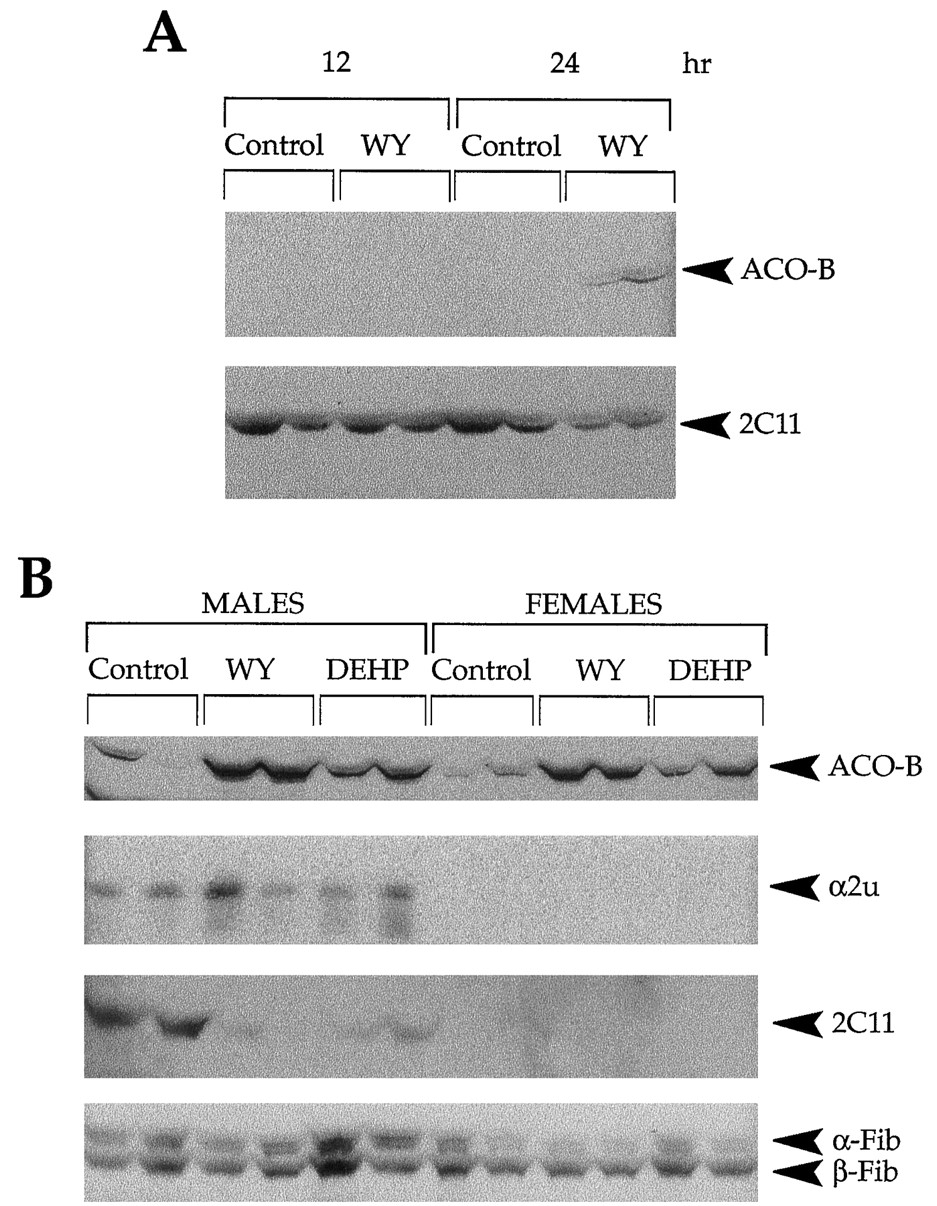
To determine how rapidly protein expression changes after exposure, α2u, P450 2C11, and β-Fib expressions were compared with that of ACO, which is induced early by PPARα activation after exposures to PPC. The expression first was examined at up to 24 hr after a single gavage dose of WY. Expression of P450 2C11 protein was decreased only after 24 hr of exposure (Fig. 5A) (63% of control; p < 0.05). No consistent alterations in protein abundance for α2u and α- or β-Fib could be detected at any of the time points (data not shown). Increases in the three polypeptide components of ACO, ACO-A (72 kDa) (data not shown), ACO-B (52 kDa) (Fig. 5A), and ACO-C (22 kDa) (data not shown) could be detected at 24 hr but not earlier.

Early changes in P450 2C11 protein expression after PPC exposure. A, Decreased expression of P450 2C11 protein after a single gavage dose of WY. Whole-cell extracts from male Fisher F344 rats treated with a single gavage dose of WY (50 mg/kg) or control methyl cellulose vehicle for 12 and 24 hr were size-separated on 12.5% SDS-PAGE, transferred to nitrocellulose, and probed with antibodies against ACO or P450 2C11. B, Down-regulation of P450 2C11 protein expression after 3-day exposure to WY or DEHP. Whole-cell liver extracts from male and female Fisher F344 rats given a gavage dose of WY (50 mg/kg), DEHP (2000 mg/kg), or methyl cellulose (Control) each day for 3 days were separated by 12.5% or 15% SDS-PAGE, transferred to nitrocellulose, and probed with antibodies to ACO, α2u, P450 2C11, or Fib.
α2u, P450 2C11, and Fib protein expressions also were examined in the livers of male and female rats given a gavage dose of WY or DEHP each day for 3 days. As shown in Fig. 5B, exposure to either PPC resulted in increased abundance of ACO protein, with WY eliciting a greater effect. Exposure to either WY or DEHP had no effect on either α2u or α- and β-Fib protein expression in livers from male or female rats. In contrast, the P450 2C11 protein was severely decreased by exposure to either WY (9% of control; p < 0.05) or DEHP (24% of control; p < 0.05).
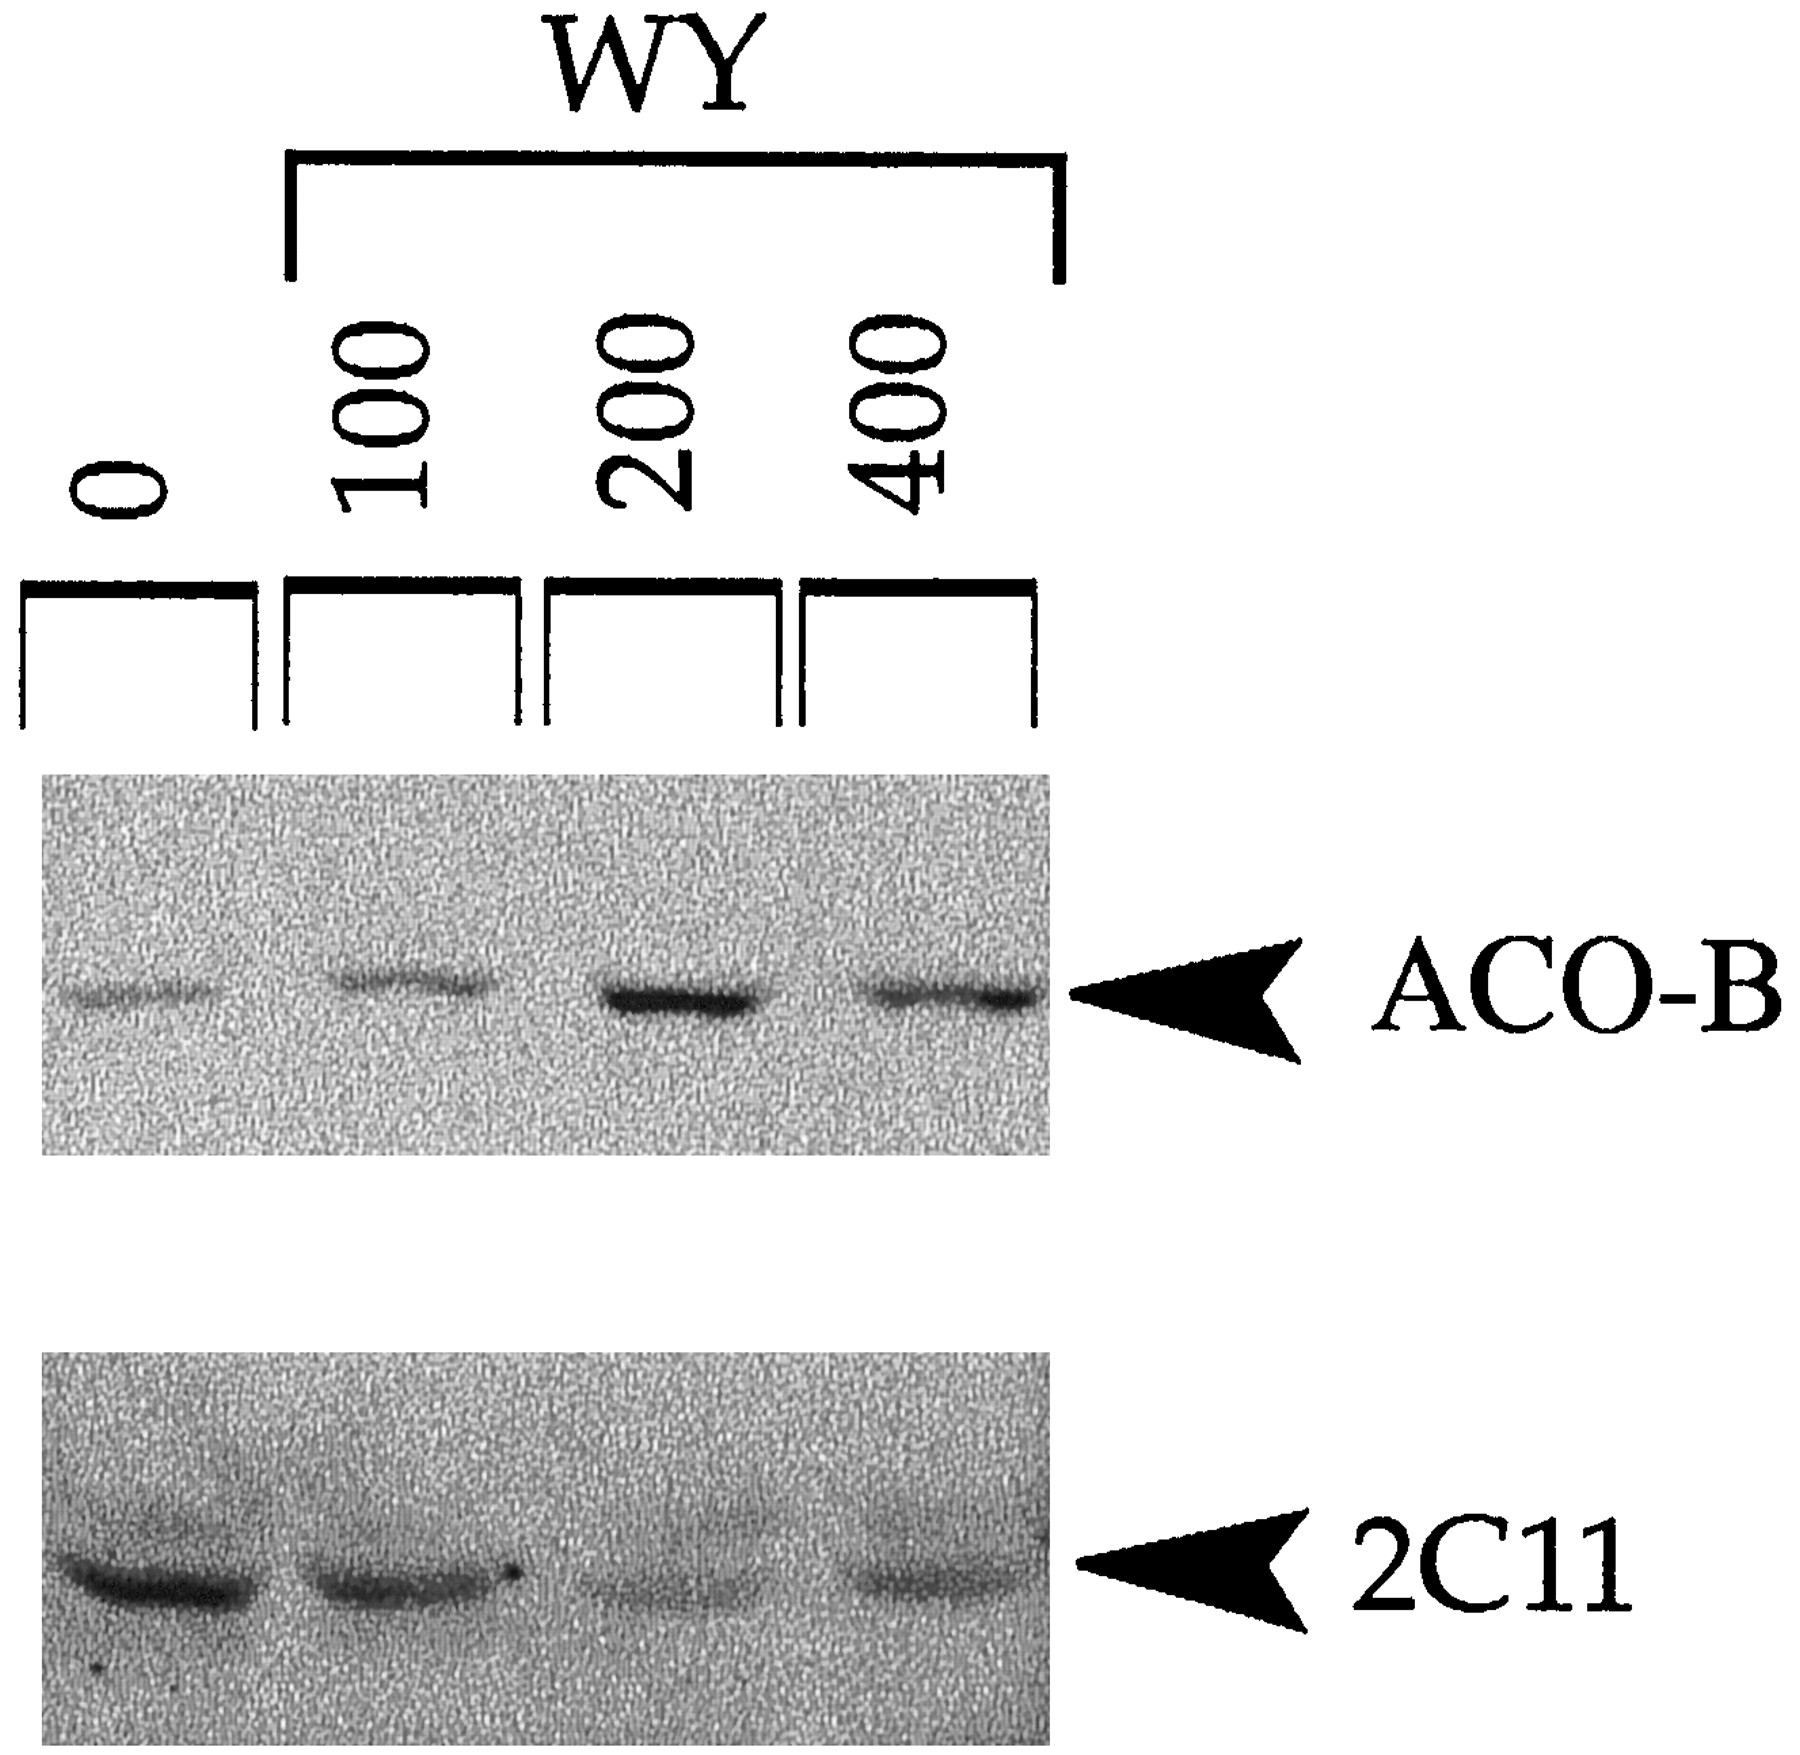
To determine whether the PPC-induced down-regulation of expression could be reconstituted in vitro, we examined the expression of α2u, P450 2C11, and Fib in rat primary hepatocytes after a 48-hr treatment of WY. As shown in Fig. 6, expression of ACO protein was increased after doses of 100, 200, and 400 μm WY. P450 2C11 exhibited decreased expression after WY exposure in a dose-dependent manner with a maximal decrease at 200 μm WY. α- or β-Fib and α2u did not exhibit changes in protein expression under the conditions of the experiment, possibly because of the greater stability of these proteins (data not shown). These data indicate that PPCs act directly on hepatocytes to regulate expression of P450 2C11.

Down-regulation of P450 2C11 after WY treatment in cultured rat primary hepatocytes. Primary rat hepatocytes were prepared as described in the text and treated with the indicated concentrations of WY or DMSO (0) for 48 hr. Cell extracts were used to examine protein expression by Western analysis.
In summary, 1) P450 2C11 and ACO protein levels were altered within 24 hr of PPC exposure, 2) α2u and Fib protein levels did not exhibit changes after 3 days of exposure, 3) α2u and P450 2C11 proteins exhibit similar kinetics of regulation by PPC after 1 week or more of exposure, and 4) WY acted directly on hepatocytes to down-regulate P450 2C11.
Requirement for PPARα in PPC-regulation of a mouse homologue of α2u and positive acute-phase gene expression.
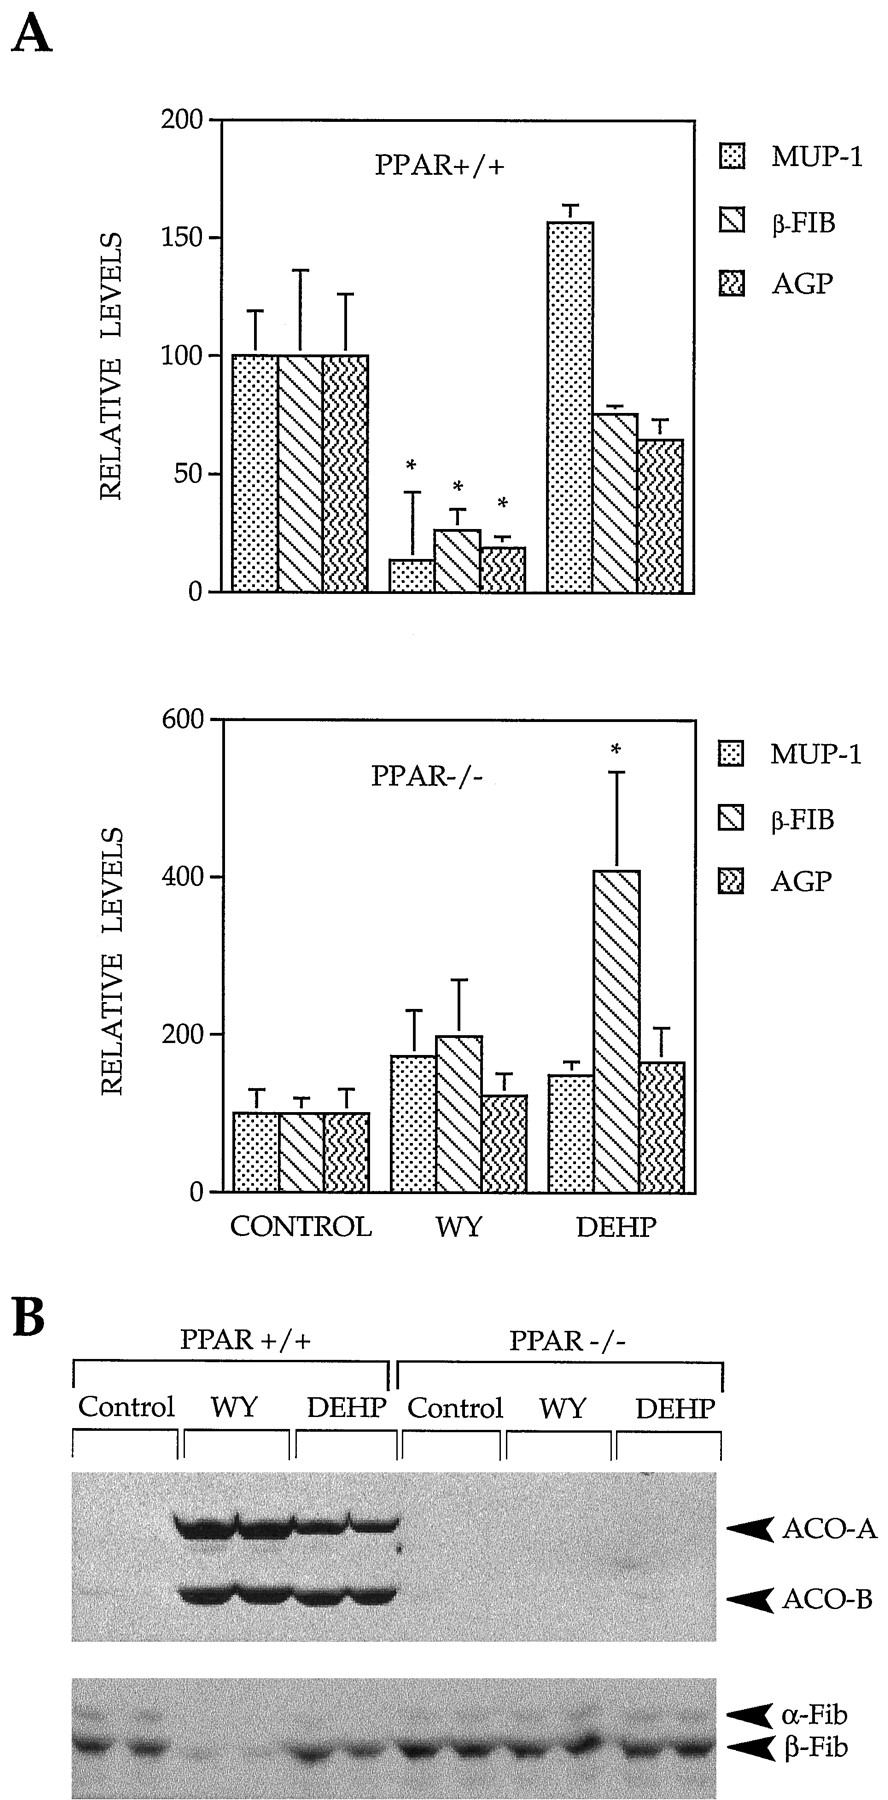
Because PPARα has been shown to mediate many PPC-inducible responses in the liver, we examined the dependence of PPC-induced decreases in α2u and positive acute-phase gene regulation on PPARα expression. We fed wild-type mice and mice that lacked a functional form of PPARα (PPARα-null mice; Lee et al., 1995) a control diet or one that contained WY (0.1%) or DEHP (0.6%) for 3 weeks. The RNA isolated from the mouse livers was used to assess gene expression. We first examined the expression of a mouse homologue of rat α2u. Mice possess a family of genes closely related to the rat α2u that are called MUPs. These proteins share conserved features of regulation, including regulation by GH, testosterone, estrogen, and inflammatory cytokines (Johnsonet al., 1995 and references therein). After feeding WY or DEHP, ACO mRNA levels rose dramatically in wild-type but not PPARα-null mice as expected (data not shown). When wild-type mice were fed WY, there was a decrease in the expression of MUP-I mRNA (14% of control) (Fig. 7A). In contrast, treatment with DEHP did not result in significant changes in the levels of MUP-I RNA. Treatment of PPARα-null mice with WY or DEHP resulted in no changes in MUP-I expression. Similarly, β-Fib and AGP mRNAs decreased after WY (26% and 19% of control, respectively), but not DEHP, feeding in wild-type mice. In PPARα-null mice, WY exposure did not alter the expression of β-Fib or AGP. DEHP exposure increased β-Fib levels (∼4-fold), whereas AGP levels did not change.

Down-regulation of acute-phase response gene expression by WY is dependent on PPARα. Wild-type SV129 mice (+/+) or SV129 mice that lack PPARα (−/−) were fed a control diet (Control) or a diet containing WY (0.1%) or DEHP (0.6%) for 3 weeks. Total RNA or total protein isolated from the livers were used to analyze expression of the indicated mRNAs by Northern blot (A) or the indicated proteins by Western blot (B). The Northern autoradiograms were densitometrically scanned, and expression was normalized to β-actin expression. Histograms, mean expression (mean ± standard deviation) from three different samples. ∗, Significantly different from control (p <0.05). Expression of Fib proteins was quantified as in Fig. 1D.
We also examined the protein levels of ACO and Fib in the same livers of mice. ACO protein levels increased dramatically in wild-type, but not PPARα-null, mice after exposure to WY or DEHP, as expected (Fig.7B). The levels of α- and β-Fib proteins decreased in wild-type (9% and 10% of control, respectively; p < 0.05), but not PPARα-null, mice after WY feeding. There was little, if any, decrease in Fib protein levels after exposure to DEHP in either strain of mice. These data demonstrate that PPARα is required for WY to down-regulate MUP-I and positive acute-phase gene expression.
Discussion
PPCs induce a broad spectrum of responses in the rodent liver, including peroxisome proliferation, cell proliferation, decreases in apoptosis, alteration of estradiol levels, increases in the metabolism of fatty acids and eicosanoids, and hepatocarcinogenesis (reviewed inLapinskas and Corton, 1998). Most, if not all, of the effects of PPC exposure in the liver depend on the expression of PPARα (Lee et al., 1995), the receptor for PPC, unsaturated long-chain fatty acids, and certain eicosanoids. Interaction with these ligands results in heterodimerization with the receptor for 9-cis retinoic acid RXR. The PPAR-RXR heterodimer binds to PPRE and regulates the expression of many genes involved in fatty acid metabolism, including the fatty acid β-oxidation genes and members of the P450 4A group of enzymes. In an effort to clone genes that are important in mediating the diverse effects of PPC, we (Corton and Gustafsson, 1997) and others (Alvares et al., 1996) identified the male-specific pheromone carrier α2 urinary globulin as a down-regulated gene. This gene is under positive control by the male-specific GH secretory pattern and is negatively regulated under conditions of inflammation (Roy et al., 1983; Birch and Schreiber, 1986). To determine whether other genes were coordinately regulated after PPC treatment, we examined the expression of genes that are regulated by sex-specific GH secretory pattern or that are induced under inflammatory conditions.
We show in this study that in addition to the P4504A family, PPC regulate members of the P450 2C family important in the metabolism of steroids. In contrast to the inducibility ofCYP4A genes by PPCs, the male-specific CYP2C11and the female-specific CYP2C12 genes were down-regulated by WY and GEM. These CYP2C genes encode constitutive hepatic P450 enzymes that are regulated at the transcriptional level by GH (Legraverend et al., 1992; Waxman, 1992). In our experiments, (1) P450 2C11 was down-regulated by WY, GEM, and DBP, and P450 2C12 was down-regulated by WY and GEM; (2) the levels of P450 2C11 and α2u proteins were coordinately regulated between 1 to 13 weeks of exposure to five different doses of WY or GEM; (3) under acute exposure conditions, the protein products of P450 2C11 and ACO, a PPARα-regulated gene, were altered within 24 hr of a gavage dose of WY, indicating that PPARα is important in the regulation of P450 2C11; and (4) not all members of the P450 2C family were coordinately down-regulated because the male-specific CYP2C13 gene was not down-regulated by PPC treatment. In addition to the P4504A family members whose induction of expression is normally associated with PPC exposure, our results demonstrated that the P450 2C family, including 2C7 (Corton JC, Fan L-Q, and Brown S, unpublished observations), 2C11, and 2C12, are coordinately down-regulated by exposure to some PPCs. Thus, in addition to changes in the ω-oxidation of fatty acids and eicosanoids catalyzed by P450 4A members, exposure to certain PPCs would be expected to lead to changes in steroid metabolism.
Changes in estradiol metabolism have been observed in male and female rats after PPC exposure. Increases in estradiol levels in male rats after exposure may be partly attributed to decreases in P450 2C11. In male rats, exposure to the PPC ammonium perfluorooctanoate, DEHP, clofibrate, and WY (Eagon et al., 1994; Hurtt et al., 1997, and references therein) have been shown to increase serum E2 levels. These increases have been hypothesized to contribute to Leydig cell hyperplasia and subsequent Leydig cell adenomas after long term exposure to PPC (Liu et al., 1996). The experiments presented here indicate that the reactions catalyzed by P450 2C11, hydroxylations at the 2 and 16α positions of E2 (summarized in Martucci and Fishman, 1993), would decrease in parallel with the down-regulation in P450 2C11. A decrease in the activity of 2α-hydroxylation of E2 and male E2 binding protein has been observed after treatment with DEHP (Eagon et al., 1994). Elevation in the activity of aromatase observed in the male rat liver after treatment with ammonium perfluorooctanoate (Liuet al., 1996) could also contribute to increases in E2. Thus, it is possible that PPC exposure leads to modulation of estrogen receptor activation through alteration of E2 levels.
Treatment of male rats with some PPCs also leads to changes in testosterone metabolism, which may be attributed to decreased levels of P450 2C11 protein. Decreases in the appearance of the 2α and 16α metabolites of testosterone, the products of P450 2C11-catalyzed hydroxylation of testosterone (reviewed in Waxman, 1991), were observed in microsomes from male rats treated for 2 weeks with clofibrate or DEHP (Lake et al., 1984). Only minor increases in 6β-testosterone were observed after PPC exposure (Lake et al., 1984), consistent with the minor changes we observed in the levels of P450 2C13, a 6β-testosterone hydroxylase (Waxman, 1991). With a decrease in P450 2C11 and associated testosterone metabolism in the male liver, the serum testosterone levels would be predicted to rise. In experiments that examined serum levels of testosterone, no changes were observed after treatment by PPC (Biegel et al., 1992). Even though PPC treatment can lead to decreases in testosterone hydroxylation, the lack of increase in serum testosterone may be partly offset by increases in testosterone conversion to estradiol by aromatase after PPC treatment (Biegel et al., 1995).
In addition to the CYP2C genes, we show that PPC exposure leads to down-regulation of two acute-phase response genes. The term acute-phase response refers to changes in the concentrations of a large number of plasma proteins reflecting reorchestration of the pattern of gene expression of secretory proteins in hepatocytes after a wide variety of adverse stimuli, including bacterial and viral infections, neoplasms, burns, and tissue infarction (reviewed in Moshage, 1997). These proteins are thought to increase the chances of survival of the patient and are divided into two groups: the positive acute-phase proteins such as β-Fib and AGP and negative acute-phase proteins such as transferrin and transthyretin. In our experiments, we demonstrated that β-Fib and AGP are down-regulated by PPC exposure. Decreases in expression of both β-Fib mRNA and AGP mRNA were observed at 13 weeks of exposure. Although WY, GEM, and DBP at the doses used seemed to be effective at down-regulating mRNA levels, β-Fib protein levels were decreased by GEM but not significantly by DBP or WY. This indicates that PPC may differentially affect post-transcriptional processes important in β-Fib expression. Differential post-transcriptional control by different PPC also has been shown to be important for expression of 17β-hydroxysteroid dehydrogenase IV (Corton et al., 1996). As discussed below, the down-regulation of β-Fib and AGP is mediated by PPARα because down-regulation by WY is no longer observed in mice that lack a functional PPARα. Our results indicate that through PPARα, PPCs coordinately down-regulate many acute-phase response genes, including the positive acute-phase response genes β-Fib and AGP discussed here, as well as additional genes, α1-antitrypsin, and ceruloplasmin (Anderson SA, Cattley RC, and Corton JC, manuscript submitted for publication). To our knowledge, our results represent the first example of down-regulation of basal expression of positive acute-phase response genes by pharmacological agents.
Fibrinogen has been recognized as a primary risk factor for the development of acute cardiovascular disease (Stone and Thorp, 1984). Fibrinogen, encoded by three separate genes in humans and rodents (α, β, and γ), is cleaved during clot formation by thrombin, yielding monomers that polymerize into fibrin and can act as a cofactor in platelet aggregation. Fibrinogen can contribute to cardiovascular disease through its promotion of red cell and platelet aggregation, increased rheologic stasis, and amplification of the coagulative cascade at higher concentrations. The down-regulation of β-Fib mRNA and α- and β-Fib proteins by PPCs that we observe may be the molecular basis for a number of reports that demonstrate a linkage between PPC exposure and changes in coagulation or platelet aggregation. First, in patients on hypolipidemic PPC therapy, total fibrinogen levels have been shown to be reduced (Monk and Todd, 1987, and references therein). Second, clofibrate enhanced anticoagulation when administered in conjunction with coumarins, requiring some reduction in the dosage of the anticoagulant, and a similar effect has been reported with benzafibrate in hyperlipoproteinemic patients requiring anticoagulant therapy (Vinazzer and Farine, 1983, and references therein). Last, rats treated chronically with WY revealed hemorrhages at several sites and prolonged prothrombin and thrombin clot times indicative of defects in coagulation (Hurtt et al., 1997). The use of hypolipidemic PPCs that decrease circulating fibrinogen, as well as cholesterol and saturated fatty acids, should provide maximum benefit to patients at risk of heart disease by depressing the processes in which fibrinogen is involved, including platelet aggregation, coagulation cascade, and blood viscosity.
PPARα has been shown recently to be important in down-regulating the inflammatory response. A major mediator of the inflammatory response, leukotriene B4, was shown to bind and activate PPARα. Mice that lack PPARα have a prolonged inflammatory response time after exposure to inflammatory mediators compared with wild-type mice (Devchand et al., 1996). Some nonsteroidal anti-inflammatory drugs, such as fenoprofen, ibuprofen, and indomethacin, also bind and activate PPARα (Lehmann et al., 1997). These results indicate that PPARα is a negative regulator of the inflammatory response, possibly by increasing the inactivation of lipid mediators of inflammation through fatty acid β- and ω-oxidation. Our results support this hypothesis in that classic acute-phase response genes are down-regulated by PPC in the liver through a PPARα-dependent mechanism. We predict that PPARα-deficient mice are hypersensitive to inflammatory stimuli that affect expression of these positive acute-phase response genes in the liver.
How does PPC exposure lead to down-regulation of CYP2C11 andCYP2C12 gene expression? Expression of these and other members of the CYP2C family seem to be dependent on the sex-specific GH secretory pattern. It is possible, then, that exposure to PPC leads to changes in GH secretion and to CYP2Cexpression. The pattern of changes in CYP2C11, andCYP2C12 expression by at least WY exposure has some of the characteristics of expression in rats that have undergone a hypophysectomy (i.e., severe drops in P450 2C11 levels in males and severe drops in P450 2C12 levels in females). Feminization of the GH secretory pattern by estradiol treatment of male rats similar to the increase in circulating estradiol levels observed after PPC treatment (discussed above) has been shown to lead to decreases inCYP2C11 expression (Mode et al., 1982). Despite these correlations, two observations argue that disruption of GH signaling is not the primary determinant of PPC-induced down-regulation of α2u and CYP2C family members. First, we can demonstrate down-regulation by WY of P450 2C11 expression in primary hepatocytes from male rats, indicating that the effect of PPC on expression is direct and is not mediated in vivo indirectly by perturbation of GH secretion. Second, the lack of changes in expression of CYP2C13 is not consistent with PPC-induced effects on GH secretory pattern. Hypophysectomy leads to a decrease in the expression of CYP2C13 in male rats to ∼70% of wild-type levels and an increase in expression in hypophysectomized female rats to ∼50% of wild-type male rats (Legraverend et al., 1992). After PPC exposure, CYP2C13 levels did not decrease in males, nor were there significant increases in females. The evidence indicates that WY is down-regulating expression of CYP2C11 andCYP2C12 by a mechanism that does not involve perturbation of GH signaling.
Our data and those of others indicate that exposure to some PPC leads to coordinate down-regulation of a number of genes predominately expressed in the liver. The down-regulated genes includeCYP2C11, CYP2C12, β-Fib,AGP (our experiments), α2u,transferrin, apolipoprotein cIII,apolipoprotein E, transthyretin, andBiP/GRP78 (summarized in Lapinskas and Corton, 1998) and a number of unique genes with no homology to gene bank databases (Corton and Gustafsson, 1997). There are a number of examples of members of the nuclear receptor superfamily down-regulating PPC-activated genes through either competition with PPAR for limited amounts of RXR heterodimerization partner (e.g., thyroid hormone receptor) or competition with PPAR for binding to PPRE (e.g., COUP-TF) (reviewed inLapinskas and Corton, 1998). In these cases, however, PPC-induced but not basal gene expression is down-regulated, making it less likely that these mechanisms play an important role in down-regulation of liver-specific gene expression by PPC. The widespread effects of PPC exposure on hepatocyte gene regulation indicate that down-regulation could result from PPARα-dependent interference in liver-specific transcription factors that control the liver phenotype. Activated PPAR has been shown to disrupt and down-regulate HNF-4-mediated regulation of apolipoprotein cIII (Hertz et al., 1995) andtransferrin (Hertz et al., 1996) genes by interfering with the ability of HNF-4 to activate at a PPRE-like element in the promoter regions of these genes as well as theHNF-4 gene itself. Although the down-regulation of HNF-4 expression or activity by PPAR may be important for expression of some liver-specific genes, the ability of HNF-4 to positively regulate expression of P450 2C family members does not correlate with their down-regulation by PPC. Overexpression of HNF-4 protein had little effect on the expression of CYP2C11 or CYP2C12genes but resulted in positive regulation of the expression ofCYP2C13 (Ström et al., 1995), a gene not regulated by PPC. It is likely that PPCs down-regulate liver-specific gene expression through multiple pathways.
In summary, the current study demonstrates that PPC exposure results in down-regulation of P450 2C family members as well as acute-phase response genes in a manner that requires PPARα. Exposure to some PPCs is likely to alter the metabolism of steroids and DNA-damaging agents that are substrates for P450 2C members.
Acknowledgments
We thank Cyndi Swanson for technical support, Dr. Frank Gonzalez for SV129 wild-type and PPARα-null mice, Drs. Stefan Alexson and Otto Neuhaus for antibodies, Dr. Hilde Nebb-Sörensen and Dr. Gerald Fuller for plasmids, Dr. Daniel Marsman (Procter & Gamble, Cincinnati, OH) for NTP tissues and access to unpublished data, and Drs. Greg Kedderis and Susan Borghoff for reviewing the manuscript. We also thank Dr. Barbara Kuyper for editorial assistance, Sadie Leak and Linda Smith for preparation of the manuscript, and Vicky Wong for artwork.
Footnotes
- Received April 27, 1998.
- Accepted May 28, 1998.
-
Send reprint requests to: Dr. Chris Corton, CIIT, P.O. Box 12137, 6 Davis Drive, Research Triangle Park, NC 27709. E-mail:corton{at}ciit.org
-
↵1 Current affiliation: Facultad cle Ciencias Experimentales y Técnicas, Universidad San Pablo CEU, Urbanizaci-n Monteprı́ncipe 28668 Madrid, Spain.
-
This work was supported in part by a grant from the Swedish Cancer Society.
Abbreviations
- PPC
- peroxisome proliferator chemical
- AGP
- α1-acid glycoprotein
- α2u
- α2urinary-globulin
- ACO
- acyl-coenzyme A oxidase
- DBP
- di-n-butyl phthalate
- DEHP
- di-(2-ethylhexyl)phthalate
- Fib
- fibrinogen
- GEM
- gemfibrozil
- GH
- growth hormone
- HNF
- hepatocyte nuclear factor
- MUP
- major urinary protein
- P450
- cytochrome P450
- PPAR
- peroxisome proliferator-activated receptor
- PPRE
- peroxisome proliferator response element
- SDS-PAGE
- sodium dodecyl sulfate-polyacrylamide gel electrophoresis
- tNA
- total nucleic acids
- WY
- WY-14,643
- The American Society for Pharmacology and Experimental Therapeutics


