


Abstract
Microsomal cytochrome P-450 1A (CYP1A) in a vertebrate model (the teleost fish scup) is inactivated by the aryl hydrocarbon receptor agonist 3,3′,4,4′-tetrachlorobiphenyl (TCB). Here, the mechanism of CYP1A inactivation and its relationship to reactive oxygen species (ROS) formation were examined by using liver microsomes from scup and rat and expressed human CYP1As. In vitro inactivation of scup CYP1A activity 7-ethoxyresorufin O-deethylation by TCB was time dependent, NADPH dependent, oxygen dependent, and irreversible. TCB increased microsomal NADPH oxidation rates, and CYP1A inactivation was lessened by adding cytochrome c. CYP1A inactivation was accompanied by loss of spectral P-450, a variable loss of heme and a variable appearance of P-420. Rates of scup liver microsomal metabolism of TCB were < 0.5 pmol/min/mg, 25-fold less than the rate of P-450 loss. Non-heme iron chelators, antioxidant enzymes, and ROS scavengers had no influence on inactivation. Inactivation was accelerated by H2O2 and azide but not by hydroxylamine or aminotriazole. TCB also inactivated rat liver microsomal CYP1A, apparently CYP1A1. Adding TCB to scup or rat liver microsomes containing induced levels of CYP1A, but not control microsomes, stimulated formation of ROS; formation rates correlated with native CYP1A1 content. TCB stimulated ROS formation by baculovirus-expressed human CYP1A1 but not CYP1A2. The results indicate that TCB uncouples the catalytic cycle of CYP1A, ostensibly CYP1A1, resulting in formation of ROS within the active site. These ROS may inactivate CYP1A or escape from the enzyme. ROS formed by CYP1A1 may contribute to the toxicity of planar halogenated aromatic hydrocarbons.
2,3,7,8-Tetrachlorodibenzo-p-dioxin (TCDD), non-ortho polychlorinated biphenyls (PCBs), and other planar halogenated aromatic hydrocarbons (pHAHs) exert systemic toxicity in laboratory animals, wildlife species, and, ostensibly, humans, through activation of the aryl hydrocarbon receptor (AhR), a basic helix-loop-helix/Per-Arnt-Sim transcription factor (Hankinson, 1995). AhR-null mice are resistant to TCDD toxicity, indicating that toxicity of pHAHs is AhR-dependent (Fernandez-Salguero et al., 1996). AhR activation leads to isozyme-specific induction of drug-metabolizing enzymes [cytochrome P-450 1A1 (CYP1A1), CYP1A2, CYP1B1, glutathione S-transferase, and UDP-glucuronosyltransferase] and alters the expression of genes involved in cell growth control (e.g., transforming growth factor-α and -β,B-Jun, and Jun-D; Hankinson, 1995), yet the mechanisms of pHAH toxicity still are unclear. The occurrence of oxidative damage in animals or cells exposed to pHAHs (Stohs et al., 1990; Toborek et al., 1995; Park et al., 1996) suggests that some toxic responses to AhR agonists might involve reactive oxygen species (ROS). Oxidative damage and CYP1A1 induction both occur in cells exposed to TCDD or PCB congeners, suggesting that this enzyme could be involved in that damage.
An NADPH-dependent generation of ROS (O2⨪, H2O2, and/or OH⋅) by animal liver microsomes has been known for 40 years (Gillette et al., 1957) and has been linked to CYP (Bondy and Naderi, 1994). Uncoupling of electron transfer and oxygen reduction from monooxygenation by CYP can result in the release of O2⨪ and H2O2; CYP forms including CYP2E1, CYP2B4, and CYP3A have been shown to release ROS, usually on substrate binding, which accelerates electron transfer to CYP heme (Kuthan and Ullrich, 1982; Ekstrom et al., 1986; Ahmed et al., 1995). A recent report showed an NADPH-stimulated release of ROS by human CYP1As (Puntarulo and Cederbaum, 1998). In addition, stimulation of microsomal oxidation of bilirubin by non-ortho-PCBs, but notortho-PCBs, was suggested to result from the release of ROS by rat CYP1A1 (DeMatteis et al., 1991). However, there has been no direct demonstration that pHAHs can stimulate ROS production by CYP1As. If pHAHs do uncouple CYP1A1, stimulating the release of ROS, this could be involved in the toxic effects of pHAHs, including TCDD.
In addition to possibly contributing to toxicity, evidence suggests that ROS formation could lead to inactivation of CYP1A. 3,3′,4,4′-Tetrachlorobiphenyl (TCB) and other planar PCBs not only induce CYP1A, but at high doses these compounds also have been reported to suppress CYP1A activity and content (Gooch et al., 1989; Sinclair et al., 1989). In the fish model, scup (Stenotomus chrysops), high doses of TCB cause a sharp and selective decline in hepatic CYP1A content. This effect occurs at a post-transcriptional level (White et al., 1997a), suggesting effects on the protein itself. TCB is a slowly metabolized ligand for scup CYP1A and can inhibit as well as inactivate scup microsomal CYP1A (Gooch et al., 1989; White et al., 1997b). White et al. (1997a) speculated that uncoupling of CYP1A by TCB results in the formation of ROS and oxidative inactivation of the enzyme. Oxidative inactivation occurs in a number of enzymes [CYP2B, Cu, Zn-superoxide dismutase (SOD), Fe-SOD, lactoperoxidase, myeloperoxidase, and xanthine oxidase] that use or produce H2O2 and that contain a metal ion (Loosemore et al., 1980; Matheson and Travis, 1985; Beyer and Fridovich, 1987; Jenzer et al., 1987).
In this article we examine the nature of the inactivation of CYP1A stimulated by TCB. We show that the inactivation is a result of uncoupling of CYP1A, with the formation and attack of some oxidizing species within the active site. We also provide the first direct demonstration that CYP1A bound with a pHAH is a source of ROS. Liver microsomes from the marine fish scup were used initially because CYP1A inactivation by TCB was identified and is quite strong in this species. A single CYP1A is known in scup, and it is more like CYP1A1. Thus, we carried out studies with rat liver microsomes and expressed human enzymes to determine whether TCB uncoupled mammalian CYP1As and whether this occurred with CYP1A1 or CYP1A2. The results show that TCB stimulates the release of ROS from mammalian CYP1A1, and that one consequence may be oxidative inactivation of that protein.
Materials and Methods
Benzo[a]pyrene (BP) was purchased from Aldrich (Milwaukee, WI). 2′,7′-Dichlorodihydrofluorescein diacetate (DCDFDA), dihydroethidium (HE), 7-ethoxyresorufin, and 7-methoxyresorufin were purchased from Molecular Probes (Eugene, OR). 3,3′,4,4′-TCB and 3,3′,4,4′-TCB-ring-UL-14C (52.1 mCi/mmol) were obtained from Pathfinder (St. Louis, MO). Analysis of the [14C]3,3′,4,4′-TCB by gas chromatography-electrochemical detection and gas chromatography-mass spectrometry revealed no hydrophobic contaminants (>99% pure); small amounts of polar contaminants were removed by dissolving the TCB in hexane and extracting twice with NaOH. Hydroxylamine was purchased from Fisher Scientific (Pittsburgh, PA). Catalase, which was purchased from Sigma Chemical Co. (St. Louis, MO), contained less than 0.1% thymol and was determined to have the activity specified by the manufacturer. All other reagents were purchased from Sigma.
Animals.
Scup (S. chrysops) (165–358 g) were caught by angling in Vineyard Sound, MA in 1992, 1994, and 1996, held in flow-through seawater at 14–20°C, and maintained on a diet of Purina Trout Chow. Fish either received no treatment or were injected i.p. with 10 mg of BP in corn oil/kg b.wt. BP was used because it is a potent inducer of CYP1A, is rapidly metabolized, and does not cause uncoupling of scup CYP1A (J.J.S., R.D.W., and J.J.S., unpublished results). Three days after injection, the fish were sacrificed by severing the spinal cord. Livers were harvested and microsomes prepared immediately. Microsomes were prepared from livers pooled from three to six fish.
Microsome Preparation.
Hepatic microsomal fractions were prepared by differential centrifugation (Stegeman et al., 1982). Microsomes also were prepared from postmitochondrial supernatants from livers of untreated rats and rats treated with a range of doses of Aroclor 1254 (Molecular Toxicology, Inc., Annapolis, MD). Microsomes were washed by resuspending in 0.15 M KCl and sedimenting again. Pellets were resuspended in buffer (50 mM Tris, pH 7.4, 1 mM dithiothreitol, 1 mM EDTA, and 20% glycerol) and frozen in liquid N2 until use. Microsomes from baculovirus-infected insect cells expressing human NADPH cytochrome P-450 reductase (CYP-OR) together with either human CYP1A1 or CYP1A2 were purchased from Gentest Corp. (Boston, MA). Protein content was determined by the bicinchoninic acid method, with BSA as a standard.
Western Blotting for CYP1A Quantification.
Microsomal proteins (10 μg/lane) and scup CYP1A standards were resolved on 12% SDS-polyacrylamide gels, transferred to a 0.1-μm nitrocellulose membrane, and incubated with monoclonal antibody 1-12-3 raised against scup CYP1A1 or the polyclonal antibody Rye, raised against mouse Cyp1a2, generously provided by Dr. P. Sinclair (VA Medical Center, White River Jct., VT). Monoclonal antibody 1-12-3 is highly specific for CYP1A1 in mammals. Secondary antibodies were alkaline phosphatase-linked goat anti-mouse IgG and goat anti-rabbit IgG (Bio-Rad, Hercules, CA). Immunoreactive bands were visualized with nitroblue tetrazolium and 5-bromo-4-chloro-3-indoyl-phosphate, and quantified by video image analysis (National Institutes of Health Image 1.60b5). CYP1A1 values for rat are reported as scup CYP1A equivalents.
Enzyme Assays.
Ethoxyresorufin O-deethylation (EROD) and methoxyresorufin O-demethylation (MROD) rates were determined as described previously (Hahn et al., 1993) by using a Cytofluor 2300 (Millipore Corp., Bedford, MA) multiwell plate reader. NADPH-dependent cytochrome c reductase activity was measured at room temperature from the increase in absorbance at 550 nm with a Shimadzu 210 difference spectrophotometer (Stegeman et al., 1982). NADPH oxidation was determined at room temperature from the decrease in absorbance at 340 nm (Imai, 1979). TCB metabolism was assessed by the method of White et al. (1997b). Radioactivity was determined by liquid scintillation counting on a Beckman LS5000TD counter.
In Vitro Studies of CYP1A Inhibition and Inactivation.
The procedure followed that of White et al. (1997a). Primary reaction mixtures (at 30°C in glass tubes) contained 0.1 mg of microsomal protein in 1 ml of buffer (50 mM Tris, and 0.1 mM EDTA, pH 7.6). The following chemicals were added in various combinations at the final concentrations indicated: 0.5% acetone, 1 mM ascorbate, 0.1 mM 3-amino-1,2,4-triazole (ATA), 0.01 to 1 mM azide, 800 U/ml catalase, 10 μM cytochrome c, 1 mM deferoxamine, 1 mM diethylenetriaminepenta-acetic acid, 1 mM Fe-EDTA, 1 mM H2O2, 0.1 mM hydroxylamine (HA), 1 mM mannitol, 1.8 mM NADPH, 1.8 mM NADH, 400 U/ml SOD, 0.017 to 17 μM TCB, and 1 mM tocopherol. TCB was added in acetone as a carrier. Aliquots were removed from primary reaction mixtures at various times and assayed for the rate of EROD or MROD over 5 min. The amount of inhibition was determined by comparing EROD activity in aliquots from primary reaction mixtures with carrier to that in aliquots of primary reaction mixtures containing TCB, but not NADPH. Inactivation was determined by comparing EROD activity in aliquots of primary reaction mixtures containing TCB to that in aliquots from reaction mixtures containing TCB + NADPH. Rates of inactivation were calculated by using the estimated concentration of CYP1A in each microsomal pool. The rate constants were determined from a linear regression analysis of the plot of the natural log of remaining catalytic activity and time. The IC50 andK I were determined directly from a nonlinear regression analysis of the plot of TCB concentration and activity loss. The IC50 was used to determine aK i, considering TCB as a tight binding inhibitor (Cha, 1975).
Removal of TCB.
To remove TCB from reaction mixtures after a 1-h incubation, microsomes were sedimented at 100,000g, resuspended in buffer (50 mM Tris, pH 7.4, 0.15 M KCl, and 0.1 mM BSA), shaken gently for 6 min at 37°C, and then resedimented and resuspended.
Anaerobic Incubations.
Hungate techniques (Hungate, 1969) were used to prepare primary reaction mixtures under anaerobic conditions; these techniques render experimental systems completely free of O2. Reaction mixtures prepared in stoppered serum bottles were purged on ice for 30 min with argon gas that had been rendered free of O2 by passage through a hot, reduced copper column. NADPH solutions were purged in the same manner and added to the appropriate reaction mixtures with a syringe purged of O2 repeatedly by filling it with the argon gas and evacuating it. Aliquots of reaction mixtures also were withdrawn with an argon-purged syringe. Analysis procedures were as described above.
Spectral P-450 and Heme Assays.
Microsomes were resuspended at 0.4 mg of protein/ml of buffer (50 mM Tris and 0.1 mM EDTA, pH 7.6), and 0.5% acetone, 17 μM TCB, and/or 0.7 mM NADPH were added at the final concentrations indicated. After primary incubation for 30 min at 30°C, total P-450 content was determined by bubbling reaction mixtures with CO and obtaining the dithionite-difference spectra (Bonkovsky et al., 1984). Heme content of reaction mixtures was determined by the pyridine hemochrome assay (Omura and Sato, 1964).
Peroxide and Superoxide Formation.
Formation of H2O2 and O2⨪ was determined by measuring oxidation of DCDFDA and HE, with procedures modified from those of Robinson et al. (1994). DCDFDA and HE react with H2O2 and O2⨪ respectively; the stoichiometry of both reactions is 1:1 (Robinson et al., 1994). Microsomal protein (0.1 mg) was added to wells of a 48-well plate containing 160 μl of Hanks’ buffered salt solution (HBSS) (120 mM NaCl, 2.5 mM KCl, 1.2 mM NaH2PO4, 0.1 mM MgCl2, 5.0 mM NaHCO3, 6.0 mM glucose, 1.0 mM CaCl2, and 10 mM HEPES) with 5 μM DCDFDA and 7.5 μM HE. After a 15-min incubation at 30°C, either acetone (5 μl) or TCB (1.7 nmol in acetone) was added. In some cases 200 U of SOD then were added. Reactions were initiated with NADPH (1.4 mM), and fluorescence was monitored over 10 min with 485-nm excitation, and 530- and 625-nm emission filters for DCDFDA and HE, respectively. 2′,7′-Dichlorofluorescein (DCF) and ethidium bromide were used as standards.
To determine the capacity for formation of ROS during in vitro inactivation of CYP1A, primary reaction mixtures were prepared as for the inactivation assay. Aliquots (50 μl) were removed from the reaction mixtures at various times, and combined with 100 μl of HBSS and HE (15 μM); and O2⨪ production (HE oxidation) was assessed as described above. NADPH (1.4 mM) was added to aliquots taken from primary reaction mixtures that did not contain NADPH.
Statistics.
Statistical analysis was performed with SuperAnova for Macintosh (Abacus Concepts, Inc., Berkeley, CA). Two-factor ANOVAS (microsomal pool and treatment) were used to analyze the spectral P-450, inactivation, and ROS time-course experiments. One-factor ANOVAS were used to analyze the cytochrome c and ROS experiments. The Tukey-Kramer and Dunnett’s multiple-comparisons tests were used to determine differences between incubation conditions.
Results
Inactivation of Scup Liver CYP1A.
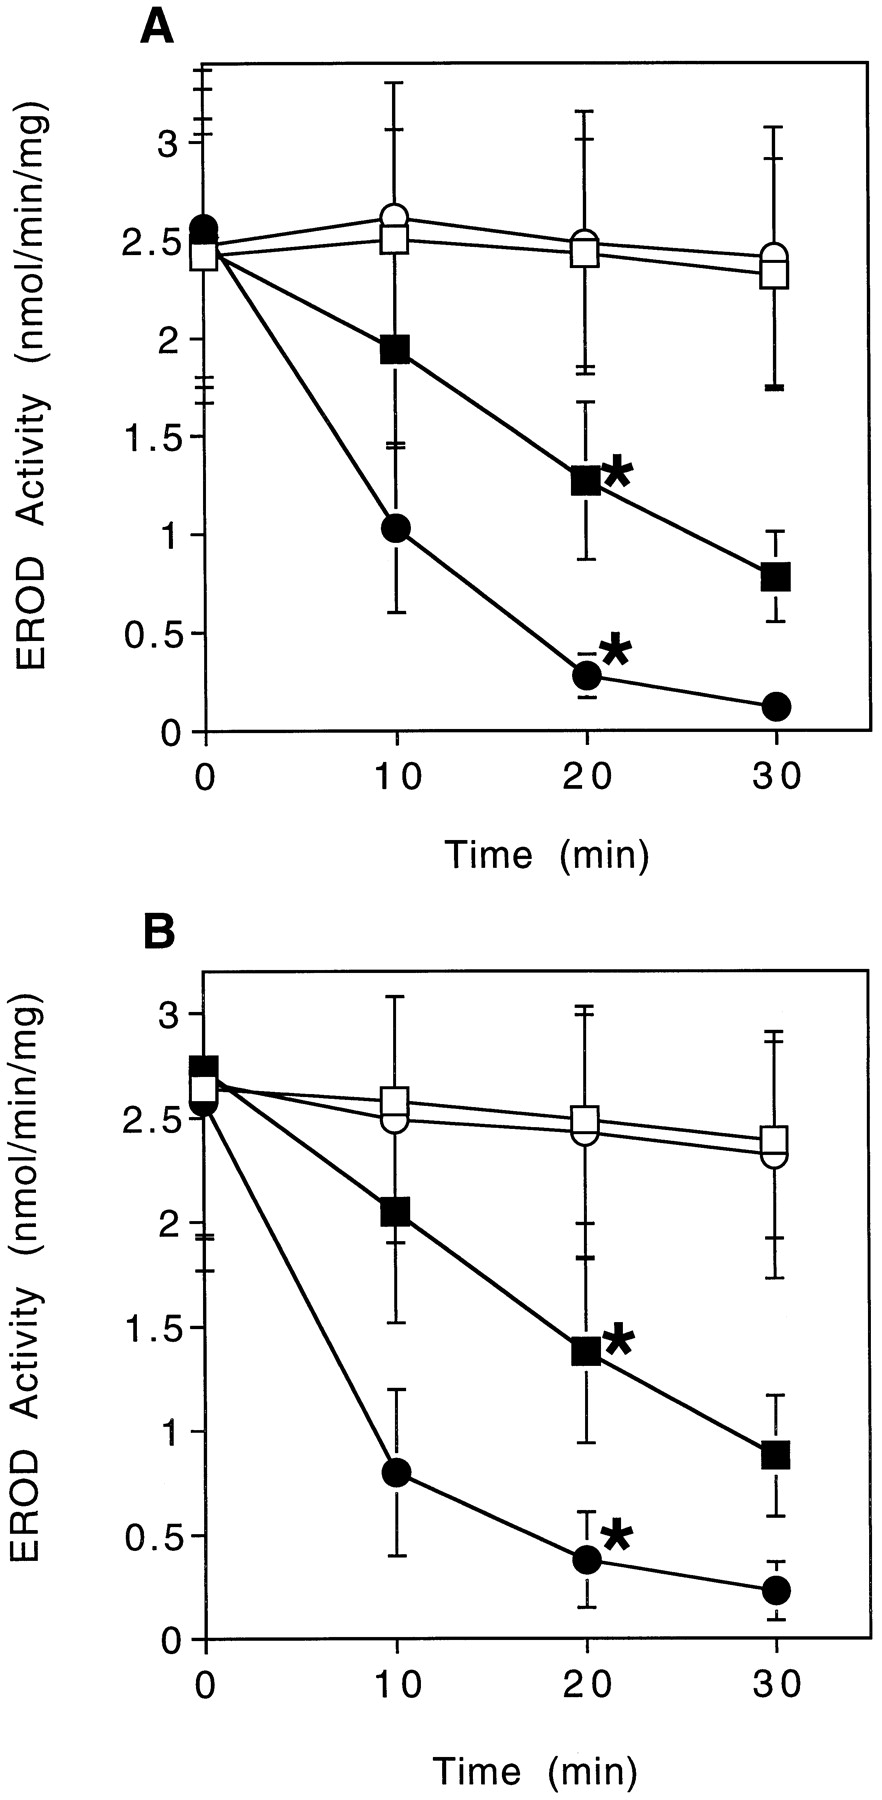
Primary incubation of scup liver microsomes with acetone or with NADPH alone did not alter the capacity to catalyze EROD (Fig. 1). Primary incubation of liver microsomes with TCB but without NADPH resulted in an immediate 50% loss of catalytic capacity, but there was no additional loss over time (Fig. 1). This is consistent with the competitive inhibition by TCB described before (Gooch et al., 1989). This inhibition of EROD was TCB concentration dependent, and theK i was 0.16 μM (Fig.2). When scup hepatic microsomes were incubated with both TCB and NADPH, there was an immediate loss of EROD, as with TCB alone, but there also was a subsequent, progressive loss of activity (Fig. 1). Incubation of liver microsomes with TCB and NADPH resulted in a 63% loss of EROD activity in 30 min, which may be equated to a rate of loss of 8 ± 3 pmol of CYP1A/min/mg, assuming that the rate of EROD is directly related to the amount of CYP1A present. As with inhibition, the progressive loss of EROD activity was TCB concentration dependent, and the K I was 0.05 μM (Fig. 2). The rate constants for inactivation of CYP1A in the presence of TCB with and without NADPH were 0.038 and 0.004 min−1, respectively. Scup liver microsomes incubated with TCB and NADPH also showed a progressive loss of capacity to catalyze MROD (n = 3,k TCB = 0.006,k TCB+NADPH = 0.055). The inactivation of EROD or MROD did not occur when microsomes were incubated with TCB and NADH instead of NADPH (data not shown).

TCB-stimulated inactivation of scup liver CYP1A (EROD activity). A, EROD activity. B, rate constant analysis. Microsomes (0.1 mg of protein/ml with 0.40 ± 0.15 nmol of CYP1A/mg) were incubated in buffer (50 mM Tris and 0.1 mM EDTA, pH 7.6) at a final volume of 1 ml at 30°C. Chemicals added in various combinations were at the final concentrations indicated: 5% acetone, 1.8 mM NADPH, and 1.7 μM TCB in acetone. Aliquots were removed from the primary reaction mixtures at various times and then assayed for EROD activity over 5 min. Complete inactivation of EROD occurred within 1 h of primary incubation. Data are means ± S.D. from 11 pools of microsomes. ∗, statistically different from all other incubation conditions analyzed at 30 min (p < .01, Tukey-Kramer test). ▵, acetone; ▴, NADPH; ■, TCB; ▪, TCB + NADPH.

TCB concentration dependence of inhibition and inactivation of scup liver CYP1A. Primary incubation conditions and assay technique were as described in Fig. 1, except that a range of TCB concentrations was used (0.017–17 μM). Inhibition was determined by comparing EROD activity in aliquots from primary reaction mixtures with carrier to that in aliquots of primary reaction mixtures containing TCB but not NADPH. Inactivation was determined by comparing EROD activity at 30 min in aliquots of primary reaction mixtures containing TCB to that in aliquots from reaction mixtures containing TCB + NADPH. IC50 and K I values were determined by a nonlinear regression analysis of the activity loss versus TCB concentration plot with data from three pools of microsomes. The IC50 was converted to a K i(0.16 μM; Cha, 1975). TCB was considered a tight binding inhibitor because increasing concentrations of 7-ethoxyresorufin did not effectively displace the TCB (data not shown). TheK I (concentration at half-maximal inactivation) was 0.05 μM.
Removal of TCB from microsomes that had been incubated with TCB + NADPH did not restore any of the capacity to catalyze EROD. Microsomes incubated for 1 h with TCB + NADPH had only 7 ± 0% of the EROD capacity of microsomes incubated with acetone + NADPH; after washing and resedimenting of microsomes to remove TCB, the capacity for 7-ethoxyresorufin oxidation was unchanged. A similar washing of microsomes that had been incubated with TCB but without NADPH resulted in at least a 50% recovery of the EROD capacity that had been lost due to inhibition (37 ± 4% versus 68 ± 4% of control activity before and after TCB removal, respectively).
Scup liver microsomes incubated with TCB + NADPH also lost spectral P-450. Approximately 50% of the P-450 spectral signal was lost after 30 min of primary incubation, equivalent to a rate of 12 ± 6 pmol of P-450 lost/min/mg (Table 1). There was no loss of spectral P-450 when microsomes were incubated with TCB alone (Table 1). A slight, but not significant, loss of spectral P-450 occurred when microsomes were incubated with NADPH alone (Table1). The loss of spectral P-450 stimulated by TCB + NADPH was accompanied both by a loss of heme and by the appearance of cytochrome P-420 (Table 1). Although the amount of P-450 lost was consistent between experiments, the proportion that appeared as P-420 and the amount of heme lost both varied. Unfortunately, P-420 formation and heme loss were measured in different experiments, precluding a determination of whether P-420 formed and heme loss equaled the loss of spectral P-450.
Loss of scup liver spectral P-450 stimulated by TCB and NADPH
The above results suggest that in the presence of NADPH, TCB causes a time-dependent loss of CYP1A activity by mechanism-based inactivation, i.e., inactivation by a metabolite of TCB, and/or by oxidative inactivation. TCB is a substrate for scup CYP1A, but it is metabolized very slowly (White et al., 1997b). Scup hepatic microsomes used in these studies metabolized TCB at a rate of only 0.34 ± 0.08 pmol/min/mg, approximately 25-fold slower than the rate of loss of active CYP1A1 (8–12 pmol/min/mg). Rat liver microsomes have been shown to activate TCB to a product that binds to CYP1A1 (Shimada and Sawabe, 1983). However, the rate of TCB metabolism seen here, and hence possible covalent binding of TCB, cannot account for the loss of total P-450 or for the loss of active CYP1A during primary incubation of scup liver microsomes with TCB + NADPH.
In light of the slow rate of TCB oxidation, we examined the possibility that catalytic uncoupling may be occurring. The rate of NADPH oxidation by scup liver microsomes was 13 ± 5 nmol/min/mg protein in the presence of acetone (carrier); this rate increased in the presence of TCB to 33 ± 9 nmol/min/mg. Cytochrome c inhibits CYP by competing for electrons from CYP reductase (Estabrook et al., 1996); adding 10 μM cytochrome c together with TCB + NADPH reduced the rate of inactivation from 7.7 pmol/min/mg to 3.5 ± 0.6 pmol/min/mg (n = 4, p < .01). When microsomes were incubated under anaerobic conditions, TCB-dependent inactivation of EROD did not occur. Microsomes incubated anaerobically with TCB alone for 45 min had a capacity for EROD activity of 2.5 nmol/min/mg, and aliquots of the same pool of microsomes incubated anaerobically with TCB + NADPH had an EROD activity of 2.8 pmol/min/mg. Slow rates of TCB oxidation, enhanced electron transfer, oxygen dependence, and electron dependence of inactivation all are consistent with uncoupling of electron transport and O2reduction from substrate oxidation.
A series of antioxidants, pro-oxidants, and enzymes that act on ROS was tested for their influence on TCB-dependent EROD inactivation. Initially, several catalase inhibitors were tested. Adding azide at 0.1 mM significantly increased the rate of inactivation in the presence of TCB + NADPH to 20 ± 9 pmol of CYP1A/min/mg, with a rate constant of 0.106 min−1 (Fig.3A). There was no significant loss of EROD activity from microsomes incubated with NADPH and 0.1 mM azide but without TCB. In contrast, ATA and HA had no affect on the rate of EROD inactivation (Table 2). Thus, the enhanced inactivation due to azide does not appear to result from inhibition of catalase but rather occurs through some other mechanism.
Effects of azide (A) and peroxide (B) on TCB-stimulated scup liver CYP1A inactivation. Incubation conditions and assay technique were as described in Fig. 1, except for the addition of azide or H2O2 to the primary reaction mixtures. Data shown are for azide at 0.1 mM and H2O2 at 100 mM. In the absence of either TCB or NADPH, these concentrations of azide or H2O2 did not affect stability of CYP1A, although at higher concentrations (1 mM), adding azide + NADPH to primary reaction mixtures resulted in a 50% loss of EROD capacity after 30 min. Data are the means ± S.D. from five pools of microsomes. ∗, statistically different from all other incubation conditions analyzed at 20 min (p < .01, Tukey-Kramer test). A, ■, TCB; ▪, TCB + NADPH; ○, TCB + azide; ●, TCB + azide + NADPH. B, ■, TCB; ▪, TCB + NADPH; ○, TCB + H2O2; ●, TCB + H2O2 + NADPH.
Effect of catalase inhibitors on TCB-stimulated CYP1A inactivation
As with azide, adding H2O2to primary reaction mixtures with TCB + NADPH caused a substantial increase in the rate of EROD inactivation compared with the rate of loss without added H2O2 (28 versus 8 pmol of CYP1A lost/min/mg, respectively; Fig. 3B). The rate constant was 0.078 min−1. Little or no loss of activity occurred with H2O2alone, or with H2O2 + NADPH. As expected, when catalase was added together with H2O2, it eliminated the increase in inactivation due to the exogenous H2O2 (Table3). However, adding catalase did not affect the inactivation that was caused only by TCB + NADPH (Table 3).
Effect of peroxide on TCB-stimulated CYP1A inactivation
Attempts to scavenge ROS or to alter the iron concentration in the primary reaction mixtures had no effect on CYP1A inactivation. Addition of SOD did not decrease the inactivation due to TCB + NADPH (data not shown). Similarly, neither the hydrophilic reactive oxygen-scavenging compounds, ascorbate and mannitol, nor the lipophilic reactive oxygen-scavenging compound, tocopherol, altered the inactivation stimulated by TCB + NADPH (data not shown). If iron external to the enzyme was catalyzing OH⋅ formation, and if such externally produced radicals were involved in CYP1A1 inactivation, then chelation of iron should reduce the rate of inactivation. However, neither addition of the iron chelators, deferoxamine, or diethylenetriaminepenta-acetic acid, nor addition of chelated iron affected inactivation (data not shown).
Stimulation of ROS Formation.
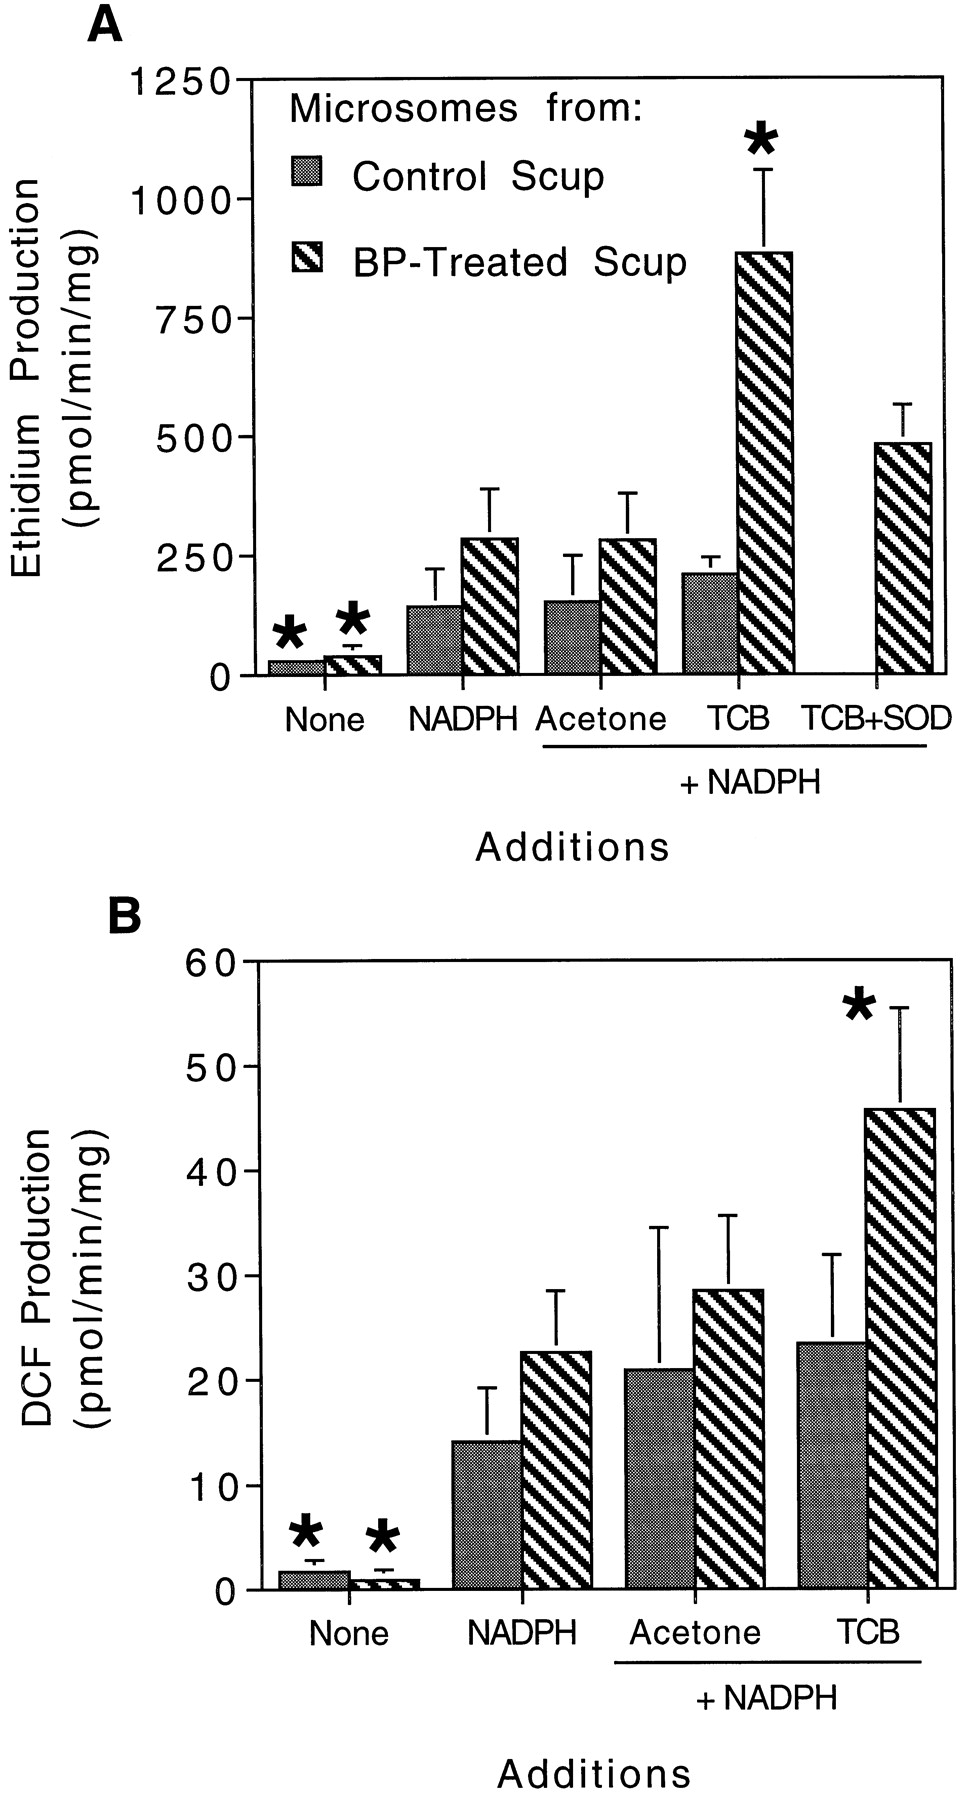
The above results are indicative of oxidative inactivation and suggest that ROS formation in the active center of scup CYP1A is stimulated by TCB. This should be accompanied by enhanced release of ROS from microsomes. The production of ROS by liver microsomes was measured by detecting oxidation of DCDFDA and HE to DCF and ethidium by H2O2and O2⨪, respectively. Liver microsomes from both control and BP-treated scup oxidized DCDFDA and HE at very low rates in the presence of the probes alone. These rates were increased by addition of NADPH (Fig. 4). Adding either acetone or TCB in combination with NADPH did not alter DCDFDA and HE oxidation rates by control liver microsomes, compared with rates obtained with NADPH alone. Addition of acetone + NADPH also did not alter the DCDFDA and HE oxidation by liver microsomes from BP-treated scup. However, when TCB + NADPH was added to liver microsomes from BP-treated scup, there was a significant increase in rates of DCDFDA and HE oxidation over those occurring with NADPH alone (Fig. 4). Addition of SOD to reaction mixtures abolished the HE oxidation that was stimulated by TCB + NADPH, confirming a direct release of O2⨪, presumably after addition of the first electron. H2O2either could result from dismutation of O2⨪ or could be released directly after addition of the second electron.

ROS production in liver microsomes from control and BP-treated scup. A, O2⨪ production, assessed by the oxidation of HE to ethidium. B, H2O2production, assessed by the oxidation of DCDFDA to DCF. In a 48-well plate, approximately 0.1 mg of microsomal protein (3.8 ± 1.5 nmol of CYP1A/mg) was diluted to 160 μl with HBSS containing 5 μM DCDFDA and 7.5 μM HE (final concentrations). Some reaction mixtures contained 200 U of SOD. After a 15-min incubation at 30°C, 1.7 nmol of TCB in 5 μl of acetone or 5 μl of acetone alone were added, and reactions were initiated with NADPH. The rates of DCF and ethidium production were monitored fluorometrically over 5 min (485 nm excitation, 520 and 625 nm emission, respectively). Calculations were made by using DCF and ethidium bromide as standards. Data are the means ± S.D. from at least three pools of microsomes. ∗, statistically different from acetone + NADPH (p < .05, Dunnett’s multiple-comparisons test).
The stimulation of ROS production by liver microsomes from BP-treated but not control scup implies the involvement of CYP1A. To evaluate further the involvement of CYP1A in the TCB-stimulated production of ROS, scup liver microsomes were incubated under conditions that inactivate CYP1A and then examined for the capacity to oxidize HE (Fig.5). Microsomes incubated with acetone or acetone + NADPH for up to 30 min and then combined with HE and additional NADPH oxidized HE at a very low rate. Microsomes incubated with TCB alone before addition of HE and NADPH oxidized HE at a high rate, regardless of the duration of the primary incubation. Microsomes incubated with TCB + NADPH initially had a high capacity for HE oxidation, but incubation with TCB + NADPH over time revealed a time-dependent loss of the capacity to produce ROS that paralleled the loss of capacity for EROD.

Effect of TCB and NADPH on the capacity of scup liver CYP1A to produce ROS. Reaction mixtures were prepared and incubated as described in Fig. 1, except that reaction mixtures contained 0.4 mg of microsomal protein and 17 nmol of TCB. Aliquots (50 μl) were removed from each reaction mixture at various times, and each was combined with 100 μl of HBSS, 15 μM HE, and 1.4 mM NADPH in a well of a 48-well plate. Rates of ethidium production were determined as in Fig. 4. Data are the means ± S.D. from three pools of microsomes. ∗, statistically different from all other incubation conditions analyzed at 30 min (p < .01, Tukey-Kramer test). ▵, acetone; ▴, NADPH; ■, TCB; ▪, TCB + NADPH.
TCB-Stimulated CYP1A Inactivation in Rat Liver Microsomes.
Adding TCB (1.7 μM) to rat liver microsomes caused a sustained inhibition (21 ± 2%) of EROD activity, which was less than the 50% inhibition of EROD in scup liver microsomes. When microsomes from Aroclor 1254-treated rats were incubated with TCB + NADPH, there also was a progressive loss of EROD activity (k TCB = 0.003,k TCB+NADPH = 0.008). The rate of loss of EROD activity from induced rat liver microsomes was less than that seen with scup; after 30 min there was only a 15% decline in EROD capacity of rat liver microsomes, compared with a 63% decline with scup liver microsomes. As with scup liver microsomes, the TCB + NADPH-dependent loss of EROD capacity from rat liver microsomes was enhanced by azide (k TCB+NADPH+Azide = 0.012). Immunoblot analysis with antibodies to scup CYP1A1 and to mouse CYP1A2 showed that both CYP1A1 and CYP1A2 were present in the induced rat liver microsomes (data not shown). However, MROD, a preferred activity of CYP1A2 (Tsyrlov et al., 1993), was not inactivated by TCB + NADPH (Table4). The measured rate of TCB oxidation by these rat liver microsomes was 50 pmol/min/mg, two orders of magnitude greater than the rate of TCB oxidation by scup liver microsomes (Table4), yet still slow enough to suggest possible uncoupling.
Comparison of scup and rat liver microsomal enzyme activities and CYP1A inactivation
Formation of ROS by Rat Liver Microsomes.
Patterns of ROS production by rat liver microsomes were similar to those obtained with scup liver microsomes. Liver microsomes from control or from Aroclor 1254-treated rats oxidized DCDFDA and HE at low rates, and those rates were increased severalfold by the addition of NADPH (Fig.6). Adding either acetone or TCB together with NADPH did not further enhance the DCDFDA and HE oxidation rates by control rat liver microsomes. However, when TCB + NADPH was added to liver microsomes from Aroclor 1254-treated rats, there was a significant increase in the rate of oxidation of both DCDFDA and HE, compared with the rate with NADPH alone or to the rate seen with control microsomes incubated under any condition (Fig. 6). SOD only partly abolished the enhanced HE oxidation, suggesting that radicals additional to O2⨪ were contributing to HE oxidation by induced rat liver microsomes (data not shown). Analysis of microsomes from rats treated with doses of Aroclor 1254 ranging from 0 to 500 mg/kg showed that the capacity for ROS production stimulated by TCB + NADPH was correlated with the capacity for EROD activity, i.e., with the content of native CYP1A1 (r 2= 0.968, p < .001).

ROS production in liver microsomes from control and Aroclor 1254-treated rats. A, O2⨪ production as assessed by the oxidation of HE to ethidium. B, H2O2 production as assessed by the oxidation of DCDFDA to DCF. Incubations were as described in Fig. 4 with the use of liver microsomes from untreated rats and rats treated with 62.5 to 500 mg/kg Aroclor 1254 (0.26 ± 0.28 nmol of CYP1A/mg). Data are the means ± S.D. from three pools of microsomes except that values from control rats were determined from one pool of microsomes. ∗, statistically different from acetone + NADPH (p < .05, Dunnett’s multiple-comparisons test).
ROS Production By and Inactivation of Human CYP1As.
The results above indicate that TCB stimulates production of ROS preferentially by rat CYP1A1. To evaluate whether this might occur with human CYP1A1, microsomes from baculovirus-infected insect cells expressing CYP-OR and either human CYP1A1 or CYP1A2 were examined for their ability to produce ROS. Microsomes containing either expressed CYP1A1 or CYP1A2 oxidized DCDFDA and HE at very low rates when probe alone was added (data not shown). Adding NADPH stimulated ROS production by both CYP1A1 and CYP1A2, and CYP1A2 microsomes oxidized DCDFDA and HE at rates 5-fold greater than did CYP1A1 microsomes (Fig.7). Addition of TCB + NADPH further stimulated DCDFDA and HE oxidation by CYP1A1 microsomes, but the addition of TCB + NADPH decreased ROS production by CYP1A2 microsomes, compared with rates with NADPH alone (Fig. 7). Rates of CYP-OR activity (ca. 2900 nmol/min/mg) were similar in microsomes containing CYP1A1 and CYP1A2, indicating that the differences in ROS production reflected differences in activity of the CYP1As.
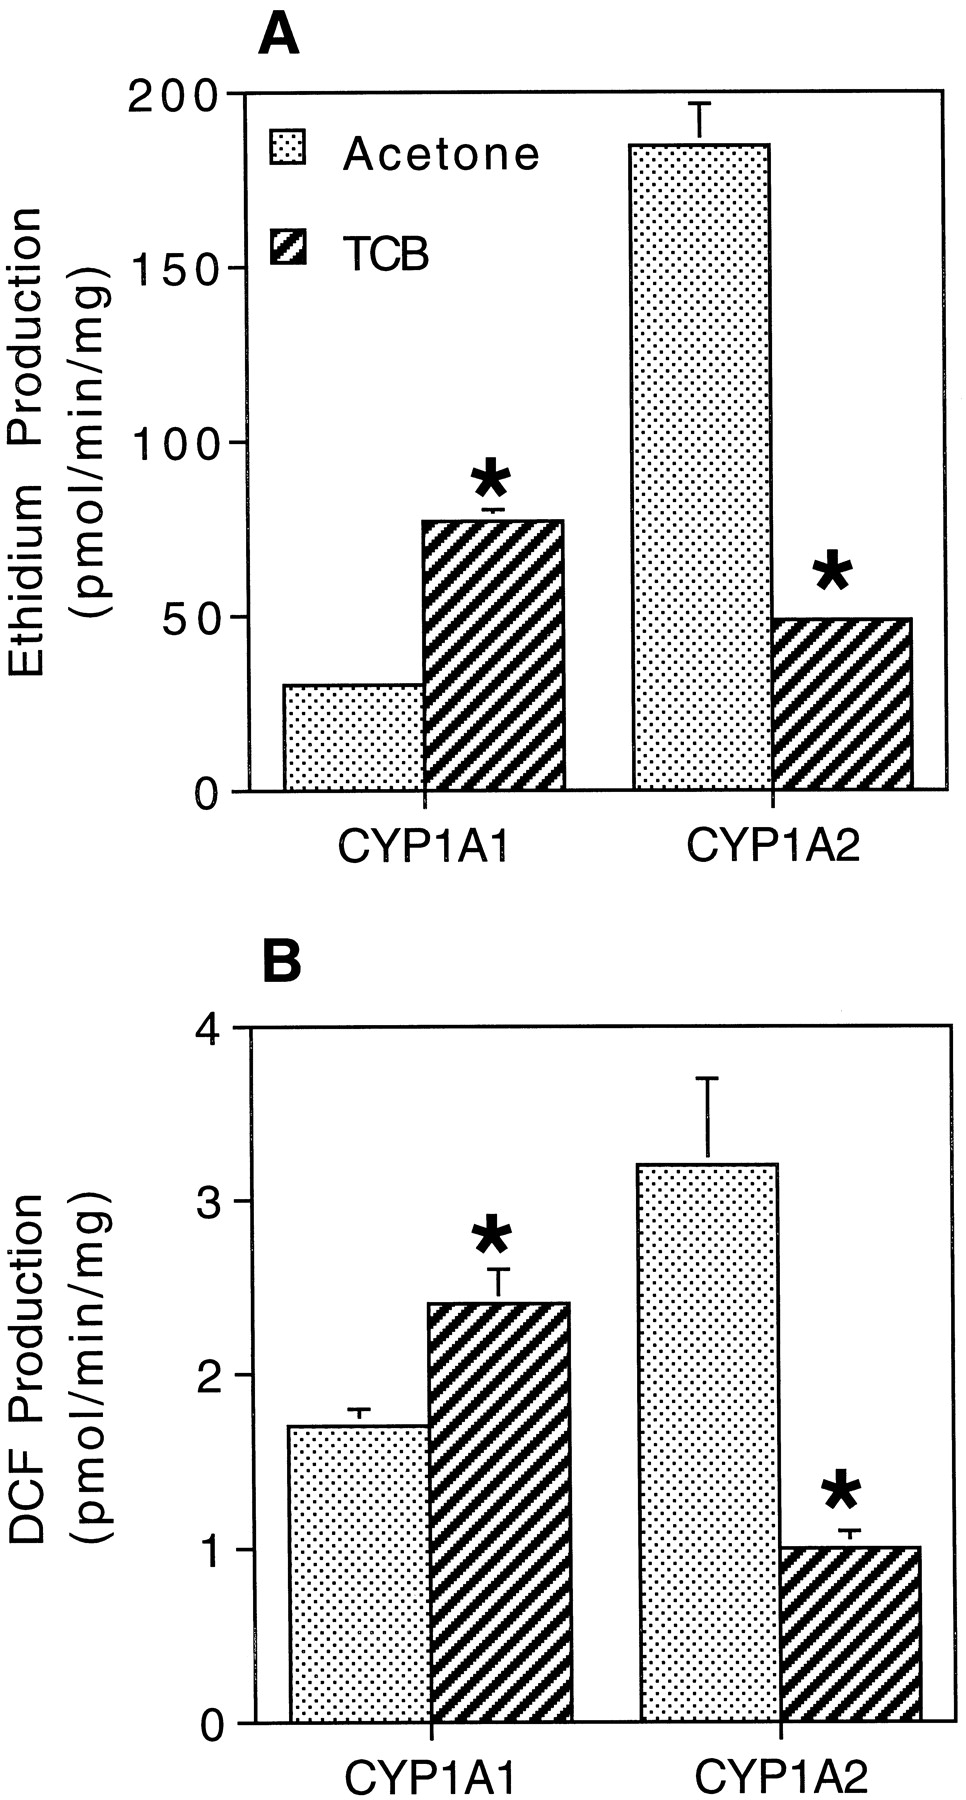
ROS production by human CYP1A1 and CYP1A2. A, O2⨪ production as assessed by the oxidation of HE to ethidium. B, H2O2production as assessed by the oxidation of DCDFDA to DCF. Microsomes from insect cells expressing recombinant genes in baculovirus were used. Incubations were as described in Fig. 4. Rates of cytochromec reductase activity (2900 nmol/min/mg) and CYP content (0.14–0.19 nmol/reaction) were similar in both the CYP1A1 and CYP1A2 microsomes, as indicated by the manufacturer’s analyses. Data are the means ± S.D. from three replicates. ∗, statistically different from acetone + NADPH (p < .05, Dunnett’s multiple-comparisons test).
Unlike the results with scup and rat CYP1As, inactivation of human CYP1A1 and CYP1A2 occurred during incubation with NADPH alone (Table5). Incubation with TCB + NADPH appeared to slightly increase the rate of CYP1A1 inactivation (i.e., loss of EROD activity). However, incubation with TCB + NADPH decreased the rate of CYP1A2 inactivation (i.e., loss of MROD activity) relative to that seen with NADPH alone (Table 5).
Inhibition and inactivation of human CYP1A1 and CYP1A2 by TCB
Discussion
The toxicity of TCDD and other pHAHs is AhR dependent (Poland and Glover, 1980; Fernandez-Salguero et al., 1996), yet the mechanism(s) of toxicity is not understood. Oxidative stress results from exposure of animals or cells to AhR agonists, and that oxidative stress is partly AhR dependent (Faux et al., 1992; Park et al., 1996), suggesting that radical formation may be contributing to AhR agonist toxicity. Here, we provide a direct demonstration that a model pHAH, TCB, stimulates the release of ROS from CYP1A1 isoforms of several species, including humans. Furthermore, we demonstrate that increased release of ROS is the result of uncoupling of CYP1A1 by TCB. Consequences resulting from ROS formation and release may include both the oxidative inactivation of CYP1A1 we have shown here, and toxicity.
To investigate the mechanisms of CYP1A inactivation by TCB, we used hepatic microsomes from the fish scup, a species with CYP1A that is highly sensitive to such inactivation (White et al., 1997a). TCB binds tightly to scup CYP1A, indicated by a lowK m for TCB metabolism (0.7 μM) (White et al., 1997b) and low K i for competitive inhibition of CYP1A (<0.3 μM) (Gooch et al., 1989; M. E. Hahn, unpublished results). However, the maximal rate of TCB oxidation is less than 1 pmol of TCB oxidized/min/nmol of CYP1A (White et al., 1997b; Table 4). TCB stimulates microsomal NADPH oxidation, and the TCB-stimulated inactivation of CYP1A was completely dependent on both NADPH and oxygen. These observations, together with the demonstration that TCB stimulates ROS release, are consistent with uncoupling of scup CYP1A by TCB as the cause of the inactivation of CYP1A.
Antioxidant enzymes, oxygen-scavenging compounds, iron, or iron chelators had no effect on the inactivation of CYP1A by TCB, indicating that the chemistry involved is initiated and constrained within the active site. To our knowledge, this is the first study to show a substrate-dependent inactivation of CYP1A due to ROS formed in situ. This differs from inactivation of rat CYP1A1 by the alkylating agent 2-bromo-4′-nitroacetophenone, where alkylation of the protein destabilizes the oxy-cytochrome complex, which decomposes before substrate oxidation can occur, resulting in ROS release (Parkinson et al., 1986). Unlike TCB-stimulated inactivation of CYP1A, alkylation did not result in oxidative modification of the protein or in a loss of spectrally detectable P-450.
Scup liver microsomes incubated with TCB + NADPH consistently lost spectral P-450, corresponding to the loss of CYP1A (EROD activity), but the fate of that P-450 varied. Cytochrome P-420 was formed in some instances, indicating modification of the environment of an intact heme (Stern et al., 1973). However, the amount of P-420 formed was variable and always less than the total P-450 lost. Heme was lost from most reaction mixtures but, as with P-420 formation, the extent of heme loss was highly variable. Mechanism-based inactivation of CYP often occurs with an attack of a reactive intermediate at one particular site, either on heme or an amino acid in the active site (e.g., Roberts et al., 1998). The occurrence of both heme loss and P-420 formation during TCB-stimulated inactivation of scup CYP1A implies that the inactivating species attacks multiple sites in the enzyme.
Because the chemistry involved appears to occur entirely within the active site, the exact identity of the chemical species causing CYP1A inactivation is unclear. Both O2⨪ and H2O2 were released from scup liver microsomes, as well as from rat liver microsomes and human CYP1A1, on incubation with TCB + NADPH. Either one or both formed in the active site could contribute to inactivation. O2⨪ and/or H2O2 have been suggested to cause release of heme iron from hemoglobin, but no mechanism for that process was proposed (Gutteridge, 1986). More likely is the possibility that the Fe-coordinated reduced oxygen is involved, as is the case for inactivation of SOD and myeloperoxidase (Hodgson and Fridovich, 1975;Matheson and Travis, 1985). A third, although speculative, possibility is that the highly reactive OH⋅ is responsible for CYP1A inactivation. With TCB lodged in the active site, heme iron may undergo cycles of oxidation and reduction to Fe2+. The transient penta-coordinate ferrous heme iron might act as a Fenton catalyst, generating OH⋅ from H2O2 in the active site. The possibility that heme iron could act as a Fenton catalyst has been thought unlikely (Gutteridge, 1986). Yet, studies on SOD suggest that Fenton chemistry can occur in enzyme active sites. Cu, Zn-SOD, and Fe-SOD all are oxidatively inactivated, whereas Mn-SOD is not; manganese cannot act as a Fenton catalyst (Beyer and Fridovich, 1987). In addition, autoinactivation of lactoperoxidase was proposed to involve ferrous heme iron acting as a Fenton catalyst (Jenzer et al., 1987).
Low concentrations of azide or H2O2 enhanced the TCB-dependent inactivation of CYP1A, supporting the conclusion that the inactivation chemistry occurs entirely within the active site. Other catalase inhibitors, ATA or HA, did not affect the inactivation. Thus, the azide effect did not result from catalase inhibition and any subsequent effect on H2O2gradients; rather, it suggests that azide and H2O2 appear to enter the active site even with TCB bound in the access channel. As with H2O2, azide can interact with reduced iron, forming highly reactive azidyl radical (Ortiz de Montellano et al., 1988). Microsomes incubated with azide and NADPH can produce azidyl radicals (Reinke et al., 1994), and azide is thought to inactivate horseradish peroxidase via formation and addition of an azidyl radical to the heme (Ortiz de Montellano et al., 1988).
Oxidative inactivation of other CYPs, particularly CYP2B, has been known for some time (Guengerich and Strickland, 1977), but that inactivation, and hence the mechanism, differs from the inactivation of scup or rat CYP1A. First, CYP2B inactivation occurred with excess NADPH alone and decreased when substrate was added (Guengerich and Strickland, 1977; Loosemore et al., 1980), whereas inactivation of CYP1A proceeded only when TCB was added with NADPH. Second, CYP2B inactivation was attributed to H2O2 released from the enzyme (Guengerich and Strickland, 1977); CYP1A released O2⨪ and possibly H2O2. Third, inactivation of CYP2B was exacerbated by catalase inhibitors, both azide and HA, and was relieved by catalase and by the radical scavengers ionol and mannitol. Similar attempts to modify ROS concentrations external to the active site had no influence on CYP1A inactivation by TCB. Fourth, inactivation of CYP2B was primarily due to effects on heme; spectral P-450 content and heme content declined in parallel, and there was no P-420 formation (Guengerich, 1978). In scup, heme loss and P-420 formation both occurred during CYP1A inactivation by TCB.
The studies with scup and rat were performed with tissue microsomes rather than purified protein, which could confound efforts to establish the involvement of specific CYP form(s). However, inactivation detected in reconstituted monooxygenase systems might not occur in microsomes. Oxidative autoinactivation of purified CYP2B was not detected with microsomal CYP2B (Loosemore et al., 1980). Despite the potential influence of the microsomal environment, our microsomal results clearly implicate CYP1A1 proteins as a source of ROS and as a target for inactivation stimulated by TCB. Control scup and rat liver microsomes incubated with NADPH formed ROS, similar to previous results with mammalian liver microsomes (Reinke et al., 1994), but only induced scup or rat liver microsomes showed TCB stimulation of ROS formation. A single CYP1A has been identified in scup; scup CYP1A has properties of both CYP1A1 and CYP1A2, but it is more like a CYP1A1 (Morrison et al., 1995). In scup and rat liver microsomes, the amounts of native CYP1A1 (EROD rates) correlated closely with the TCB-stimulated rate of ROS production. Moreover, only EROD was inactivated in rat liver microsomes incubated with TCB + NADPH, whereas MROD, a preferred CYP1A2 activity (Tsyrlov et al., 1993), was not. The results with baculovirus-expressed CYP1As showed that TCB stimulates a release of ROS by human CYP1A1 but not CYP1A2. Thus, the isoform involved in TCB-stimulated ROS release in mammals is CYP1A1 and in fish is a CYP1A1 ortholog.
CYP1A2 proteins bind pHAHs (Voorman and Aust, 1988), but the result of that interaction is not the same as the result of binding to CYP1A1. When incubated with NADPH alone, the expressed human CYP1A2 released ROS at a greater rate than did CYP1A1. This result differs from a recent report that human CYP1A1 produced ROS at a greater rate than CYP1A2 (Puntarulo and Cederbaum, 1998). Those authors used human CYP1As expressed in lymphoblastoid cells with relatively low CYP-OR content, whereas we used baculovirus-expressed CYP coexpressed with high levels of CYP-OR. Our results with human CYP1A2 are like the observations that rat CYP1A2 is rapidly reduced in the absence of substrate (Guengerich and Johnson, 1997) and that reconstituted rat CYP1A2 has a greater oxidase activity than CYP1A1 (Morehouse et al., 1984). Interestingly, we observed that ROS production by human CYP1A2 was decreased and that CYP1A2 activity was increased slightly by TCB + NADPH compared with results with NADPH alone. This implies that NADPH alone stimulates inactivation of CYP1A2 and that TCB retards that inactivation, consistent with observations that pHAHs potentially stabilize rat CYP1A2 (Voorman and Aust, 1988).
The data reported here show that TCB + NADPH consistently and strongly stimulate the production of ROS by human and animal CYP1A1. However, the relative extent of CYP1A1 inactivation by TCB + NADPH differed among species, from strong inactivation of scup CYP1A1 to little inactivation of human CYP1A1. The basis for this difference in the balance between inactivation and ROS release is unknown, but the results with scup and rat suggest that it could be related to rates of TCB metabolism. The rate of TCB oxidation by rat liver microsomes was 100 times the rate by scup liver microsomes. In addition to the electron-withdrawing effects of chlorine substituents, steric hindrance might lodge TCB in the substrate access channel of scup CYP1A in a way that renders it even less accessible to oxidation than in rat CYP1A1. Nevertheless, TCB oxidation by rat liver microsomes apparently proceeds slowly enough to uncouple CYP1A1.
In summary, these results demonstrate that the pHAH TCB stimulates release of ROS by CYP1A1 of humans and other species and indicate that this is a result of uncoupling. Other pHAHs that are slowly metabolized also uncouple CYP1A1 (our unpublished results). One result of this uncoupling can be the inactivation of CYP1A1 via attack of ROS within the active site, although this effect is greater in some species than in others. Oxidative inactivation of CYP1A in vivo could target it for degradation, which could explain the decreases in CYP1A content in some animals and cultured cells exposed to high doses of pHAHs (Gooch et al., 1989; Sinclair et al., 1989). In addition, ROS release might suppress CYP1A transcription (Xu and Pasco, 1998). Apart from possible inactivation of CYP1A1, pHAH-stimulated release of ROS could be a direct link between a known AhR-dependent process (CYP1A1 induction) and oxidative damage associated with exposure to pHAHs, including TCDD (Toborek et al., 1995; Park et al., 1996). Indeed, TCDD-induced oxidative damage and apoptosis in endothelial cells in fish (medaka) embryos was correlated with CYP1A induction in those cells, and P-450 inhibitors and the antioxidant N-acetylcysteine decreased that damage and mortality (Cantrell et al., 1998). Generation of ROS by CYP1A1 could contribute to cellular effects by altering gene expression via nuclear factor-κB or other redox-sensitive transcription factors. Thus, ROS production by CYP1A1 could be a mechanism contributing to the toxicity of pHAHs that are AhR agonists.
Acknowledgments
We gratefully acknowledge David Schlezinger and Bruce Woodin for technical assistance, Drs. Mark Hahn and Vicki Starczak for assistance with data analysis, Dr. Kenneth Fish for providing DCF, and Eli Hestermann and Dr. Wade Powell for comments on the manuscript.
Footnotes
- Received February 12, 1999.
- Accepted May 18, 1999.
-
Send reprint requests to: Dr. John J. Stegeman, Biology Department, Redfield 342, MS 32, Woods Hole Oceanographic Institution, Woods Hole, MA 02543. E-mail: jstegeman{at}whoi.edu
-
This research was supported in part by National Institutes of Health Grant P42-ES07381, by Environmental Protection Agency Grant R823889, by the Air Force Office of Scientific Research (AFOSR) Grant F40620-94-1039, and by a Woods Hole Oceanographic Institution-Mellon Award. This is contribution number 9661 of the Woods Hole Oceanographic Institution.
Abbreviations
- TCDD
- 2,3,7,8-tetrachlorodibenzo-p-dioxin
- AhR
- aryl hydrocarbon receptor
- ATA
- 3-amino-1,2,4-triazole
- BP
- benzo[a]pyrene
- CYP
- cytochrome P-450
- CYP-OR
- NADPH cytochrome P-450 reductase
- DCF
- 2′,7′-dichlorofluorescein
- DCDFDA
- 2′,7′-dichlorodihydrofluorescein diacetate
- EROD
- ethoxyresorufinO-deethylation
- HA
- hydroxylamine
- HBSS
- Hank’s buffered salt solution
- HE
- dihydroethidium
- MROD
- methoxyresorufinO-demethylation
- pHAH
- planar halogenated aromatic hydrocarbon
- PCB
- polychlorinated biphenyl
- ROS
- reactive oxygen species
- SOD
- superoxide dismutase
- TCB
- 3,3′,4,4′-tetrachlorobiphenyl
- The American Society for Pharmacology and Experimental Therapeutics


