


Abstract
A candidate antitumor agent, 2-(4-amino-3-methylphenyl)-5-fluorobenzothiazole (5F-203), was empirically discovered through the National Cancer Institute's Anticancer Drug Screen from a unique growth inhibitory-response profile, indicating a novel mechanism of action. 5F-203 activates the CYP1 family of cytochrome P450, involving aryl hydrocarbon receptor translocation into the nucleus. To characterize more completely the pathways involved in 5F-203 toxicity, cDNA microarrays were used to determine gene expression changes in MCF-7, a 5F-203–sensitive breast cancer cell line, after treatment with 1 μM 5F-203. The mRNA expression of CYP1A1 and CYP1B1 were both increased approximately 20-fold after 24 h, but less after 6 h of treatment, confirming previous results. However, the most pronounced drug-induced change was in the PLAB gene, encoding one of the bone morphogenic proteins in the transforming growth factor-β (TGF-β) superfamily. Other induced gene expressions included the apoptosis-initiating receptor TNFRSF6 (CD95/FAS), the DNA-damage response genes CDKN1A (p21/Cip1), p53-induced gene-3, and DNA binding protein 2. In contrast, the transcription factor c-Myc showed reduced expression. Western blot analysis also showed induction of p53 protein expression in response to 5F-203 treatment. In contrast to the MCF-7 data, MDA-MB-435, a cancer cell line resistant to 5F-203, showed no change in expression of any of these genes or the p53 protein under the same conditions of 5F-203 treatment. These data are consistent with the idea that CYP1A1 and CYP1B1 activation leads to 5F-203 toxicity through DNA damage-induced apoptosis, as well as signaling through a variant member of the TGF-β superfamily.
Interest in 2-(4-amino-3-methylphenyl) benzothiazole (DF-203, NSC 703786) as a potential anticancer agent was generated from the relative growth inhibitory response profile of the 60 cell lines that comprise the National Cancer Institute's (NCI) Anticancer Drug Screen (Bradshaw et al., 1998b). This response fingerprint, taken from a 48-h growth inhibitory assay, did not correlate via the computerized algorithm COMPARE (Paull et al., 1989) with the activity pattern of any clinically used class of chemotherapeutic agents, indicating a possible novel mechanism of action (Bradshaw et al., 1998a). Activity against breast and ovarian xenograft models (Shi et al., 1996, Bradshaw et al., 1998a) led to the selection of agents from this class as preclinical candidates, and the current lead candidate is a recently synthesized 2-(4-amino-3-methylphenyl) 5-fluorobenzothiazole (5F-203) (Hutchinson et al., 2001). This analog displays improved potency and pharmaceutical properties and has been shown to generate a cell-line response profile similar to that of the parent drug. Selective metabolism seems to underlie the activity profile of these drugs, because only drug-sensitive cell lines accumulate and biotransform these compounds. The major metabolic route in human cells involves CYP1A1-induced C-oxidation of the benzothiazole nucleus to form a 6-hydroxy metabolite that is inactive (Kashiyama et al., 1999, Chua et al., 2000). An active metabolite has not yet been identified. It has been demonstrated recently (Loaiza-Perez et al., 2002) that the parent benzothiazole increased CYP1A1 and CYP1B1 transcription in sensitive MCF-7 cells, accompanied by aryl hydrocarbon receptor translocation to the nucleus. Moreover, MCF-7 cells exposed to 14C-labeled 5F-203 covalently bound radioactivity to subcellular macromolecules in a manner not detected in drug-insensitive cells (Brantley et al., 2001), further implicating a metabolizing system unique to drug-sensitive cell lines.
Furthermore, water-soluble prodrugs have recently been synthesized by conjugation of alanyl- and lysyl-amide hydrochloride salts to the exocyclic primary amine function of 2-(4-aminophenyl) benzothiazoles. The prodrugs retain selectivity with significant in vitro growth inhibitory potency against the sensitive cell lines that are the same as those of their parent amine (Bradshaw et al., 2002).
The cDNA microarray is a technology that allows for the measurement of the relative abundance of mRNA in one sample compared with that of another. In a variety of cases, the profiling of patient tumors has led to the ability to distinguish between certain tumor populations determined by their expression profile, which by conventional means would be classified as the same type (Alizadeh et al., 2000). Moreover, this gene-profiling approach allows for the rapid determination of transcript abundance altered in direct response to drug treatment. Thus, to elucidate the mechanisms of action or identify the pathways involved in the selective toxicity of this compound, the 5F-203–sensitive breast cancer cell line MCF-7 and the insensitive cell line MDA-MB-435 were treated with the drug for 6 or 24 h, and relative gene expression changes were measured using cDNA microarrays from NCI's Advanced Technology Center. The resulting gene expression profiles were analyzed to provide insight into the molecular events that occurred in response to 5F-203 treatment. These data support the hypothesis that in MCF-7 cells, 5F-203 is activated via cytochrome P450, and the active metabolite interacts with DNA in a way that triggers DNA damage-response and apoptosis-inducing pathways. The additionally revealed involvement of a newly defined member of the transforming growth factor-β (TGF-β) superfamily (PLAB, nonsteroidal anti-inflammatory drug-activated gene [NAG-1], macrophage inhibitory cytokine [MIC-1], or placental transforming growth factor-β [PTGF-β]) confirms it as a drug-/stress-response gene possibly implicated in DNA damage-response or apoptosis. We also define up-regulation of ATF3, a repressor of cyclic-AMP responsive element-dependent transcription, indicating its involvement in the selective toxicity of 5F-203, as has been indicated with other DNA-damaging agents (Mashima et al., 2001).
Materials and Methods
Drugs and Cell Culture.
NSC 703786 was obtained from the drug repository of NCI's Developmental Therapeutics Program (Rockville, MD). The drug was prepared in 100% dimethyl sulfoxide at a concentration of 40 mM, stored as an aliquot, and kept frozen at −70°C until required. MCF-7 and MDA-MB-435 were obtained from NCI's Anticancer Drug Screening cell line panel (NCI Frederick, Frederick, MD; http://dtp.nci.nih.gov). Cells were maintained in RPMI 1640 medium supplemented with 5% fetal bovine serum and 2 mMl-glutamine (Cambrex Bio Science Walkersville, Walkersville, MD), referred to herein as “complete media”.
Microarray.
Human OncoChip (2.3 K and 6.5 K) arrays from the NCI/Center for Cancer Research (CCR) μArray Center were used according to the original protocols distributed by the NCI/CCR μArray Center (Gaithersburg, MD). Four different versions of arrays containing 2000 to 6400 gene transcripts were used over the course of these experiments, resulting in some lack of commonality of transcripts and sometimes even genes over the different arrays. For drug-incubation studies, approximately 10 million logarithmically growing cells were exposed to 1 μM 5F-203 in a T150 flask for the required time; then the medium was removed, and the cells were rinsed in situ and trypsinized for 5 min at 37°C. Cell pellets were rinsed in cold serum-containing medium and then cold phosphate-buffered saline, and they were formed into pellets at 600g at 4°C for 5 min. The supernatant was aspirated, and pellets were frozen at −70°C until required for RNA extraction. Total RNA was prepared from MCF-7 (5F-203–sensitive) and MDA-MB-435 (5F-203–insensitive) control or drug-treated cell pellets at approximately 6 μg/μl using the TRIzol reagent (Invitrogen, Carlsbad, CA) protocol. All samples were evaluated for purity by spectrophotometrically determining the A260/A280 ratio to be between 1.8 and 2.0. Moreover, all RNA samples were checked by 1.2% agarose and formaldehyde denaturing gel electrophoresis, and no contaminating DNA was visible. Equal amounts of sample RNA were reverse-transcribed with SuperScript II (Invitrogen) for 1 h. During this process, fluorescent dyes (Amersham Biosciences Inc., Piscataway, NJ) were incorporated into the samples: cyanine-3–labeled dUTP (1 nmol/μl) into the control samples and cyanine-5–labeled dUTP (1 nmol/μl) into the drug-treated samples and vice versa for confirmation of expression changes by reverse dye incorporation. Fluorescently labeled cDNA samples (50 μg of each) were then combined, filtered, and blocked, with the remaining sample (17.6 μl) transferred to a glass array by pipetting under a lifter slip. The cDNA was hybridized onto a microarray slide at 65°C for 16 h. Array slides were then washed 4 times for 2 min each in successively more dilute standard saline citrate buffer and centrifuged dry (500g for 5 min). Fluorescence was read on a GenePix 4000A microarray scanner (Axon Instruments Inc., Union City, CA) at a wavelength of 635 nm for the treated samples (Cy-5 fluorescence) and 532 nm for the control samples (Cy-3 fluorescence). Data were analyzed through GenePix Pro 3.0 software (Axon Instruments) and were pseudocolored as determined by the signal intensity, with green representing the Cy-3 intensity and red representing the Cy-5 intensity, such that equal expression of transcripts was represented by yellow. Thus, red-colored spots indicated up-regulation, and green-colored spots represented down-regulation of genes in the drug-treated sample compared with the untreated sample. For the reverse dye incorporation, a green spot was indicative of up-regulation, whereas a red spot indicated down-regulation of a gene in the drug-treated sample. The files were then uploaded to the NCI/CCS μArray Center mAdb Gateway (http://nciarray.nci.nih.gov) for storage, further analyses, and multiple array comparisons. Altered gene expression was calculated with use of the mAdb Gateway software suite from the different intensities of the two labeled cDNA samples. Equal fluorescence intensity represented equal gene expression in the two samples. Data are presented as the average increase/decrease in gene expression in drug-treated samples compared with untreated control cells from two independent samples that were tested on a total of at least three different arrays, resulting in an average ± S.D. calculated from more than three measurements.
Measurement of Drug-Induced Gene Expression by RT-PCR.
Drug-Treated Samples.
RT-PCR reactions for the quantitation of gene expression were measured with the TaqMan ABI Prism 7700 Sequence Detection System (Applied Biosystems, Foster City, CA) according to their published protocols. Total RNA (1 μg) was prepared (RNeasy Minikit; QIAGEN, Valencia, CA) from MCF-7 and MDA-MB-435 control cells or cells treated with 1 μM 5F-203 and then reverse-transcribed in a 50-μl reaction (TaqMan RT Reagents Kit; Applied Biosystems). Samples were frozen at −70°C until required. Two independent treatments and RNA isolations were made for each of the cell lines, and data from one experiment with MCF-7 are shown in Fig.3.

Gene expression changes in MCF-7 cells treated with 1 μM 5F-203 over 24 h, measured by TaqMan real-time PCR. Cells were grown and treated in microtiter plates, and then total RNA was isolated using the RNeasy 96 kit (QIAGEN). Samples were analyzed as described under Materials and Methods. A, CYP1A1(
 ) and CYP1B1 (■) gene expression over time, measured in quadruplicate wells from a single experiment (±S.D.). B, PLAB expression over time, measured in quadruplicate from a single experiment ± S.D. (
 ) over the 24-h period.
Constitutive Expression of PLAB.
The 60 cell lines of the NCI anticancer drug screen were incubated overnight at 37°C in 96-well microtiter plates in 100 μl of complete media and then treated with 100 μl of 5F-203 to give a final concentration of 1 μM, or complete media, for 24 h. Total RNA was isolated using the RNeasy 96 kit (QIAGEN) and the QIAvac vacuum manifold (QIAGEN). Total RNA samples were quantitated and stored at −70°C until used for RT-PCR. Measurement of the constitutive expression of the PLAB gene in each cell line was normalized to the endogenous control, GAPDH, and then expressed relative to a calibrator cell line (CCRF-CEM). These data were then expressed as a “mean graph” (Paull et al., 1989), in which the average expression was subtracted from each individual cell line expression and then expressed relative to the central mean line. Cell lines deflected to the left represent those cells with lower-than-average expression, whereas those deflected to the right represent higher-than-average expression (Fig. 4). The relative values for PLAB expression were entered into the COMPARE site on the NCI DTP website (http://dtp.nci.nih.gov), and this expression profile was compared with their profiles of drug responses and molecular target expressions made publicly available by the COMPARE algorithm (Paull et al., 1989). This correlative program provided a list of the best correlated profiles in the various databases (Zaharevitz et al., 2002) and an associated Pearson correlation coefficient enabled an assessment of the value of possible similarities with other targets or drug responses.
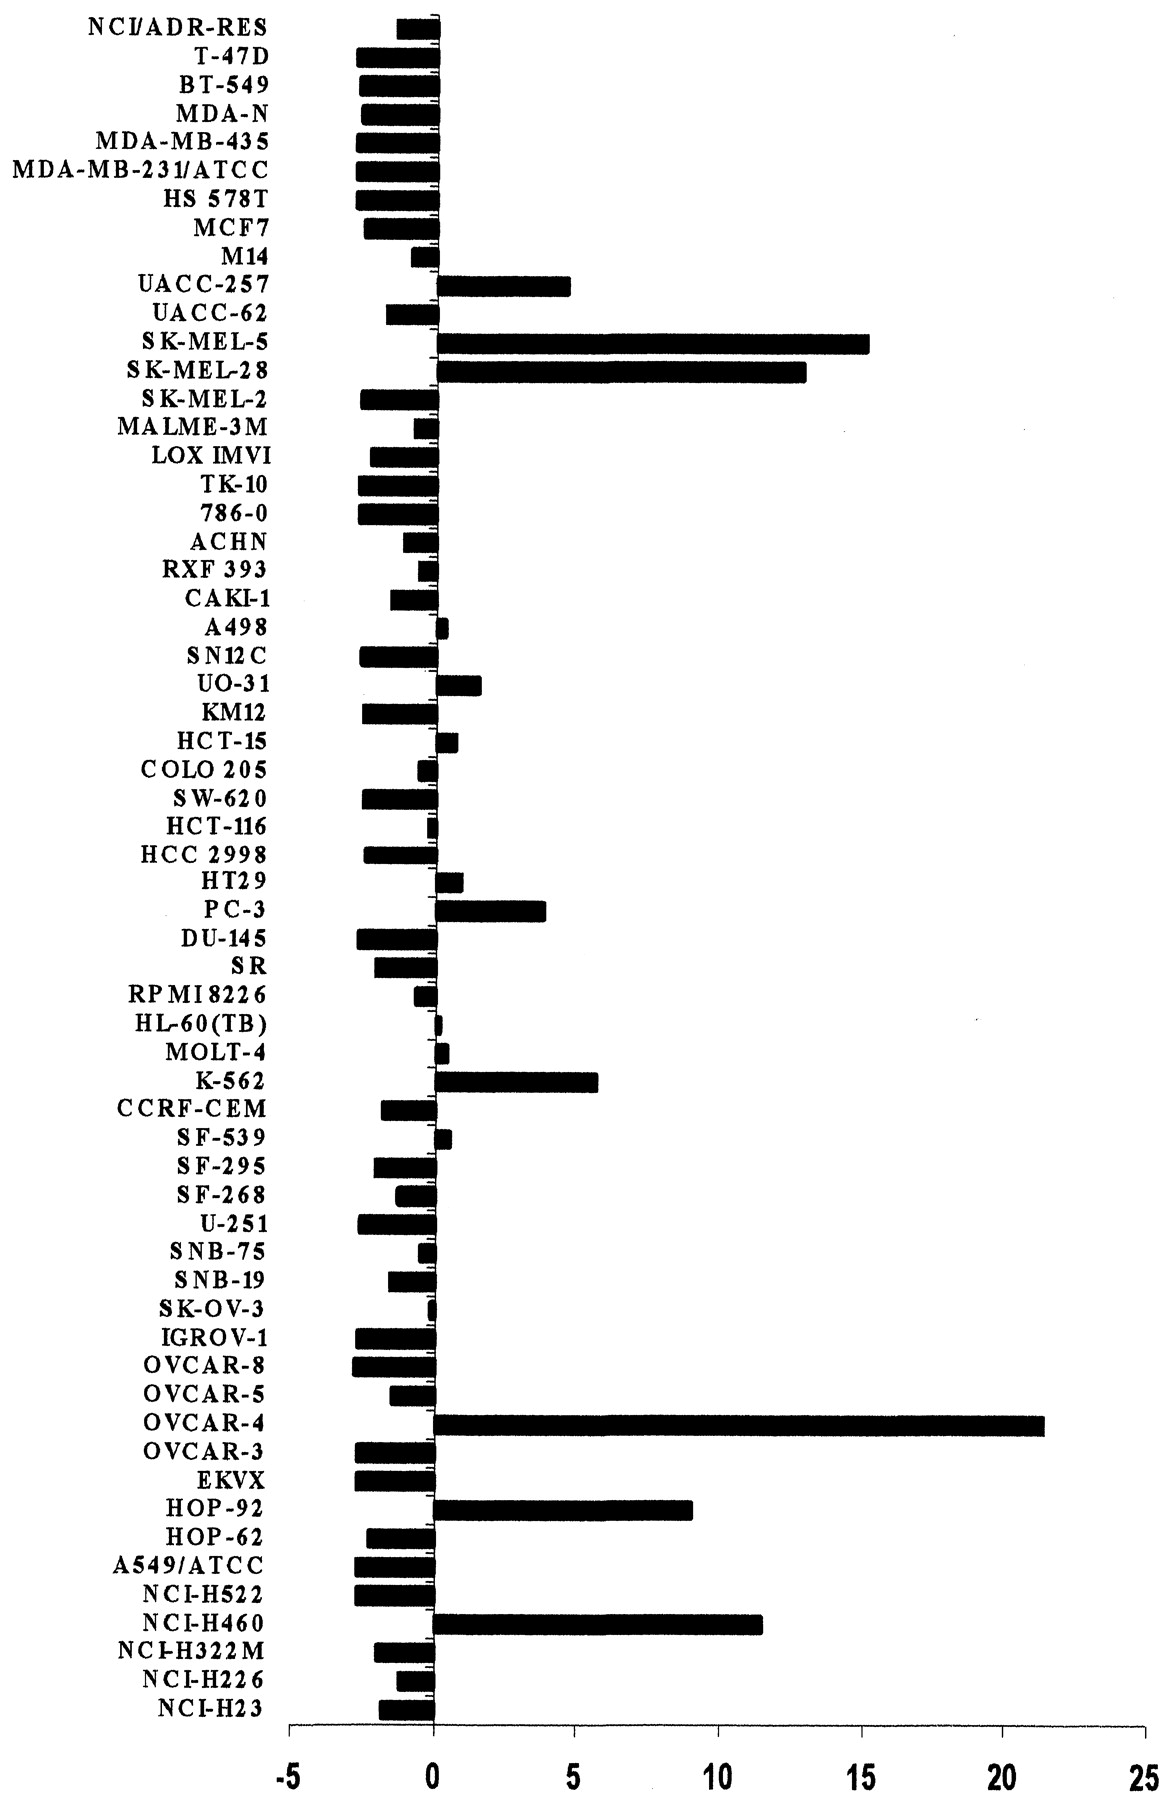
Relative gene expression of PLAB in 60 cell lines. The constitutive expression of PLAB from 60 cell lines was measured by TaqMan real-time RT-PCR using GAPDH as an endogenous control. Expression was normalized to expression in a calibrator cell line (CCFR-CEM). Data are represented in a mean graph format in which average expression was subtracted from each individual cell line expression and then expressed relative to the central mean line. Cell lines deflected to the left represent those cells with lower-than-average expression, whereas those deflected to the right represent higher-than-average expression.
Quantitative RT-PCR.
Primers and probes for CYP1A1, CYP1B1, and PLAB were designed with Primer Express software (Applied Biosystems) from the appropriate gene bank sequences for the human gene. For human CYP1A1 mRNA (accession number NM000499), the forward primer is GATTGGGCACATGCTGACC, the reverse primer is CTGTCAAGGATGAGCCAGCA, and the probe is FAM-TGGGAAAGAACCCGCACCTGGC-TAMRA. For human CYP1B1 mRNA (accession number NM000104), the forward primer is TTTCGGCTGCCGCTACA, the reverse primer is ACTCTTCGTTGTGGCTGAGCA, and the probe is FAM-ACGACGACCCCGAGTTCCGTGAG-TAMRA. For human PLAB mRNA (accession number XM038098), relative expression was measured using TaqMan one-step RT-PCR SYBR green PCR master mix, rather than a labeled probe, with the forward primer AAACATGCACGCGCAGATC, and the reverse primer TCGGTCTTTTGAATGAGCACC. The primers and probe for GAPDH, the endogenous control, were from a GAPDH human control reagent kit (Applied Biosystems). Primer and probe concentrations were 300 nM for CYP1A1 and CYP1B1, 900 nM for PLAB, and 100 nM for GAPDH. Thermocycler parameters were set at 30 min at 48°C, 10 min at 95°C, 40 PCR cycles of 15 s at 95°C, and 1 min at 60°C. All RNA samples were tested in quadruplicate PCR reactions for each RNA isolation and included minus reverse transcriptase and no template control samples with each experiment. Data were analyzed using the comparative cycle threshold (CT) method (User Bulletin no. 2, 1997, ABI Prism 7700 Sequence Detection System; Applied Biosystems). Constitutive expression of PLAB was normalized to the endogenous control, GAPDH, and then expressed relative to a calibrator cell line (CCRF-CEM). To validate the use of the ΔΔCTmethod, standard curves were initially generated for target genes and GAPDH (1–10 ng of cDNA/reaction), demonstrating that the efficiency of target and reference gene amplifications were approximately equal, and when plotted against each other the slope of the line was <0.1.
Western Blots.
Proteins were measured using standard Western blot techniques. Protein lysates were made from cells treated with 1 μM 5F-203 for up to 24 h and untreated control cells, and total protein was measured at 595 nm of absorbance using the Bio-Rad protein assay (Bio-Rad, Hercules, CA). Protein (20 μg) was loaded onto 10% Tris/glycine gel and electorphoresed at 100 V (constant voltage) for 2.5 h, and then it was electrotransferred for 1.5 h at 25 V. Blots were blocked overnight in 3% bovine serum albumin at 4°C and then incubated with primary antibody for 1 h. All primary antibodies were monoclonal antibodies, with p53 (1:500) and CDKN1A (p21/Cip1) (1:500) from BD Transduction Laboratories (Lexington, KY) and CD95/FAS (1:2500) and c-Myc (1:100) antibodies from Santa Cruz Biotechnology, Inc. (Santa Cruz, CA). Blots were rinsed with Tris-buffered saline/Tween 20 and incubated with peroxidase-conjugated secondary antibody (anti-mouse IgG-HRP; Santa Cruz Biotechnology) for 30 min at room temperature. Bands were developed for visualization using enhanced chemoluminescence (Amersham Biosciences).
Results
Figure 1 shows genes identified from the arrays in which gene expression (average of transcripts in whichn > 3) was increased or decreased more than 3-fold in cells treated with 1 μM of the drug 5F-203 for 6 h (Fig. 1A) and 24 h (Fig. 1B) compared with control cells cultured under identical conditions in the absence of drug treatment. The dose and times for drug incubations were selected with the use of published information regarding 5F-203 induction of CYP1A1 protein expression, (Hutchinson et al., 2001) and maximal induction of 6-hydroxylase activity (Chua et al., 2000). Three of the most highly induced genes after drug treatment, CYP1A1, CYP1B1, and PLAB (MIC-1/NAG-1/PTGF-β), were common to the 6- and 24-h drug treatments, but none of the remaining genes showed differential expression that met the criteria after both the short- and long-term treatments. In Fig. 1B, PLAB appears twice, indicating two different transcripts representing this gene on the arrays, and as expected, they showed a similar magnitude of induction (24-fold and 19-fold, respectively). A comparison of the data from 6 and 24 h of treatment indicated there were fewer genes (12) that reproducibly showed differential expression after 6 h of treatment, whereas 29 genes show altered expression after 24 h of drug treatment. Moreover, after 24 h of drug treatment, 12 genes were apparently induced by up to 25-fold, whereas 17 genes were apparently down-regulated between 3- and 8-fold. This indicates, not unexpectedly, that the up-regulation of gene expression was often of a greater magnitude than the down-regulation of constitutively expressed genes. Table 1 shows a key of the genes that were altered by drug treatment in the drug-sensitive cell line MCF-7, ordered according to Fig. 1. The table indicates their common names and, when possible, divides them into functional groupings, including DNA damage-response genes, apoptosis genes, cell-cycle control genes, signaling genes, and those involved in transcription. MDA-MB-435, an insensitive breast cancer cell line, showed no gene expression changes that met these criteria, indicating that all the changes are unique to the drug-sensitive cell line.

Gene expression changes, measured by cDNA microarray, in MCF-7 cells after 6 h (A) and 24 h (B) of treatment with 1 μM 5F-203. Gene expression changes were measured as >3-fold increase or decrease in at least three separate arrays (±S.D.) representing two independent samples. Fold change in gene expression is defined as an increase or decrease in gene expression measured by comparative hybridization on cDNA microarrays in drug-treated cells relative to control cells handled in the same manner in the absence of drug. RNA was extracted with TRIzol reagent, and then fluorescent dyes were incorporated during reverse transcription to cDNA. Equal amounts of the labeled cDNA from control and drug-treated samples were hybridized onto transcripts on microarray slides, and relative intensity of signals was measured.
Gene description and ontology for genes altered after incubation of MCF-7 cells with 1 μM 5F-203
Figure 2 shows Western blots confirming an increase of protein expression with time of p21/Cip1 and CD95/FAS and decreased protein expression for c-Myc after drug treatment that complements the measurement of altered gene expression. Furthermore, as with the arrays, these changes were not seen with the insensitive cell line MDA-MB-435. In addition, Fig. 2 shows p53 protein induction, which would be predicted from the induction of p21/Cip1, but because it is post-transcriptionally modified through increased stabilization of the p53 protein after DNA damage (Blattner et al., 1999), it was not reflected at the level of gene expression.

Western blot analysis of protein expression derived from genes identified as showing altered expression after treatment with 5F-203. MCF-7 and MDA-MB-435 cells were treated in tissue culture flasks with 1 μM 5F-203 for up to 24 h, and one flask of cells was lysed for each time point to determine expression of p53, p21/Cip1, CD95/FAS, and c-Myc in 20 μg of total protein as described underMaterials and Methods.
Using real-time PCR (TaqMan), a time course for the induction of the most highly altered genes are shown in Fig.3. The data members of the cytochrome P450 family (CYP1A1 and CYP1B1) are shown from a representative single experiment in Fig. 3A, and PLAB gene expression changes over time are shown in Fig. 3B. These data reflect independently treated and extracted RNA samples from those used for the microarray analysis. These genes all showed increased expression levels for up to 24 h, with all being less highly expressed after 6 h, which corroborates the results from the microarrays.
The induction of PLAB in response to 5F-203 was unexpected. To clarify the possible significance of this finding, constitutive expression of PLAB was measured in all 60 cell lines of the NCI screen to determine whether expression of this gene was associated with sensitivity to the toxicity of apoptosis-inducing drugs. Figure4 shows the expression level of this gene in the 60 cell lines and indicated that a few of the cells have relatively elevated expression of this gene. As expected, these are not the cell lines that are sensitive to the drug 5F-203. This response pattern was compared with patterns of cell-growth inhibition by compounds or with measurements of other molecular entities (such as gene expression) measured in the cell lines of the NCI screen using the publicly available COMPARE program (Zaharevitz et al., 2002) on the DTP website (http://dtp.nci.nih.gov). This program was used to determine whether any patterns of drug response or other molecular target patterns were correlated with constitutive gene expression of PLAB, but none of the resulting correlations reached a level of statistical significance.
Discussion
It is anticipated that cDNA microarray technology may facilitate the determination of the mechanisms of action for empirically discovered drugs. The mRNA expression profile of a drug-treated population of cells can readily be compared with untreated control cells to reveal those genes that have undergone a change in direct response to drug treatment.
The aim here was to survey 5F-203–modulated genes in a drug-sensitive cell line and use this information to help determine a mechanism of action, or targets, that might aid its progress to the clinic. Using parameters that required >3-fold increase or decrease in expression, in three or more arrays (from two different samples) a total of 12 genes met these criteria in MCF-7 after treatment with 5F-203 for 6 h, whereas 29 genes met these criteria after 24 h of drug treatment. The three most highly induced genes, two isozymes of the P450 metabolizing family of genes, CYP1A1 and CYP1B1, plus a newly defined, variant member of the TGF-β family of proteins, PLAB, were the only altered genes found in common after both 6 h and 24 h of drug incubation. Real-time PCR was used to corroborate the altered expression levels of these three genes, and the results confirmed that increased expression was observed after 3 to 6 h and continued to increase up to 24 h. In contrast, several genes met the minimum criteria for altered gene expression after 6 h of incubation with 5F-203 but were not altered after 24 h. These genes might present an early response that is not sustained for 24 h, as seems to be the case with several genes showing altered response after doxorubicin treatment for up to 15 h (Kudoh et al., 2000). In that report, certain measurements including those of cytochromec, a transcription factor, cyclin D2, a gene involved in proteolysis, and ataxin 2 peaked in expression between 5 and 10 h after treatment but decreased in expression during the subsequent 5 to 10 h. Further studies should evaluate the kinetics of the gene responses in Fig. 1A. It is important to note that none of these gene expression changes, or any others, were reflected in the drug-insensitive breast cancer cell line MDA-MB-435 when subjected to the same drug treatment.
In 5F-203–treated MCF-7 cells, induction of CYP1A1 and CYP1B1 gene expression is in accordance with previous data that have implicated P450 metabolism by CYP1A1 as an essential activation step in the toxicity of this drug. Although the role of CYP1B1 has not been fully determined, it does not seem to be an essential component for activity of 5F-203 (Chua et al., 2000).
The induction of p53 protein and DNA damage-response genes, CDKN1A (p21/Cip1), p53-induced gene-3, TNFRSF6 (CD95/FAS), and DNA binding protein 2 with down-regulation of MYC predicts that the cell is responding to DNA damage. In fact, DNA adducts have recently been identified exclusively in drug-sensitive cell lines after 5F-203 drug treatment (Stevens et al., 2001). In addition, two of the induced genes, FRA1 and ATF3, have been identified as irradiation-responsive (IR) genes, showing a p53-associated component to their IR-induction (Amundson et al., 1999). However, in contrast to IR response, neither MDM2 nor BAX was measured as induced by 5F-203. ATF3 is a member of the bZip family of transcription factors (Hai and Hartman, 2001) and is a stress-inducible gene, with a predominance of data indicating that its induction correlates with cell injury leading to a detrimental outcome, and it has been reported to accelerate drug-induced apoptosis and enhance caspase protease activation (Hai et al., 1999; Mashima et al., 2001).
The dramatic increase of PLAB, a gene that encodes a divergent member of the TGF-β superfamily, is interesting and perhaps telling about the possible mechanism by which death is induced in these cells. PLAB is a relatively newly identified gene that shares the same sequence as other genes given alternate names (none yet adopted by the Human Genome Organization), including PTGF-β, MIC-1, growth/differentiation factor 15, and NAG-1. These genes have been identified as encoding a proapoptotic and antitumorigenic protein that can be regulated by COX-1 inhibitors (Baek et al., 2001). This gene is abundant in placenta and prostate, with significant expression in colon and kidney tissue (Paralkar et al.,1998) and the choroid plexus, in which it was identified as a novel neurotrophic factor (Strelau et al., 2000). This gene has also been reported to be induced in macrophages in response to a number of different activation agents, and the protein product is cleaved and then secreted as a 25-kDa disulfide-linked dimeric protein (Fairlie et al., 1999). As PTGF-β, it was implicated as a downstream target of both p53-dependent and p53-independent DNA damage pathways in breast cancer cell lines (Pei-Xiang et al., 2000). Thus, because PLAB seems to be up-regulated in response to 5F-203 in a p53-dependent manner, because of the increase in p53 protein and CDKN1A, it is implicated as a positive mediator of apoptosis in the MCF-7 cells.
Although PLAB has been identified as a divergent member of the TGF-β superfamily, there was no evidence from these data that the TGF-β signaling pathway was activated. There was an apparent down-regulation of SMAD-3 gene expression after 6 h, but this was not seen after 24 h. SMAD-3 is a receptor-regulated SMAD whose binding to the SMAD-binding DNA element is a critical event for transcriptional activation (Nakao et al., 1997). In contrast, SMAD-6, an inhibitory SMAD (Imamura et al., 1997), was shown to be induced approximately 3-fold after 24-h drug incubation. These data are not consistent with the conclusion that PLAB signaling under these conditions is mediated through the conventional TGF-β signaling pathway. However, FOS-like antigen 1 (FRA-1), a member of the activator protein-1 transcription factor family, was induced after 24 h of treatment with 5F-203, and previous data have linked TGF-β–stimulated cells with enhanced protein DNA binding to the activator protein-1 complex, with an augmented contribution by FRA-1 (Tang et al., 1998).
Interest in the PLAB gene led to the evaluation of its constitutive expression in the 60 cell lines of the NCI drug screen (Fig. 4). Several cell lines express high levels of this gene, particularly two melanoma, two lung, and an ovarian line. However, when this pattern was used as a seed in the COMPARE program on the DTP website (http://dtp.nci.nih. gov), there was no correlation with toxicity patterns for any individual or group of drugs, including those known to induce apoptosis. This indicates that an elevated level of constitutive expression of the PLAB gene does not yield an enhanced sensitivity to apoptosis-inducing agents. Moreover, none of the patterns of gene or protein expression in the molecular target and microarray databases were similar enough to be significantly correlated to the expression pattern of the PLAB gene. It was interesting that protein expression of several heat shock proteins (HSC70, GRP75, and HSP60), although weakly correlated, were among the best inversely correlated patterns. This evokes the possibility that in nonstressed cells, heat shock stress-response genes, generally found to protect against apoptosis (Pirkkala et al., 2001), may be inversely regulated to the apparently proapoptotic gene PLAB.
Thus, these genotoxic responses to this drug allow us to postulate that MCF-7 cells metabolize 5F-203 to a toxic metabolite that binds to DNA. This sets into motion a series of events that leads to apoptosis in these cells via an unusual signaling mechanism through a TGF-β superfamily variant member that does not seem to signal through the conventional TGF-β signaling pathway. Moreover, as a paracrine effector, the induction of PLAB (MIC-1, PTGF-β, NAG-1) increases the possibility of monitoring the protein product in the circulatory system as a marker of patient sensitivity or tumor response.
Footnotes
- Received August 14, 2002.
- Accepted December 17, 2002.
-
This work was supported by NCI contract number N01-C0-12400.
-
The content of this publication does not necessarily reflect the views or policies of the Department of Health and Human Services, nor does mention of trade names, commercial products, or organization imply endorsement by the U.S. Government.
Abbreviations
- NSC 703786
- 2-(4-amino-3-methylphenyl) benzothiazole (DF-203)
- NCI
- National Cancer Institute
- 5F-203
- 2-(4-amino-3-methylphenyl)-5-fluorobenzothiazole
- IR
- irradiation responsive
- GAPDH
- glyceraldehyde-3-phosphate dehydrogenase
- PCR
- polymerase chain reaction
- RT
- reverse transcription
- TGF-β
- transforming growth factor-β
- PTGF-β
- placental transforming growth factor-β
- DTP
- Developmental Therapeutics Program
- ATF3
- activating transcription factor 3
- PLAB
- prostate differentiation factor
- NAG-1
- nonsteroidal anti-inflammatory drug-activated gene
- MIC-1
- macrophage inhibitory cytokine
- U.S. Government


