


Abstract
The UDP-glucuronosyltransferase (UGT) enzyme `superfamily' contributes to the metabolism of a myriad of drugs, nondrug xenobiotic agents, and endogenous compounds. Although the individual UGT isoforms exhibit distinct but overlapping substrate selectivities, structural features of substrates that confer selectivity remain largely unknown. Using methods developed for pharmacophore fingerprinting combined with optimization and pattern recognition techniques, subsets of pharmacophores associated with the substrates and nonsubstrates of 12 human UGT isoforms were selected to generate predictive models of substrate selectivity and to elucidate the chemical and structural features associated with substrates and nonsubstrates. For all 12 UGT isoforms, the pharmacophore model generated showed predictive ability, as determined by a test set comprising 30% of the available data for each isoform. Models for UGT1A6, -1A7, -1A9, and -2B4 displayed the best predictive ability (>75% of test set predicted correctly) and were further analyzed to interpret the pharmacophores selected as important. The individual pharmacophores differed among isoforms but generally represented relatively simple structural and chemical features. For example, an aromatic ring attached to the nucleophilic group was found to increase the likelihood of glucuronidation by UGT1A6, UGT1A7 and UGT1A9. A large hydrophobic region close to the nucleophile and a hydrogen bond acceptor 10 Å from the nucleophile were found to be common to most UGT2B4 substrates. The pharmacophores further suggest that the environment immediately adjacent to the nucleophilic site of conjugation is an important determinant of metabolism by a particular UGT.
UDP-Glucuronosyltransferase (UGT) catalyzes the covalent linkage or `conjugation' of glucuronic acid, derived from cofactor UDP-glucuronic acid, to a typically lipophilic substrate containing a suitable acceptor functional group (most commonly hydroxyl, carboxyl, or amine) according to a second-order nucleophilic mechanism (Radominska-Pandya et al., 1999). UGT has the capacity to metabolize a myriad of structurally diverse compounds, including drugs from all therapeutic classes, dietary chemicals, environmental pollutants, endogenous compounds (e.g., bile acids, bilirubin, and hydroxysteroids), and the products of phase I metabolism (Miners and Mackenzie, 1991; Radominska-Pandya et al., 1999; Tukey and Strassburg, 2000).
Like other drug metabolizing enzymes that exhibit broad substrate selectivity (particularly cytochrome P450), UGT exists as an enzyme superfamily (Mackenzie et al., 1997; Tukey and Strassburg, 2000). The various UGT gene products (`isoforms') have been classified into two families, UGT1 and UGT2, based on amino acid sequence identity. cDNAs encoding 16 UGT proteins have been isolated to date: UGT 1A1, 1A3, 1A4, 1A6, 1A7, 1A8, 1A9, 1A10, 2B4, 2B7, 2B10, 2B11, 2B15, 2B17, and 2B28. Available evidence suggests that the individual UGT isoforms exhibit distinct substrate selectivities but often have significant overlap (Radominska-Pandya et al., 1999; Tukey and Strassburg, 2000; Sorich et al., 2003). Numerous factors, including genetic polymorphism and metabolic drug interactions, are known to influence UGT activity in vivo; hence, the metabolic clearances of glucuronidated compounds may vary considerably (Miners and Mackenzie, 1991; Tukey and Strassburg, 2000).
Undesirable pharmacokinetic properties are a significant cause of failure in new drug development, and drug interactions and impaired clearance caused by genetic polymorphism are important in this regard (Ekins et al., 2000; Ingelman-Sundberg, 2001). Moreover, knowledge of drug interactions, genetic polymorphism and other factors altering metabolic clearance is important for rationalising and optimizing dosage regimens of established drugs, thereby improving therapeutic outcome. Reaction phenotyping [i.e., identification of the isoform(s) responsible for the metabolism of a compound] allows qualitative prediction of factors altering metabolic clearance in vivo (Miners et al., 1994). In the case of cytochrome P450-catalyzed drug biotransformation, reaction phenotyping is readily achieved in vitro using kinetic and inhibitor approaches (Miners et al., 1994; Rodrigues, 1999). However, in vitro reaction phenotyping of glucuronidated compounds is less advanced because of the limited availability of UGT isoform selective substrates and inhibitors (Miners et al., 2004).
Computational (in silico) techniques provide an alternative to in vitro reaction phenotyping (Ekins et al., 2000; Miners et al., 2004). Unlike cytochrome P450, an X-ray crystal structure is currently unavailable to permit the generation of UGT homology models, and in silico modeling has therefore focused on the structures of UGT substrates. Two- and three-dimensional (2D- and 3D-) quantitative structure activity relationships and pharmacophore models have recently been developed in this laboratory to infer the active site binding requirements for UGT1A isoforms (Sorich et al., 2002; Smith et al., 2003a,b). The UGT1A1 and UGT1A4 models demonstrated useful predictive capability. However, difficulty in generating sufficient high-quality data, atypical glucuronidation kinetics, and possible multiple binding orientations of substrates within the UGT active site currently limit this approach (Miners et al., 2004).
Models were also generated from a database of known substrates and nonsubstrates of UGT isoforms using 2D descriptors and the application of pattern recognition techniques based on classification algorithms (Sorich et al., 2003). Although the predictivity of these models is very good, they provide little insight into the structural features of substrates that confer isoform selectivity because the 2D descriptors generally lack physicochemical interpretation. In contrast, pharmacophores based on the 3D-chemical features associated with activity provide an intuitive method for modeling chemical-protein interactions but, as noted above, pharmacophore modeling is generally limited by the assumption of a unique mode for substrate binding. Many substrates and inhibitors of UGT isoforms exhibit atypical kinetic behavior that may be interpreted as involving multiple substrate binding sites or conformations (Miners et al., 2004). Furthermore, UGTs can generate multiple metabolites from a single polyfunctional chemical, which also implies multiple binding modes and/or sites. Thus, at least for some isoforms, multiple pharmacophores may be required to model metabolism by UGT. Although algorithms for multiple pharmacophore perception exist (Chen et al., 1999; McGregor and Muskal, 1999; Penzotti et al., 2002), they are generally used for chemical database searching rather than accurate prediction of chemical properties.
This report represents the first application of multiple pharmacophore analysis to a drug metabolizing enzyme. Using methods developed for pharmacophore fingerprinting combined with optimization and pattern recognition techniques, subsets of pharmacophores associated with the substrates and nonsubstrates of human UGT isoforms were selected to generate predictive models of substrate selectivity. Importantly, the approach additionally provides insights into the structural features of substrates associated with the molecular recognition by certain UGTs.
Materials and Methods
Data Sets. Twelve isoform-specific data sets were collated from data in the public domain, as described previously (Sorich et al., 2003). The data sets list compounds confirmed as substrates and nonsubstrates of the human UGT isoforms for which a significant number of substrates have been identified (i.e., UGT 1A1, 1A3, 1A4, 1A6, 1A7, 1A8, 1A9, 1A10, 2B4, 2B7, 2B15, and 2B17) and ranged in size from 55 to 216 chemicals for each isoform. Data were abstracted from studies that investigated glucuronidation of the chemicals in an assay using a recombinant cell line expressing a single UGT isoform. The studies generally employed the radiometric thin layer chromatographic procedure of Bansal and Gessler (1980) for detection of glucuronide formation. The majority of chemicals tested on more than one occasion were found to have consistent classification. Chemicals were excluded from the data set when conflicting inter-study variability was observed unless the reason for the discrepancy could be determined.
Assessment of Predictive Performance. The ability of the pharmacophore models to predict glucuronidation of a compound by a given isoform (i.e., generalization performance) was estimated using a test set comprising 30% of each data set. Numbers of compounds used in test sets were: UGT1A1, 61; UGT1A3, 53; UGT 1A4, 54; UGT1A6, 58; UGT1A7, 20; UGT1A8, 34; UGT1A9, 64; UGT1A10, 46; UGT2B4, 42; UGT2B7, 63; UGT2B15, 42; and UGT2B17, 16. The test (and training) set contained chemicals of diverse structure, although almost 50% of the compounds in the UGT2B4 data set were hydroxysteroids. The test set chemicals for each isoform were identical to those used to assess the performance of 2D chemical descriptors (Sorich et al., 2003). Test sets were not used in any way to influence the training and selection of models. The generalization ability of the models was expressed as the percentage of test set chemicals (substrates and nonsubstrates) that were correctly predicted.
Chemical Feature Identification. Features likely to be important in chemical-protein interactions were identified for each molecule. Standard definitions were used for hydrogen bond donors and acceptors, positive and negative charged centers, and aromatic rings (Wang and Zhou, 1999). Hydrophobic features were identified by the following method: 1) all hydrophobic atoms in the chemical were identified (Wang and Zhou, 1999); 2) all paths of length two connecting hydrophobic atoms were determined; 3) a hydrophobic center was placed as the center of the three hydrophobic atoms in each path; and 4) the largest subset of hydrophobes separated by a distance greater than 1 Å were retained to minimize the number of redundant features. A nucleophile feature was defined to identify potential sites of glucuronidation, including phenol, hydroxyl, carboxylic acid and amine groups, and aromatic nitrogens (Smith et al., 2003b). Feature identification was implemented in Python, using SMARTS substructure searching available in the Frowns chemical toolkit (http://frowns.sourceforge.net/)
Sampling of Chemical Conformers. Chemical structures for the chemicals in the 12 data sets were constructed using ChemDraw (CambridgeSoft, Cambridge, MA). The Catalyst software suite (Accelrys Inc., San Diego, CA) was used to sample a maximum of 255 representative conformations for each chemical, all within a 20 kcal/mol range of the minimum energy conformation.
Generation of Pharmacophore Fingerprints. A pharmacophore is defined by a set of chemical features and interfeature distances. A pharmacophore fingerprint is a binary string defining those pharmacophores, among a collection of many thousands of predefined two-, three- or four-featured pharmacophores, that can map to a molecule. In this study, the pharmacophore interfeature distance bins were of 1-Å width and ranged from 0.5 to 1.5 Å to 13.5 to 14.5 Å. For each molecule, all the sampled conformations were searched for each possible combination of features and interfeature distances (i.e., all potential pharmacophores) using in-house software implemented in the Python and C++ languages.
Model Generation from Pharmacophore Fingerprints. For each isoform, pharmacophore fingerprints of substrates and nonsubstrates were compared to determine the pharmacophores capable of distinguishing between substrates and nonsubstrates. Three different models were generated from the pharmacophore fingerprints. The flow diagram in Fig. 1 illustrates the strategy employed to generate predictive models for each UGT isoform. First, pharmacophores that were not present in at least 30% of substrates or nonsubstrates were removed. The remaining pharmacophores were used with the partial least-squares discriminant analysis (PLSDA) methodology (Wold et al., 1984) to generate the first model. PLSDA was implemented in Python using the SAMPLS algorithm (Bush and Nachbar, 1993). The number of latent variables used in the model was chosen to maximize the training-set, leave-30%-out, cross-validation percentage predicted correct (i.e., the test set was not used to choose the number of latent variables). Pharmacophores that did not contain a nucleophile feature were subsequently removed and the remaining pharmacophores were analyzed as described above to generate the second model. The third model was generated using k-means clustering (http://bonsai.ims.u-tokyo.ac.jp/~mdehoon/software/cluster/index.html) and a genetic algorithm (http://www.scipy.org) to select a small diverse subset of pharmacophores that predicted glucuronidation optimally. In the first step, k-means clustering (using Euclidean distance) was used to separate the pharmacophores into five clusters. The best pharmacophore was chosen from each cluster based on the value of the unpaired t test. A genetic algorithm (population of 20 and 15 generations) was subsequently employed to select the subset of the five pharmacophores that gave the best leave-30%-out (average of 30 repetitions) cross-validated percentage predicted correct using PLSDA. The process was then repeated using five additional clusters (i.e., the pharmacophores were divided into 10 clusters in second iteration). The iteration was terminated when the cross-validated percentage correct did not improve over the previous iteration.

Method used to generate the three models for each UGT isoform from the pharmacophore fingerprints of known substrates and nonsubstrates. PC, pharmacophore.
Results
All three pharmacophore models (Fig. 1) predicted the test sets of all 12 UGT isoforms (Table 1) better than expected by chance. The average predictive ability was greatest for the pharmacophore methodology, which involved clustering and genetic algorithm selection of pharmacophores containing a nucleophile feature (model 3). Models generated using the cluster-genetic algorithm methodology that were capable of predicting greater than 75% of their respective test set (UGT 1A6, 1A7, 1A9, and 2B4) were further analyzed to gain insight into the features influencing substrate binding and isoform selectivity.
Percentage of test set predicted correctly for each UGT isoform using three different multiple-pharmacophore methods
UGT1A6. The model generated to predict glucuronidation by UGT1A6 is described by the equation: Substrate likelihood = –0.09 + (0.33 × P1) – (0.32 × P2) – (0.25 × P3), where P1 to P3 have a value of either 1 or 0 depending on whether the pharmacophore is present or absent, respectively, in any given chemical. Values of substrate likelihood >0 predict that the compound is a substrate, whereas values <0 predict that a compound is a nonsubstrate.
This model was capable of predicting 78% of the test set of 58 chemicals correctly. Nonsubstrates in the test set were predicted marginally better than the substrates (80% versus 72%). The first pharmacophore (P1), which was present in more substrates than nonsubstrates, described a nucleophile approximately 2 Å from an aromatic ring. This simple pharmacophore generally mapped to chemicals where the nucleophile was directly attached to an aromatic ring (see P1 in Fig. 2), such as phenolic or aniline like functional groups. The second pharmacophore (P2) described two hydrophobic regions, one close to the nucleophile feature (2 Å) and the other distant to the nucleophile feature (6 Å). The presence of this pharmacophore in a chemical lowered the probability that it would be glucuronidated by UGT1A6. The final pharmacophore (P3) was also associated with nonsubstrates and contained hydrophilic and hydrophobic regions 6 and 8 Å from a nucleophile, respectively.
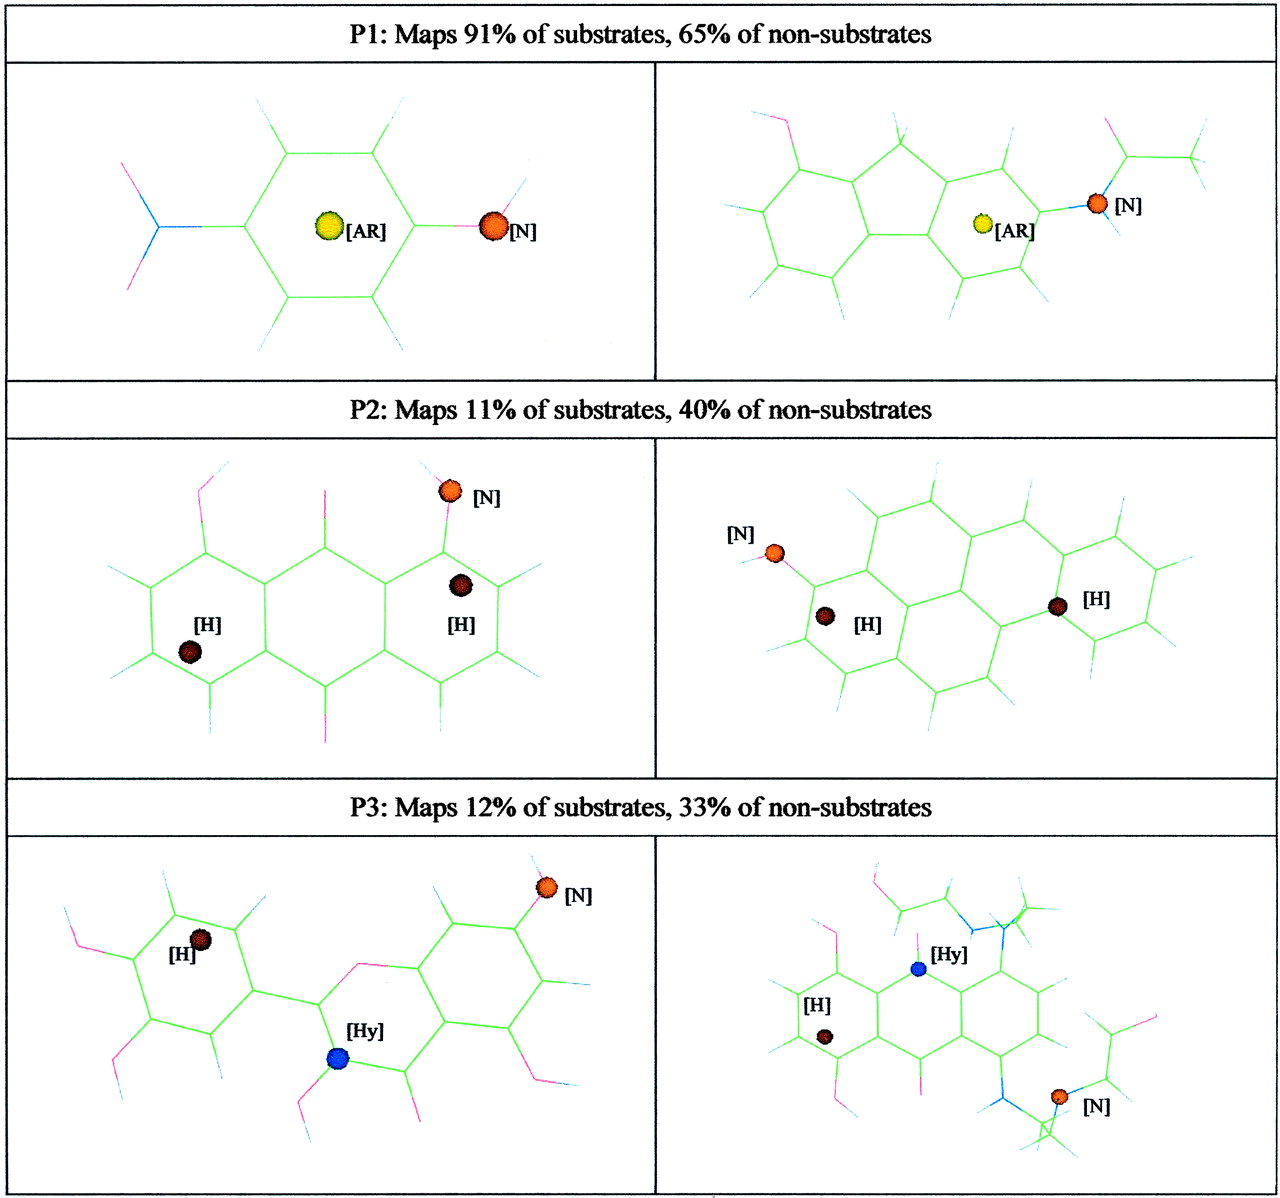
Pharmacophores that predict UGT1A6 substrate selectivity overlaid on selected chemicals. Nucleophile (N), orange; Hydrophobe (H), brown; Aromatic Ring (AR), yellow; Hydrophile (Hy), blue
UGT1A7. The UGT1A7 model similarly consisted of three pharmacophores, one associated with substrates and the other two with nonsubstrates. Substrate likelihood = –0.11 + (0.34 × P1) – (0.25 × P2) – (0.23 × P3).
Of the test set of 20 chemicals, 85% were predicted correctly. Ninety-two percent of the nonsubstrates were predicted correctly, compared with 72% of the substrates. The first pharmacophore (P1) indicated that substrates tended to have a nucleophile attached to a hydrophobic aromatic ring (Fig. 3). The second pharmacophore (P2) represented a nucleophile approximately 2Å from a hydrogen bond acceptor. This pharmacophore recognized carboxylic acid and imidazole groups, both of which were more common in nonsubstrates. The third pharmacophore (P3) comprised a hydrogen bond donor approximately 8 Å from a nucleophile. This pharmacophore was also associated with nonsubstrates and was often detected in hydroxysteroids.

Pharmacophores that predict UGT1A7 substrate selectivity overlaid on selected chemicals. Nucleophile (N), orange; hydrophobe (H), brown; Aromatic Ring (AR), yellow; hydrogen-bond acceptor (HA), green
UGT1A9. The UGT1A9 model consisted of four pharmacophores. Substrate likelihood = –0.20 + (0.43 × P1) + (0.25 × P2) – (0.29 × P3) – (0.25 × P4).
The test set of 64 chemicals was predicted with 80% accuracy by the model. Unlike the previous models, substrates were predicted to a greater extent than nonsubstrates (83 versus 74%). The first pharmacophore (P1) comprised a nucleophile attached to an aromatic ring (Fig. 4). P1 was strongly associated with known substrates and represented functional groups such as phenol and aromatic amine. Additionally, an aromatic ring approximately 8 Å from a nucleophile (P2) was also associated with UGT1A9 substrates. Substrates commonly mapped to both P1 and P2. There were also two pharmacophores associated with nonsubstrates. Five times more nonsubstrates than substrates contained the configuration of two hydrophobes and a hydrogen bond acceptor all approximately 3 Å from the nucleophile (P3). This pharmacophore was typically associated with fused aromatic rings with the hydrogen bond acceptor situated adjacent to the nucleophile. The fourth pharmacophore (P4) was a hydrogen bond donor approximately 6 Å from a nucleophile. This pharmacophore was not obviously associated with any specific chemical substructure.

Pharmacophores that predict UGT1A9 substrate selectivity overlaid on selected chemicals. Nucleophile (N), orange; hydrophobe (H), brown; aromatic ring (AR), yellow; Hydrogen-bond acceptor (HA), green; hydrogen-bond donor (HD), purple
UGT2B4. The pharmacophore model generated to predict UGT2B4 chemical glucuronidation comprised two pharmacophores, both associated with substrates. Substrate likelihood = –0.35 + (0.29 × P1) + (0.34 × P2).
Only chemicals containing both of the pharmacophores were predicted as substrates. This model predicted 86% of the 42 chemical test-set correctly, with substrates predicted more accurately than nonsubstrates (92 versus 83%). The first pharmacophore (P1) was a nucleophile near (2–4 Å) three hydrophobic regions (Fig. 5). This indicated that the site of glucuronidation was commonly situated near hydrophobic regions of the molecule. The second pharmacophore (P2) described a symmetrical arrangement between a hydrophobic region, a nucleophile, and a hydrogen bond acceptor. The nucleophile and hydrogen bond acceptor were separated by approximately 10 Å and each had a hydrophobic region nearby (2 or 3 Å). The symmetry of the pharmacophore often allowed individual chemicals map to the pharmacophore in two distinct ways.

Pharmacophores that predict UGT2B4 substrate selectivity overlaid on selected chemicals. Nucleophile (N), orange; hydrophobe (H), brown; hydrogen-bond acceptor (HA), green
Discussion
Three methods, ranging from complex to simple, were used to generate multiple pharmacophore models for substrates and nonsubstrates of human UGT isoforms. The aim was to progressively simplify the models but to maintain predictivity. Simpler models facilitate interpretability and often have improved predictive ability through the removal of less relevant descriptors. Furthermore, the generation and use of complex models incur significantly greater computational expense. The most complex model was generated from the analysis of all pharmacophores containing all chemical features. Forcing the pharmacophores to include a nucleophile significantly decreased the number of pharmacophores to be analyzed and, on average, resulted in slightly improved predictivity. In addition, interpretation of pharmacophores that include a nucleophile is simpler, because the nucleophile represents a potential site of glucuronidation; therefore, a pharmacophore containing a nucleophile provides insights into the immediate environment of the site of reaction. The final simplification involved selection of a small subset of all the pharmacophores containing a nucleophile, using a novel application of clustering and genetic algorithm optimization (Fig. 1). This allowed for efficient selection of diverse, relevant, and complementary pharmacophores with improved predictive ability compared with any single pharmacophore.
Pharmacophores have most commonly been used to describe configurations of chemical features that are more common to substrates (Van Drie, 1997; Clement and Mehl, 2000). The models built in this study, however, often consist of pharmacophores that are more common to nonsubstrates, thereby improving the ability of the model to discriminate between substrates and nonsubstrates. The `negative' pharmacophores are likely to represent features/groups with either steric hindrance or disfavored entropy factors associated with orientation of, for example, a hydrophobic region in a hydrophilic area of the active site of UGT (P2, UGT1A6).
There are very few methods for modeling data using multiple pharmacophores (Chen et al., 1999; McGregor and Muskal, 1999; Penzotti et al., 2002). The method described here is based around the use of clustering and a genetic algorithm to select a small number of relevant and diverse pharmacophores from a pharmacophore fingerprint. Another method for selecting a subset of pharmacophores has been described previously (Bradley et al., 2000). Compared with the cluster-genetic algorithm method, the method is relatively simplistic and generally selects a large number of pharmacophores (>100), making interpretation of the model essentially impossible. A recursive partitioning method has also been described to generate multiple pharmacophore models from very large data sets in which the binding constants of the chemicals are known (Chen et al., 1999). However, the relatively small data sets available for UGT isoforms preclude such a method.
Although the multiple-pharmacophore method presented in this article resulted in increased predictivity over a single-pharmacophore approach, the models generated for UGT1A6 and UGT1A7 are not suggestive of multiple binding sites within the active site. It is possible that one binding site is predominant and data used here would not differentiate the second site. In this case, data on the site of reactivity may be required to detect a second binding pattern. Alternatively, it is possible that there is only one productive binding site (i.e., the second site is allosteric) or the two binding sites are identical (Stone et al., 2003), in which case pharmacophores describing a single site are to be expected from models trained using substrate/nonsubstrate data.
It has recently been demonstrated that models with significant predictability for UGT glucuronidation can be generated using 2D chemical descriptors (Sorich et al., 2003). However, the major limitation of these models is their lack of interpretability, precluding insight into the structural and chemical features associated with substrates and nonsubstrates of UGT isoforms (Miners et al., 2004; Sorich et al., 2003). The predictive ability of the models generated from pharmacophores using PLSDA (72% of test-set predicted correct on average) was slightly inferior to that of the 2D descriptors using a support vector machine (76%), but significantly better than 2D descriptors with PLSDA (66%) (Sorich et al., 2003). Although previous research demonstrates the support vector machine algorithm to be generally superior to PLSDA, the PLSDA method is linear and therefore the relative contributions of individual pharmacophores can be examined. Thus, a small degree of predictivity is sacrificed to enable generation of interpretable models.
Four of the 12 UGT isoforms were modeled well (i.e., >75% of test set predicted correct), using multiple pharmacophores. It should be noted that >75% represents very good predictivity given the “noise” inherent in the data sets (Sorich et al., 2003). Obviously, differences exist between the UGT isoforms that govern the extent to which pharmacophores can explain the differences between substrates and nonsubstrates. For those isoforms modeled suboptimally using pharmacophores, it is likely that other chemical properties (e.g., electrostatic) are required to predict the likelihood that a chemical will be glucuronidated. Although the UGT isoforms exhibit overlap in the chemicals they are capable of glucuronidating, their substrate selectivities are distinct, so different chemical and structural features are required for each isoform.
Many of the pharmacophores found here to explain chemical glucuronidation describe fundamental chemical and structural features. This indicates that simple features of a chemical, such as phenolic (UGT1A9), carboxylic acid, and imidazole (UGT1A7) groups may have a significant influence on whether the compound is glucuronidated. Furthermore, these pharmacophores may indicate the potential sites of glucuronidation favored by each UGT isoform (i.e., regioselectivity).
Many insights can be drawn from the analyses of UGT1A6, -1A7, -1A9, and -2B4. UGT1A6 has a preference for a nucleophilic site (commonly hydroxyl or amine) that is connected to an aromatic ring. The reason for the importance of the aromatic ring is unknown but may involve improved binding through π-stacking or simple hydrophobic interactions and/or augmented reactivity of the nucleophilic site. UGT1A7 also prefers nucleophilic sites connected to aromatic rings. However, the aromatic ring must not contain hydrophilic groups on one side of the ring; that is, at least one half of the ring must be hydrophobic. The second pharmacophore detected for UGT1A7 suggests that carboxylic acid and heterocycles are not favored as sites of glucuronidation. UGT1A9 also prefers nucleophiles bound to an aromatic ring. Interestingly, substrates for UGT1A9 frequently contain both an aromatic ring directly connected to the nucleophile and an aromatic ring at a distance of approximately 8 Å from the nucleophile, suggesting a possible role of π-π interactions in molecular recognition. The UGT2B4 pharmacophores are distinct from the other three isoforms analyzed. Only pharmacophores associated with substrates were elucidated, and these included only hydrophobic features and a nucleophile. The large number of hydroxysteroids in this particular data set possibly explains these differences.
The multiple-pharmacophore method established here was able to model the UGT isoforms 1A6, 1A7, 1A9, and 2B4 well, despite differences in the chemical diversity of these data sets. The UGT1A6 and UGT1A9 data sets are very chemically diverse, whereas mainly hydroxysteroids have been tested for glucuronidation by UGT2B4. This shows that the pharmacophores are able to capture information relevant to both gross and subtle chemical differences. This is an important property because UGTs are able to glucuronidate a very broad range of chemical structures, yet they are also known to be sensitive to very subtle structural changes.
The site(s) of glucuronidation of most poly-functional substrates of UGT isoforms have not been verified in most published studies; hence, regioselectivity was not modeled here. Regioselectivity of glucuronidation would clearly allow for more sophisticated analyses of chemical features associated with glucuronidation (Miners et al., 2004). Furthermore, site of glucuronidation information would enable development of models capable of predicting the structure of metabolites.
In conclusion, multiple pharmacophore models were generated for 12 UGT isoforms, using a novel cluster-genetic algorithm method capable of selecting a small subset of diverse, relevant and interpretable pharmacophores from a pharmacophore fingerprint. All models showed reasonable predictive ability. The best performing models (UGT1A6, -1A7, -1A9, and -2B4) were further analyzed to gain insight into the structural and chemical features influencing the ability of chemicals to be glucuronidated. Many of the pharmacophores found to be important represented simple chemical features and suggested that the chemical structure near nucleophilic sites in the molecule may strongly influence whether a compound is glucuronidated.
Footnotes
-
This work was supported by a grant from the National Health and Medical Research Council of Australia. M.J.S. is a recipient of an Australian Postgraduate Award.
-
ABBREVIATIONS: UGT, UDP-glucuronosyltransferase; PLSDA, partial least squares discriminant analysis; 2D, two-dimensional; 3D, three-dimensional.
- Received August 14, 2003.
- Accepted November 3, 2003.
- The American Society for Pharmacology and Experimental Therapeutics


