


Abstract
The flavin-containing monooxygenases (FMOs) are important for xenobiotic metabolism. FMO3, the predominant FMO enzyme in human adult liver, exhibits significant interindividual variation that is poorly understood. This study was designed to identify common FMO3 genetic variants and determine their potential for contributing to interindividual differences in FMO3 expression. FMO3 single nucleotide polymorphism (SNP) discovery was accomplished by resequencing DNA samples from the Coriell Polymorphism Discovery Resource. Population-specific SNP frequencies were determined by multiplexed, single-base extension using DNA from 201 Hispanic American (Mexican descent), 201 African American, and 200 White (northern European descent) subjects. Haplotypes were inferred and population frequencies estimated using PHASE version 2.1. Multiple site-directed mutagenesis was used to introduce inferred upstream haplotypes into an FMO3/luciferase construct for functional analysis in HepG2 cells. Sequence analysis revealed seven FMO3 upstream SNPs, 11 exon SNPs, and 22 intron SNPs. Five of the latter fell within consensus splice sites. A g.72G>T variant (E24D) is predicted to impact the structure of the Rossmann fold involved in FAD binding, whereas a g.11177C>A variant (N61K) is predicted to disrupt the secondary structure of a conserved membrane interaction domain. Seven common (>1%) promoter region haplotypes were inferred in one or more of the study populations that differed in estimated frequency among the groups. Haplotype 2 resulted in an 8-fold increase in promoter activity, whereas haplotypes 8 and 15 exhibited a near complete loss of activity. In conclusion, FMO3 promoter haplotype variants modulate gene function and probably contribute to interindividual differences in FMO3 expression.
The flavin-containing monooxygenases (FMOs) (EC 1.14.13.8) are a family of NADPH- and oxygen-dependent microsomal enzymes involved in the oxidative metabolism of many nucleophilic nitrogen-, sulfur- and phosphorous-containing drugs and toxicants (Cashman, 2002). Multiple human FMO genes have been identified: a five-gene cluster at 1q24.3 (FMO1-4 and FMO6p) that encodes four active enzymes (FMO1-4), a second cluster of five genes at 1q24.2 (FMO7p-11p), all representing pseudogenes, and a single gene, FMO5, at 1q21.1, that also encodes an active enzyme (FMO5) (Hines et al., 2002; Hernandez et al., 2004). Each of the human FMO enzymes exhibits a distinct but unusually broad and overlapping substrate specificity that is partly attributable to the unique FMO catalytic mechanism (Ziegler, 2002). Individual FMO genes exhibit a highly tissue-, species- and development-specific expression pattern (Shehin-Johnson et al., 1995; Yeung et al., 2000; Koukouritaki et al., 2002). For example, human FMO3 is essentially nondetectable in fetal liver but is observed in most people by 1 to 2 years of age (Koukouritaki et al., 2002) and is expressed in the adult human liver, but not other tissues, at levels that approach those reported for CYP3A4 (Wrighton et al., 1990; Overby et al., 1997). However, FMO3 represents a minor hepatic enzyme in most other mammalian species with the possible exception of the female mouse.
Differences in interindividual FMO expression (10- to 20-fold) have been reported that may contribute to a person's susceptibility to toxicants and/or response to drugs (Overby et al., 1997; Yeung et al., 2000; Koukouritaki et al., 2002). For the cytochromes P450, the superfamily of proteins considered most important for phase I xenobiotic metabolism, both genetic diversity and differential exposure to xenobiotics capable of inducing gene expression contribute to intersubject expression differences. However, the FMO genes are not known to respond to such environmental influences; as such, genetic differences are thought to contribute more heavily to differences in expression between individual subjects. Furthermore, differences in variant allelic frequencies among ethnic and/or racial groups also contribute to interpopulation differences in xenobiotic metabolism.
Thirty genetic variants in human FMO3 coding sequences have been characterized. Thirteen of these are single nucleotide changes that result in loss of function and represent rare alleles causative for trimethylaminuria or “fish-odor syndrome” (for review, see Cashman, 2004). In addition, a homozygous deletion of exons 1 and 2 was reported as causative in an Australian of Greek ancestry with trimethylaminuria (Forrest et al., 2001). However, the substantial differences in FMO3 expression observed within or among different populations (Overby et al., 1997; Yeung et al., 2000; Koukouritaki et al., 2002) cannot be attributed to such rare alleles. Rather, common variants encoding an altered but functional FMO3 must contribute. Three of the 30 known human FMO3 genetic variants (E158K, V257M, and E308G) are common (i.e., allelic frequencies >1%), and two of them are associated with reduced FMO3 activity (for review, see Cashman, 2004). However, considering the percentage loss of activity and their frequency, these variants would not fully explain observed interindividual differences in FMO3 expression.
The potential for variation within regulatory sequences to contribute to interindividual differences in gene expression is increasingly being recognized (Hoogendoorn et al., 2003; Pastinen and Hudson, 2004). However, little has been reported regarding FMO3 promoter variation and its possible contribution to expression differences. The current study's objectives were to identify common FMO3 genetic variants, determine the allelic frequencies of the promoter variants in several populations and infer haplotypes, and finally, examine the potential for haplotype variants to impact FMO3 promoter function.
Materials and Methods
Materials. Cell culture medium and fetal bovine serum were purchased from Sigma-Aldrich (St. Louis, MO). DNAzol reagent, Taq DNA polymerase, and Lipofectamine 2000 were purchased from Invitrogen (Carlsbad, CA). FlexiGene DNA kits were obtained from QIAGEN (Valencia, CA). The ExoSAP-IT mix, containing both exonuclease I and shrimp alkaline phosphatase, as well as shrimp alkaline phosphatase alone, were purchased from United States Biochemical Corp. (Cleveland, OH). ABI Prism Big Dye Terminator Cycle Sequencing kits were obtained from Applied Biosystems (Foster City, CA) and CEQ SNP-Primer Extension and Dye Terminator Cycle Sequencing kits from Beckman Coulter, Inc. (Fullerton, CA). HepG2 hepatoblastoma cells were a gift of Dr. Barbara Knowles (Jackson Laboratories, Bar Harbor, ME). The luciferase reporter plasmid, pGL3Basic, and luciferase reporter assay kit were purchased from Promega (Madison, WI), whereas the luminescent β-galactosidase detection system was obtained from BD Biosciences (Palo Alto, CA). Custom oligonucleotides were synthesized by MWG Biotech (High Point, NC). For single nucleotide polymorphism (SNP) discovery, the 24 sample subset of the Polymorphism Discovery Resource (24PDR) (Collins et al., 1998) was obtained from the Coriell Institute (Camden, NJ). All other reagents were obtained from commercial sources at the purest grade available.
Patient Recruitment and DNA Isolation. Individuals representing various ethnic and/or racial groups were recruited to provide DNA samples as described previously (McCarver et al., 1997; Whetstine et al., 2000; Zheng et al., 2003). In all instances, ethnicity and/or race was self-reported. After obtaining informed consent, blood was obtained by venipuncture, and DNA was extracted using the FlexiGene DNA kit according to the manufacturer's instructions. Using DNAzol reagent, DNA samples from individuals of known ethnicity also were isolated from tissue obtained from the University of Miami and University of Maryland Brain and Tissue Banks for Developmental Disorders. Finally, a panel of 100 DNA samples from unrelated, self-declared White individuals and distinct from the 24PDR was obtained from the Coriell Institute. These three DNA sources resulted in 201 samples from individuals of Hispanic American (Mexican) descent, 201 samples from individuals of African American descent, and 200 samples from White individuals (northern European descent). Research protocols were approved by all Institutional Review Boards involved.
DNA Amplification and Sequence Analysis for SNP Discovery. Common FMO3 genetic variants were identified by sequencing approximately 1.0 kbp of FMO3 5′-flanking information along with each of nine exons and a minimum of 64 bases of exon flanking sequences using the Coriell 24PDR. Reactions were performed in a final volume of 50 μl and contained 0.4 μg of genomic DNA, 20 mM Tris-HCl, pH 8.4, 50 mM KCl, 1.5 mM MgCl2, 0.2 mM concentrations of each deoxyribonucleotide triphosphate, 0.5 μM concentrations of each primer, and 1.25 units of Taq DNA polymerase. Polymerase chain reaction amplification primers and individual reaction conditions are shown in Table 1. Cycle sequencing reactions were performed with the same primer pairs used for amplification. Thus, for each amplicon, both strands were sequenced, and any low-frequency SNPs (allelic frequency of 0.021 in the 24PDR) were resequenced to confirm their identification.
FMO3 template amplification primers for SNP discovery
Coordinates are based on assigning the “A” of the ATG translation initiation codon +1. All PCR conditions. (A, B, C, D) had an initial denaturation step at 94°C for 2 min followed by 35 cycles of: A, denaturation at 94°C for 30 s, annealing at 50°C for 30 s, and elongation at 72°C for 1 min; B, denaturation at 94°C for 30 s, annealing at 55°C for 30 s, and elongation at 72°C for 1 min; C, denaturation at 94°C for 30 s, annealing at 47°C for 30 s, and elongation at 72°C for 1 min; D, denaturation at 94°C for 30 s, annealing at 48°C for 30 s, and elongation at 72°C for 1 min. All PCR conditions (A-D) had a final elongation step at 72°C for 2 min.
Multiplex Single Base Extension Assay. Genotype frequencies of common FMO3 upstream variants in different populations were determined using a multiplexed SBE assay (Lindblad-Toh et al., 2000) following the recommended protocol included in the CEQ SNP-primer extension kit. Template amplification was performed as described above (SNP discovery) and Table 1, but using 0.2 μM concentrations of the upstream and downstream primers from sets 2 and 1, respectively, 100 ng of genomic DNA, and 2.5 units of TaqDNA polymerase in a 50-μl reaction volume. After amplification, excess primer and unincorporated deoxynucleotides were removed by incubating with ExoSAP-IT (United States Biochemical Corp.) at 37°C for 60 min followed by enzyme inactivation at 80°C for 15 min. An aliquot of the amplification reaction was fractionated by agarose gel electrophoresis both to verify the fidelity of the amplification reaction and to quantify yield. The SBE reactions were performed in a 20-μl volume containing 20 fmol of DNA template, 80 mM Tris-HCl pH 8.9, 2 mM MgCl2, 0.1 μM concentrations of each fluorescence-tagged dideoxynucleotide triphosphate, 1 μl of the proprietary DNA polymerase supplied with the CEQ SNP Primer Extension kit (Beckman Coulter), and SBE primers at concentrations optimized to give uniform signal strength (Table 2). After 30 cycles of 96°C for 30 s, 50°C for 30 s, and 72°C for 30 s, unincorporated dideoxynucleotides were eliminated by incubating with 2 units of shrimp alkaline phosphatase (United States Biochemical Corp.) at 37°C for 60 min followed by enzyme inactivation at 75°C for 15 min. The SBE reaction product was diluted 1:400 in SLS buffer (Beckman Coulter) and analyzed by capillary electrophoresis using a CEQ8000 Genetic Analysis System along with the Size Standard 80 standards (Beckman Coulter). For a positive control, 20 fmol of linearized pRNH707 (reference sequence), pRNH858 (containing all queried SNPs), or an equal mixture of both was used as a template in the SBE reaction.
Single base extension primers
Plasmids. Human FMO3 upstream sequences from position -2965 to +42 (relative to the transcription start site) were isolated, cloned, and verified in a fashion similar to that described previously for human FMO1 (Hines et al., 2003), resulting in the plasmid, pRNH659. These same FMO3 sequences were subsequently excised using BamHI/SrfI and cloned into the same restriction endonuclease sites within the pGL3basic vector to generate pRNH694. Finally, pRNH694 was digested with SmaI/Bst1071, the excised fragment was discarded, and the remaining DNA was religated, resulting in pRNH707 containing FMO3 sequences from position -988 to +42 directing luciferase expression. Sequence analysis of pRNH707 confirmed this plasmid represented the FMO3 reference sequence (GenBank accession no. AL021026). Site-directed mutagenesis (QuikChange multiple site-directed mutagenesis kit; Stratagene, La Jolla, CA) was used to introduce various single-base changes into pRNH707, representing the inferred FMO3 haplotypes: pRNH817, -2650C>G; pRNH830, -2650C>G, -2543T>A, and -2177G>C; pRNH859, -2543T>A; pRNH862, -2650C>G and -2543T>A; pRNH863, -2589C>T and -2106G>A; and pRNH864, -2106G>A and -1961T>C. As a control for the genotyping assays, pRNH858 also was created containing all of the upstream SNPs listed in Table 5. In all instances, the nucleotide changes and the fidelity of the nontargeted information were verified by DNA sequence analysis.
Human FMO3 SNP discovery—5′-flanking sequences
Coordinates are based on assigning the “A” of the ATG translation initiation codon +1. Accession number is that reported in dbSNP build 124.
Cell Culture and Transient Expression Reporter Assays. HepG2 hepatoblastoma cells were cultured in Dulbecco's modified Eagle's medium supplemented with 10% fetal bovine serum and antibiotics as described by Boucher et al. (1993). The cells were subcultured (1:4 ratio) every 3 to 4 days and used in the present study at passages 12 to 20. For transfection studies, 1.2 × 10⁴ cells were subcultured in each well of a 24-well plate and, 24 h later, were transfected using a mixture of 3 μg of Lipofectamine 2000, 0.8 μg of test luciferase reporter plasmid, and 0.2 μg of pCMVβgal. After incubation for 16 h at 37°C, transfection medium (Opti-MEM supplemented with 10% fetal bovine serum) was replaced with growth medium, and the cells were incubated for an additional 48 h. The cells were processed and luciferase assays performed according to the manufacturer's instructions. Data were normalized with respect to β-galactosidase specific activity to correct for differences in transfection efficiency and luciferase activity expressed as relative luciferase units. The data reported are from two independent transfection assays, with each experiment performed in triplicate.
Data Analysis. The potential ability of the identified intron variants to form cryptic splice sites or alter existing putative cryptic splice sites or normal splice site strength was assessed using the Automatic Splicing Mutation Analysis software (https://splice.cmh.edu). The information content (Ri) value of the natural or potential cryptic splice site was calculated based on a weight matrix from a scan of the complete human genome (April, 2003). A similar approach was used to assess the impact of both synonymous and nonsynonymous variants on exon splice enhancer motifs for SRp40, SF2/ASF, and SC35 (Liu et al., 1998, 2000; Rogan et al., 1998) (P. K. Rogan, personal communication). The hypothetical default minimum value for functional binding (Ri,min) is 0.0 bits. However, for splice site acceptor and donor sites, a more comprehensive analysis of known splice sites identified in the human genome resulted in a revision of Ri,min to 1.6 bits, which was the value used in the current study (Rogan et al., 2003). A sequence variation causing a decrease in information content that remains above the Ri,min may lead to a leaky site. However, the average decrease in Ri needed to reduce levels of normal splicing was reported to be 2.9 bits for donor sites and 4.3 bits for acceptor sites (Rogan et al., 1998). Thus, these minimum values were used to assess variation in splice donor and acceptor sites identified in the current study.
The impact of nonsynonymous exon variants on predicted protein structure was assessed using the Protein Structure and Hydrophilicity Analysis modules within the Clone Manage Suite 7.1 software (Scientific and Educational Software, Cary, NC) which in turn are based on the methods of Garnier et al. (1978) and Kyte and Doolittle (1982), respectively. Pairwise alignment and progressive assembly of FMO3 sequences from various species using Neighbor-Joining Phylogeny was accomplished using the Align program V5.0 within Clone Manager Suite 7.1.
Individual haplotypes and their estimated population frequencies were inferred using the PHASE ver. 2.1, with all parameters set at the default values (Stephens et al., 2001; Stephens and Donnelly, 2003). Allelic frequencies for individual sequence variants were compared using Fisher's exact test. A Bonferroni adjustment for the comparisons among the three groups was used, reducing the accepted α from 0.05 to 0.016. Differences in inferred mean haplotype frequencies were compared using unpaired t tests with a Welch correction or by one-way ANOVA with a Bonferroni post hoc test. Functional differences among the different haplotypes were assessed using transient expression assays and compared by one-way ANOVA with a Dunnett's post hoc test. Except where the Bonferroni adjustment was applied, P < 0.05 was accepted as indicating a significant difference. Software used was Instat (ver. 3.05; GraphPad Software, San Diego, CA).
Results
FMO3 SNP Discovery. SNP discovery was accomplished by sequencing approximately 1 kbp upstream of the FMO3 5′ transcription start site, as well as all nine exons and flanking splice-sites using DNA samples from 24 unrelated persons obtained from the Coriell PDR (Camden, NJ). Forty SNPs were identified. Eleven SNPs were identified within exon sequences, five of which were reported previously in the literature and/or build 124 of the dbSNP database (Table 3) (Cashman et al., 1997; Treacy et al., 1998) (http://www.ncbi.nlm.nih.gov). Two previously unreported FMO3 exon variants shown in Table 3, g.15019A>C and g.15437A>G, are synonymous changes (T108T and K167K, respectively) and, as such, would not alter FMO3 catalytic activity. Three novel nonsynonymous exon variants also were identified: g.72G>T (E24D), g.11177C>A (N61K), and g.23613G>T (K416N). A total of 22 SNPs were identified within intron sequences, five of which fall within FMO3 splice donor or acceptor sites (Table 4). Six of the identified intron SNPs were described previously (g.15399G>A, Basarab et al., 1999) and/or have been reported in dbSNP build 124 (http://www.ncbi.nlm.nih.gov). FMO3 sequence analysis revealed seven upstream variants, none of which has been reported in the literature but five of which were reported in build 124 of dbSNP (Table 5) (http://www.ncbi.nlm.nih.gov).
Human FMO3 SNP discovery—exon sequences
Coordinates are based on assigning the “A” of the ATG translation initiation codon +1. Accession number is that reported in dbSNP build 124.
Human FMO3 SNP discovery—intron sequences
Coordinates are based on assigning the “A” of the ATG translation initiation codon +1. Location indicates the position of the SNP within the gene splice donor or acceptor consensus sequence (Rogan et al., 1998). Accession No. is that reported in dbSNP build 124, if applicable.
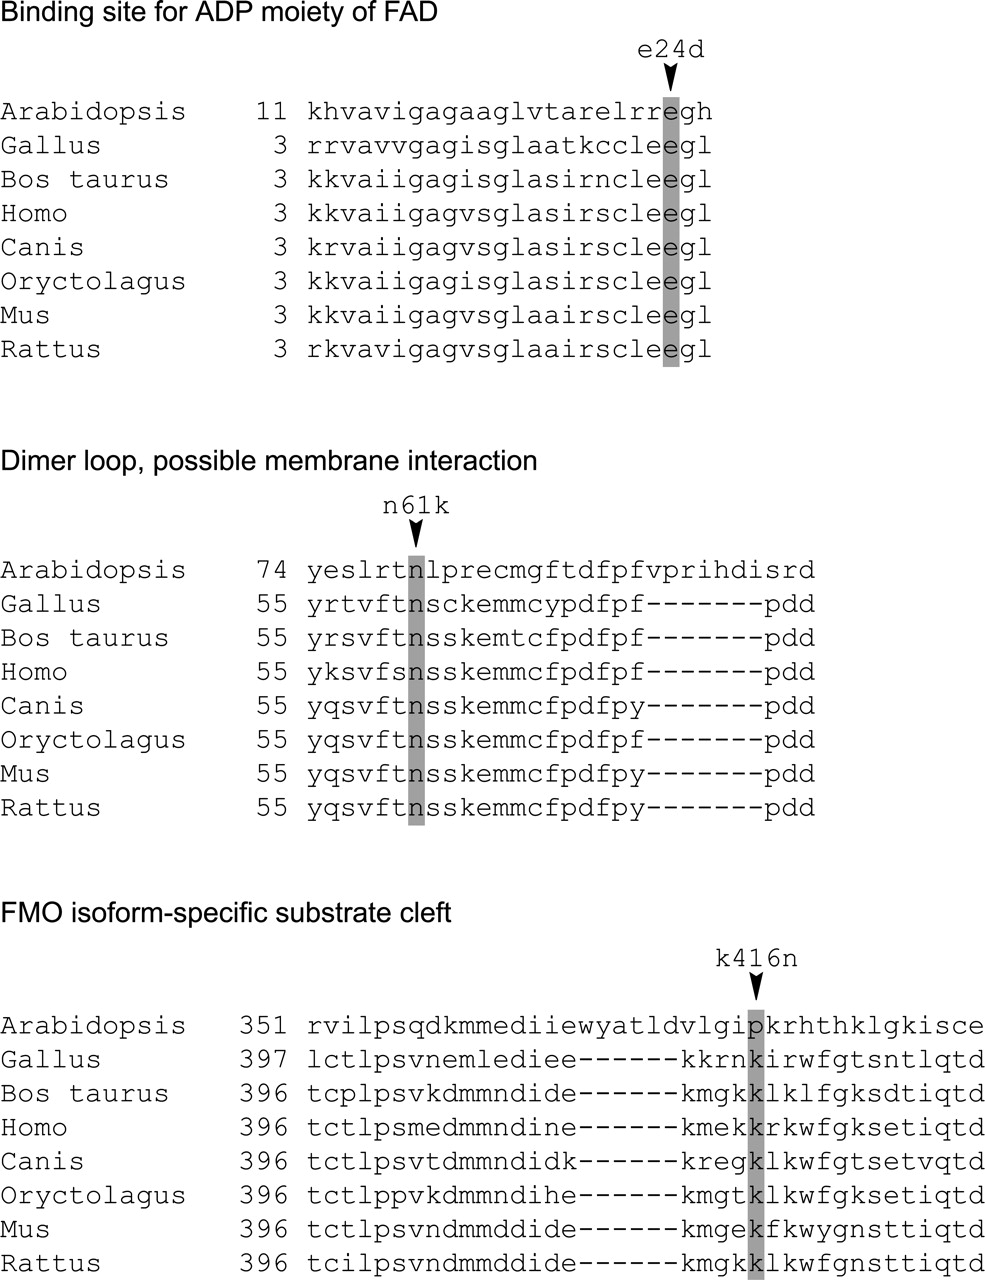
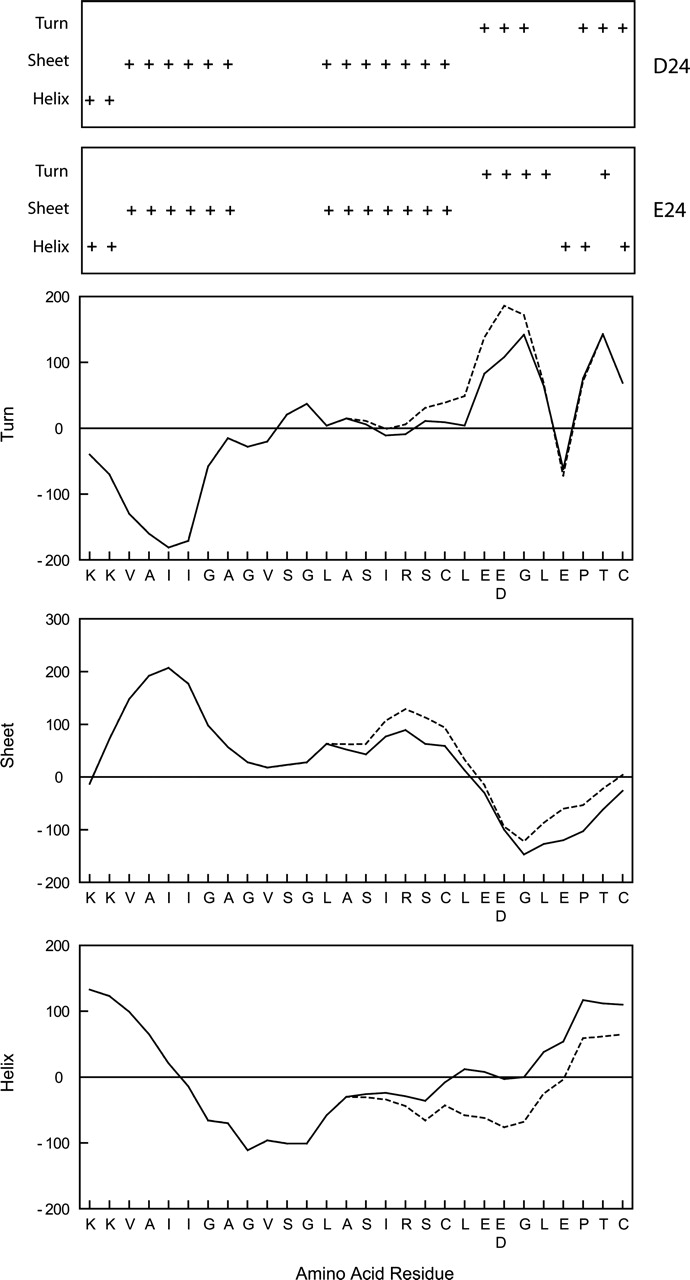
Predicted Impact of FMO3 Exon and Intron SNPs. All three of the FMO3 nonsynonymous exon variants fall within conserved domains that are part of predicted, functional FMO motifs (Fig. 1). Analysis of the predicted impact of these variants revealed that the E24D substitution would disrupt the α-helical structure at the C terminus of the conserved Rossmann fold involved in FAD binding and, as such, might impact FMO3 catalytic activity (Fig. 2). The N61K substitution falls within a less well confirmed dimer-loop structure thought to be involved in membrane interactions. This substitution has little or no effect on the predicted hydrophilicity of this peptide domain but is predicted to significantly impact the peptides secondary structure, disrupting a strong β-sheet structure and favoring an α-helix (Fig. 3). In contrast, the K416N variant is predicted to have minimal impact on either hydrophilicity or protein structure.
Both synonymous and nonsynonymous polymorphisms can potentially effect RNA splicing by altering the efficiency of exon splice enhancer motifs (Fairbrother et al., 2002). Of the FMO3 variants reported in the present study, three result in an increase in Ri value for potential splice site enhancer motifs: the 15019A>C (T108T) variant results in the creation of a potential SC35 site in exon 4 at 15016 (Ri from -3.4 to 2.7); the 15136C>A (S147S) variant results in the strengthening of a potential SRP40 site in exon 4 at 15134 (Ri from 1.2 to 3.8); and the 21443A>G (E308G) variant in exon 7 results in the creation of a potential SF2/ASF site at 21438 (Ri from 0.1 to 6.8), a potential SRP40 site at 21439 (Ri from 0.6 to 6.7), and a potential SC35 site at 21443 (Ri from -0.5 to 3.2). However, the observation that the Ri values for the splice donor and acceptor sites flanking exon 4 and exon 7 are high (8.6 and 11.3 for exon 4 and 11.8 and 10.1 for exon 7, respectively), suggests that the creation of new splice site enhancers and/or the strengthening of existing enhancers may not significantly alter splicing efficiency. Two of the variants result in the abolishment of potential splice site enhancer motifs: the -1732G>T variant in exon 1 eliminates a potential SRP40 site at -1730 (Ri from 6.6 to 1.9), a potential SF2/ASF site at -1729 (Ri from 6.1 to 0.3), and a potential SC35 site at -1732 (Ri from 2.5 to -2.2). The 72G>T (E24D) variant abolishes a potential SF2/ASF site in exon 2 at position 68 (Ri from 3.3 to -2.5). The likelihood of these sequence variations affecting splicing efficiency is somewhat higher, given the lower Ri values of the flanking splice sites (8.8 for the intron 1 splice donor site and 6.4 and 5.7 for the intron 1 splice acceptor site and intron 2 splice donor site, respectively).
Of the 17 variants falling outside the reported FMO3 splice donor or acceptor sites, two resulted in changes in information content sufficient to consider their potential to create a cryptic site, or strengthen an existing cryptic site (i.e., a potential splice site with an Ri value >1.6 bits) (Rogan et al., 2003). The 154T>G intron 2 variant results in an Ri value change in a potential cryptic donor splice site at position +150 from 1.0 to 4.9 bits. Use of the +150 cryptic donor site would result in a 17-base insertion into the 5′-leader sequence of the processed transcript, but would not alter FMO3 coding information. The 4.9 bit Ri value of the potential + 150 cryptic site approaches the 5.7 bit Ri value of the reference sequence donor site at +133 and, as such, may lead to alternative splicing. The 14982T>G intron 3 variant results in an Ri value change from -5.6 bits to 3.1 bits, consistent with the creation of a cryptic splice acceptor site which would result in a 34-bp insertion and a frame-shift. However, the reference sequence splice acceptor site at 15016 has an Ri value of 8.6 bits and, as such, remains a much stronger site.
Of the five variants falling within splice sites, three (11322T>G within the intron 3 splice donor site, 15399G>A within the intron 4 splice acceptor site, and 24416G>T within the intron 8 splice acceptor site) result in an increase in information content, suggesting that they strengthen the respective splice site. The remaining two SNPs result in a decrease in information content. The 23532C>A variant decreases the intron 7 splice acceptor site Ri value from 13.9 to 12.6 bits, whereas the 23628G>T variant decreases the intron 8 splice donor site Ri value from 9.3 to 8.3 bits. A variant causing a decrease in information content that remains above the minimum for splice site recognition (1.6 bits) (Rogan et al., 2003) may lead to a leaky splice site. However, given that neither the 23532C>A nor the 23628G>T variants result in Ri changes approaching the average necessary decrease (see Materials and Methods) (Rogan et al., 1998), it is unlikely that they would cause leaky splicing. Furthermore, there are no cryptic sites within a 1000-bp window on either side of these splice sites that offer an alternative with significantly higher information content.
Analysis of FMO3 Promoter Variants. Given the paucity of known information regarding molecular mechanisms regulating FMO3 expression, it was impossible to predict whether or not any of these variants might contribute to changes in transcription efficiency. As such, these variants were given the highest priority for further pursuit experimentally. To define FMO3 promoter region haplotypes and elucidate their potential role in modulating gene function, the allelic frequency of the seven common FMO3 upstream variants was determined in White (northern European descent), Hispanic American (Mexican descent), and African American populations using a multiplexed SBE assay (Table 6). The pattern of ethnic distribution differed among the different SNPs. The frequencies of the g.-2650C>G and the g.-2543T>A variants were greater among Hispanic Americans compared with either Whites or African Americans, whereas they did not differ in the latter two populations. The g.-2177G>C SNP, although most common within the Hispanic American population, was also more common among African Americans than Whites. Two variants were more common among Whites. The g.-2589C>T variant was more frequent in this population compared with the other two populations, in which its frequency did not differ. Finally, the -2106G>A variant was more common in the White population than the Hispanic American population, whereas the frequency among African Americans did not differ from either of these groups. The g.-2099A>G SNP was not observed in any of the study populations, suggesting that this variant will be present in one of the other population groups represented in the 24PDR DNA panel (i.e., Native Americans or Asian Americans).
FMO3 upstream genetic variation—population-specific allelic frequencies

Potential impact of previously unreported human FMO3 nonsynonymous structural variants. Pair-wise alignment of FMO3 protein sequences from Arabidopsis thaliana (BT000473), Gallus gallus (AJ431490), Bos taurus (NM_174057), Homo sapiens (NM_006894), Canis familiaris (AF384054), Oryctolagus cuniculus (L10391), Mus musculus (U87147), and Rattus norvegicus (NM_053433) and progressive assembly using neighbor-joining phylogeny was accomplished using the Align program in Clone Manager Suite ver. 7.1 (Scientific and Educational Software). Protein motifs were compiled by Krueger and Williams (2005). The position of the amino acid changes resulting from the identified SNPs are highlighted.
Based on the determined allelic frequencies of the upstream variants, 15 haplotypes were inferred using PHASE ver. 2.1, seven of which were common (>1%) in one or more of the study populations with haplotype 1 matching the reference sequence (Table 7). Haplotype 2 (g.-2650C>G, g.-2543T>A, and g.-2177G>C) was the most common variant haplotype in the Hispanic American and African American populations, whereas haplotype 3 (g.-2650C>G) was the most common inferred haplotype variant in the White population. However, the frequencies of both haplotype 2 and 3 were significantly different from one population group to another (ANOVA, Bonferroni post hoc, P < 0.001). Four additional haplotypes were inferred in the African American and White study populations that were not inferred in the Hispanic American study group. Haplotype 4 (g.-2650C>G and g.-2543T>A) was estimated to occur at essentially the same frequency in both the African American and White study populations. In contrast, haplotype 11 (g.-2543T>A) was estimated to occur at a significantly higher frequency in the White versus African American study groups (unpaired t test, p < 0.001). Furthermore, haplotype 11 was estimated to be the second most abundant in the White population. Finally, haplotype 8 (g.-2589C>T, g.-2106) was unique to the White group, whereas haplotype 15 (g.-2106G>A, g.-1961T>C) was unique to the African American population.
Common (>1%) FMO3 upstream haplotypes

Predicted FMO3 secondary structure changes resulting from the E24D variant. The conserved FMO3 Rossmann fold domain involved in FAD binding (Fig. 1) was analyzed for predicted secondary structure changes caused by the E24D variant using the algorithm developed by Garnier et al. (1978). Tendency toward α-helix, β-sheet, and turns are shown as line plots for both the E24 reference (solid line) and D24 variant (dashed line) peptides. The resulting predicted secondary structure for both peptides is shown in boxes above the plots.

Predicted FMO3 secondary structure changes resulting from the N61K and N61S variants. The conserved FMO3 peptide, proposed to form a dimer loop membrane interaction domain, was analyzed for predicted secondary structure changes caused by the N61K variant identified in this study, as well as the N61S rare variant reported to result in a trimethylamine N-oxidation null phenotype (Dolphin et al., 2000). The algorithm developed by Garnier et al. (1978) was used. Tendency toward α-helix, β-sheet, and turns are shown as line plots for both the N61 reference (solid line), K61 variant (dotted line), and S61 variant (dashed line) peptides. The resulting predicted secondary structure for all three peptides is shown in boxes above the plots.
To explore the potential impact of the human FMO3 upstream variants on promoter activity, the different haplotypes inferred in the three study groups were introduced into a reporter construct containing FMO3 position -988 (-2762 relative to the ATG start codon) to + 42 (-1732 relative to the ATG start codon) directing luciferase expression. Separate studies in our laboratory have suggested that most if not all of the regulatory elements important for controlling FMO3 expression are located within these sequences (D. Klick and R. N. Hines, unpublished observations). The luciferase expression plasmids were subsequently analyzed by transient expression in HepG2 cells (Fig. 4). Relative to the reference sequence (pRNH707), no difference in promoter activity was observed with haplotypes 3 (pRNH817, g.-2650C>G), 4 (pRNH862, g.-2650C>G and -2543T>A), or 11 (pRNH859, g.-2543T>A). In contrast, haplotype 2 (pRNH830), consisting of the g.-2650C>G, g.-2543T>A, and g.-2177G>C SNPs, exhibited an 8-fold increase in FMO3 promoter activity (ANOVA, Dunnett's post hoc, P < 0.01). It was striking that both haplotype 8 (pRNH863) (g.-2589C>T and g.-2106G>A) and haplotype 15 (pRNH864) (g.-2106G>A, g.-1961T>C) (pRNH864) exhibited a near complete loss of promoter activity (ANOVA, Dunnett's post hoc, P < 0.01).
Discussion
The current study focused on identifying common FMO3 variants that might contribute to observed interindividual differences in expression. Forty SNPs were identified in the multiethnic, multiracial 24 sample Coriell PDR. Thirteen of these SNPs have been reported previously in the literature (see Cashman, 2004 for review) or in build 124 of the dbSNP database (http://www.ncbi.nlm.nih.gov). Of the previously reported common SNPs, g.18281G>A, resulting in a V257M substitution, does not seem to have any effect on enzyme activity (Dolphin et al., 2000), although an exhaustive analysis of substrates has not been reported. In contrast, both the individual E158K and E308G variants and the compound variant at these same two codons result in reduced FMO3 catalytic activity that seems to vary depending on the substrate (Cashman et al., 1997; Park et al., 2002; Lattard et al., 2003). Such substrate-dependent impact of polymorphisms has also been observed for the well studied CYP2D6 gene (Yu et al., 2002). Of the three novel SNPs resulting in nonsynonymous changes in the FMO3 coding sequences, two are predicted to impact protein structure and, as such, may have a significant impact on catalytic function and/or protein stability. The E24D variant is predicted to disrupt the α-helical structure that is an integral part of the Rossmann fold known to be important for FAD binding, whereas the N61K disrupts the β-sheet structure of a proposed membrane interaction domain. Of significant interest is that substitution of a serine for asparagine at this same position results in a null trimethylamine N-oxidation phenotype causative for trimethylaminuria, although methimazole S-oxidation by this same FMO3 variant seemed normal (Dolphin et al., 2000). Furthermore, comparing the effect of both the serine and lysine substitution on the predicted secondary structure of this peptide domain suggests a more dramatic effect of the latter amino acid (Fig. 3).
Although 22 common sequence variants were identified within 50 to 100 bp of FMO3 splice donor or acceptor sites, the predicted inability of these polymorphisms to significantly change existing splice sites or create cryptic splice sites is consistent with the observations of Lattard et al. (2004) who reported only two FMO3 splice variants (i.e., exon 3 skipping or exon 7 skipping). Although detectable using a highly sensitive reverse transcriptase coupled PCR DNA amplification technique, the variants reported by this group seemed to be rare relative to the abundance of the normal FMO3 transcript in all tissues examined. The observations of Lattard et al. (2004) also would argue against a significant impact of the variants resulting in the loss of splice site enhancer motifs in exons 1 and 2.

Functional analysis of human FMO3 upstream variants. Haplotype variants were introduced into a reporter construct containing FMO3 position -988 (-2762 relative to ATG start codon) to +42 (-1732 relative to ATG start codon) directing luciferase expression. Plasmids were used to transfect HepG2 cells, which were subsequently analyzed for transient luciferase expression. Individual plasmid numbers and the haplotypes they represent (see Materials and Methods) are shown on the ordinate. Luciferase activities were normalized for transfection efficiency using cotransfected β-galactosidase activity and, within each experiment, were normalized to the activity observed with the reference haplotype 1. Data represent the mean ± S.D. from a minimum of six experiments. (**, P < 0.01; ANOVA, Dunnett's post test).
Given the paucity of information regarding the possible impact of FMO3 promoter variants, much of this study focused on the seven SNPs identified within 1.0 kbp of the transcription start site and the haplotypes inferred in three separate study populations (i.e., Hispanic Americans of Mexican descent, African Americans, and Whites of northern European descent). Haplotype 2 (g.-2650C>G, g.-2543T>A, and g.-2177G>C), exhibited an 8-fold increase in FMO3 promoter activity, and, combined with its estimated frequency, would be expected to have a significant impact on FMO3 expression and FMO3-dependent xenobiotic metabolism within all three populations. Although haplotype 2's frequency differed among these groups (Table 7), assuming conformity to the Hardy-Weinberg equilibrium, it is anticipated that 49.4, 20.6, and 12.2% of Hispanic Americans of Mexican descent, African Americans, and Whites of northern European descent, respectively, would possess at least one of the haplotype 2 alleles. Because haplotype 2 is a compound variant consisting of three SNPs (g.-2650C>G, -2543T>A, and -2177G>C), consideration of this haplotype in isolation is not informative with regards to determining which SNP, or combination of SNPs is responsible for the altered activity. However, haplotype 3 consists of only the g.-2650C>G variant and exhibited promoter activity no different from the reference sequence. Furthermore, haplotype 11 consists of only the g.-2543T>A SNP and exhibited only a small, statistically insignificant reduction in promoter activity. Thus, these observations would be consistent with the notion that the g.-2177G>C SNP is responsible for the increased promoter activity observed with haplotype 2. However, two other promoter constructs were examined that were inferred as rare (<1%) haplotypes but involved the g.-2177G>C variant: haplotype 5 consisting of the g.-2177G>C SNP alone and haplotype 7 consisting of the g.-2543T>A and g.-2177G>C SNPs. When these haplotypes were examined in FMO3/luciferase transient expression assays, both resulted in a 2- to 3-fold increase in promoter activity (data not shown). Although these data are consistent with the proposed role of the g.-2177G>C SNP, the quantitative difference between these two haplotypes and haplotype 2 suggests a combinatorial effect of all three SNPs in the latter.
In contrast to the increased promoter activity observed with haplotype 2, a nearly complete loss of promoter function was observed with haplotypes 8 and 15. It is interesting that haplotypes 8 and 15 were only estimated as common in the White and African American study populations, respectively. Again assuming conformity to the Hardy-Weinberg equilibrium, at least one haplotype 15 allele would be observed in 3.0% of African Americans whereas the haplotype 8 allele would be observed in 7.3% of Whites. The frequencies of these functionally significant alleles in the three population groups strongly suggests that genetic diversity within the FMO3 promoter contributes substantially to observed interindividual differences in FMO3 expression levels. Furthermore, the apparent absence of the loss-of-function haplotypes 8 and 15 in the Hispanic American study population combined with the relative abundance in this group of the gain of function haplotype 2 allele would be consistent with higher FMO3 mean expression in Hispanic Americans. Both haplotypes 8 and 15 share a common SNP (i.e., g.-2106G>A), suggesting that this transition may be responsible for the dramatic loss of promoter activity. Further support for this supposition was obtained with another SNP combination that was inferred as a rare haplotype in all three populations (i.e., haplotype 9, consisting of g.-2650C>G, g.-2589C>T, and g.-2106G>A). The FMO3 reporter construct representing haplotype 9 also resulted in a near complete loss of promoter activity (data not shown). When the sequences surrounding the g.-2106G>A SNP were examined for potential transcription factor binding sites using the Match program in conjunction with the TRANSFAC Professional ver. 8.3 database (http://www.biobase.de) (Matys et al., 2003), no binding site matrices were identified in which the change at position -2106 caused a critical change in a core transcription factor binding element. Thus, insight into the molecular mechanisms responsible for the change in promoter function observed with haplotypes 8 and 15, as well as haplotype 2, will require further study.
The magnitude of loss of function for haplotypes 8 and 15, suggests that both of these alleles might contribute to the incidence of trimethylaminuria in the White and African American populations, respectively. Studies on persons heterozygous for structural FMO3-null variants suggest that a 50% loss of metabolic capacity to N-oxidize trimethylamine does not result in an overt trimethylaminuria phenotype but only renders such persons susceptible to a trimethylamine challenge (Zschocke et al., 1999). Thus, assuming conformity to the Hardy-Weinberg Equilibrium, one would predict that only persons homozygous for either haplotype 8 at a frequency of 0.1% in the White population or haplotype 15 at a frequency less than 0.1% in the African American population would present with symptoms for this disorder. In contrast, a 50% loss of metabolic activity in the more frequent heterozygotes may significantly affect FMO3-dependent drug metabolism.
In summary, a total of 40 FMO3 SNPs have been identified, 27 of which are novel. Seven of the identified SNPs were located within 1.0 kbp of the transcription start site and were used to infer seven common haplotypes based on individual allelic frequencies in Hispanic American, African American, and White study populations. Three of the inferred haplotypes significantly altered promoter function based on transient expression of FMO3 reporter constructs. Furthermore, substantial differences were observed in estimated haplotype frequencies among the three population groups studied. These observations suggest that genetic variation within FMO3 regulatory sequences will contribute to differences in FMO3 metabolic capacity both within and among different populations. Furthermore, these differences may well contribute to differential susceptibility to environmental toxicants and adverse drug reactions both on individual and population bases.
Acknowledgments
We thank Dr. Pippa M. Simpson (Director of Statistics, Department of Pediatrics, University of Arkansas Medical Center, Little Rock, AR) for advice and assistance with the statistical analysis of data.
Footnotes
-
This work was supported in part by US Public Health Service grant CA53106 from the National Cancer Institute, as well as funds from the Children's Hospital of Wisconsin Foundation. The University of Miami and University of Maryland Brain and Tissue Banks for Developmental Disorders are under contract with the National Institute for Child Health and Development, N01-HD83284 and N01-HD83283, respectively.
-
ABBREVIATIONS: FMO, flavin-containing monooxygenase; SNP, single nucleotide polymorphism; kbp, kilobase pair(s); 24PDR, 24 sample subset of the Coriell Polymorphism Discovery Resource; PCR, polymerase chain reaction; SBE, single base extension; ANOVA, analysis of variance; bp, base pair(s).
- Received February 17, 2005.
- Accepted April 27, 2005.
- The American Society for Pharmacology and Experimental Therapeutics


