


Abstract
The application of pharmacogenetics holds great promise for individualized therapy. However, it has little clinical reality at present, despite many claims. The main problem is that the evidence base supporting genetic testing before therapy is weak. The pharmacology of the drugs subject to inherited variability in metabolism is often complex. Few have simple or single pathways of elimination. Some have active metabolites or enantiomers with different activities and pathways of elimination. Drug dosing is likely to be influenced only if the aggregate molar activity of all active moieties at the site of action is predictably affected by genotype or phenotype. Variation in drug concentration must be significant enough to provide “signal” over and above normal variation, and there must be a genuine concentration-effect relationship. The therapeutic index of the drug will also influence test utility. After considering all of these factors, the benefits of prospective testing need to be weighed against the costs and against other endpoints of effect. It is not surprising that few drugs satisfy these requirements. Drugs (and enzymes) for which there is a reasonable evidence base supporting genotyping or phenotyping include suxamethonium/mivacurium (butyrylcholinesterase), and azathioprine/6-mercaptopurine (thiopurine methyltransferase). Drugs for which there is a potential case for prospective testing include warfarin (CYP2C9), perhexiline (CYP2D6), and perhaps the proton pump inhibitors (CYP2C19). No other drugs have an evidence base that is sufficient to justify prospective testing at present, although some warrant further evaluation. In this review we summarize the current evidence base for pharmacogenetics in relation to drug-metabolizing enzymes.
I. Introduction/Perspective
Modern pharmacogenetics has its origins in the 1950s with a series of discoveries—primaquine sensitivity, slow isoniazid acetylation, and butyrylcholinesterase deficiency—that demonstrated the influence of genetics over drug response (Hughes et al., 1954; Alving et al., 1956; Kalow, 1956). However, it was decades later that research in molecular biology (Gonzalez et al., 1988) and the Human Genome Project greatly accelerated interest in the area. This led to some authors enthusiastically claiming that “... genotype testing has the potential to optimize drug therapy” (Meyer, 2000) and that there is sufficient evidence to warrant instigation of “... population pharmacogenetic testing” (Wolf et al., 2000). More recently, other authors have tempered the hope for pharmacogenetics and stated that “the promise of pharmacogenetics has largely remained unfulfilled” (Tucker, 2004). It therefore seems useful to take a hard look at the evidence behind such claims and counterclaims.
The main aim of this article is to critically review the literature to ascertain which pharmacogenetic tests for drug-metabolizing enzymes should be undertaken clinically and in relation to what drugs. A second aim is to propose a list of drugs for which the case for pharmacogenetically based dose individualization is strongest. As few clinicians actually assess genotype or phenotype prospectively to individualize dose (Gardiner and Begg, 2005), it seems likely that some claims of clinical relevance are excessive or premature.
A. Background on Pharmacogenetics
The term “pharmacogenetics” has historically been used to describe the field, but the term “pharmacogenomics” has been a recent addition. Whereas there are subtle differences, with pharmacogenomics having a wider brief, it is not clear that our understanding has been increased by having two such similar terms. We, therefore, will use the term pharmacogenetics in this article, referring to any influence that genetics may have on drug therapy.
A second point of confusion is related to the use of the term “function”. There have been many articles on the functional effects of genetic polymorphisms, which to a molecular biologist may refer to changes in protein expression, but to a clinician might refer to effects that are important in the clinic. Furthermore, the term “clinical importance” may, to some, relate to effects that have been proven in practice, whereas to others it may also include the potential for clinical relevance.
“Polymorphism” also has different meanings within pharmacogenetics. We accept the broad definition of polymorphism as the presence of two or more variants (e.g., alleles and phenotypes) in a population that occur at a significant frequency. What constitutes a “significant frequency” is not particularly clear, although most authors seem to accept 1% as the cutoff. Thus, thiopurine methyltransferase is polymorphic genotypically and phenotypically, with the most common genetic variant (TPMT*3A) having an allele frequency of ∼4% in German Caucasians, whereas absolute and partial enzyme deficiency affect 0.6 and 10% of the population, respectively (Schaeffeler et al., 2004).
Many review articles describe genetic variations related to many mechanisms that may be relevant to drug therapy (Meyer, 2000; Wolf et al., 2000; Weinshilboum, 2003). Effects may be on genes that code for metabolizing enzymes, transporters, receptors, and/or ion channels. The effects can be described as pharmacokinetic (affecting drug concentrations) and pharmacodynamic (affecting drug action). In this article our discussion is limited to genetic variations affecting pharmacokinetics via effects on metabolism. Other aspects of pharmacokinetics (e.g., absorption) are also potentially affected by genetic variation, but those that affect clearance (drug elimination) and hence steady-state concentrations are most important for chronic dosing.
The major routes of drug elimination are renal excretion and metabolic biotransformation. The latter can be subdivided into cytochrome P450 (P4501)-mediated reactions, conjugations (especially glucuronidation) and “others” (Table 1). There are many sources of variation in enzyme activity, including age, enzyme induction or inhibition, and diseases (especially of the liver). Variation in the DNA sequence of genes encoding enzymes can abolish, reduce, or increase the expression and activity of an enzyme. Individuals with two alleles coding for “normal” enzyme function are termed homozygous extensive metabolizers (homozygous EM or “wild-type”) whereas those with two variant alleles resulting in inactive or absent enzyme are “poor metabolizers” (PM). There may also be an intermediate metabolizer (IM) phenotype with reduced function, which usually results from the presence of one variant and one normal allele (heterozygous EM). Intermediate and extensive metabolizers are often collectively referred to as “extensive metabolizers”, especially in studies in which metabolizer status is assigned using phenotype. Gene duplication or multiplication has only been identified for CYP2D6 and can lead to ultrarapid metabolism (UM).
Approximate incidence of the major pathways of drug elimination
To assess the clinical relevance of pharmacogenetics, a perspective is necessary. Simplistically, standard drug doses will achieve normal concentrations and effect in homozygous EMs (which usually comprise the largest proportion of the population), but might be toxic in PMs (and maybe in heterozygous EM or IMs) and ineffective in UMs. For polymorphisms to be important clinically, the signal of their effect must be greater than the noise from all the other sources of variance. Similarly, the therapeutic index (the size of the window between efficacy and toxicity) of each drug must be considered. If a drug is safe over the wide range of concentrations that encompasses the variation caused by genetics (i.e., high therapeutic index), then it is not important to consider polymorphisms in the therapeutic context. By contrast, if a drug has a low therapeutic index (e.g., warfarin), minor variations in concentrations, such as from polymorphisms, may be important.
There are other effects that may neutralize or abolish the clinical significance of a genetic polymorphism. If the product of an enzymatic reaction has activity similar to that of the parent molecule, an altered ratio of parent to metabolite (through polymorphism) may have little clinical effect. Similarly, if a drug is metabolized or eliminated by multiple pathways, total ablation of one pathway (as in a PM) may result in minimal alteration of overall drug concentrations and hence minimal effect. The presence of stereoselective metabolism complicates things further, as sometimes the enantiomers have different pharmacological activity and pathways of elimination. It is the aggregate area under the concentrationtime curve (AUC) of molar activity at the site of action that is important in overall drug effect. There is also the phenomenon of “phenocopying”, which describes the conversion of a patient from a phenotypic normal metabolizer to a slow metabolizer as a result of inhibition of the enzyme by another drug or by itself (“autophenocopying”). If all patients taking a drug are ultimately poor metabolizers either by their genetics or by phenocopying, then the genetics are essentially irrelevant. Phenocopying sometimes explains why differences between PMs and EMs is less at steady state than after single doses.
The net effect of the above is that many (if not most) single-pathway genetic polymorphisms are unlikely to have major clinical importance unless the following attributes apply:
-
The effects of the polymorphism on the total concentrations of all the active moieties are dramatic.
-
There is a clear association of concentration with desired effect.
-
There are significant (severe) concentration-related (type A) adverse effects.
-
The drug has a low therapeutic index.
Further, assessment of drugs in relation to polymorphisms is difficult unless the following apply:
-
There is only one major active moiety.
-
The elimination is mainly via a single pathway mediated by the polymorphism.
-
There are no enantiomers of varying activity or elimination route.
-
There is no autophenocopying.
It is often stated that in addition to the above, prospective studies should be undertaken to confirm clinical benefits (e.g., of genotype-directed dose regimens). It is unlikely that such studies will be performed for the vast majority of drugs. However, it would certainly assist the evidence base if some key drug-gene pairings were examined prospectively so that the paradigm of prospective testing was put on a firm foundation. Thereafter, clinical uptake is likely to follow the practice of clinicians who have ready access to a particular test that they perceive to have clinical merit. Clearly, from a population health funding perspective, other factors such as supportive pharmacoeconomic analyses are also helpful.
All of these factors need to be considered in the assessment of the evidence base supporting testing for pharmacogenetic effects of drugs. To do this in a semi-objective manner, an algorithm was developed (Table 2), based on the Naranjo algorithm for assessing adverse effect likelihood (Naranjo et al., 1981). We are not necessarily advocating the use of this algorithm, as it has not been validated formally, but it was helpful in a general sense to formalize the assessment of the current evidence base and comparison between drugs.
Algorithm for strength of association Scoring: 2 points for strong effect/evidence, 1 point for weak effect/evidence, 0 for no effect/evidence.
The best pharmacokinetic endpoint for the assessment of pharmacogenetic effects is the AUC, usually of serum, plasma, or blood. For the purposes of this review, known polymorphisms will be examined with respect to the magnitude of change in AUC, the therapeutic index of the drug, the presence of other pathways of elimination that may “dilute” the primary effect, other potential pharmacokinetic effects, and evidence of actual differences in clinical endpoints (efficacy and adverse effects). The applicability of pharmacogenetics in current therapeutics will also be examined, along with suggestions about how this area might be improved.
B. Pathways with Genetic Variation That May Be Important Clinically
All of the pathways involved in drug metabolism (Table 1) have the potential to be affected by genetic variation. The activities of many of these enzymes (e.g., CYP2D6, thiopurine methyltransferase) meet our general description of polymorphism in terms of the expressed phenotypes and will be discussed in turn. The enzyme family most important for overall drug metabolism (CYP3A) has activity that is unimodally distributed and can largely be disregarded for the purpose of this review (the subfamily CYP3A5 may be an exception and is discussed in section II.D.). Although genetic variations in metabolism are recognized as influencing nicotine and alcohol disposition and effect, these will not be discussed here.
The first evidence of polymorphisms in drug-metabolizing enzymes having clinical effect was the observation of slow acetylation in relation to isoniazid (Price Evans et al., 1960). The first evidence supporting genetic polymorphism related to P450 enzymes came almost two decades later with the almost simultaneous observations of a greater response to sparteine and debrisoquine occurring in a subgroup of the population known as “slow hydroxylators” (Mahgoub et al., 1977; Eichelbaum et al., 1979). The first evidence that genetic polymorphisms were taken seriously in the clinic relates to butyrylcholinesterase deficiency in anesthetics (section III.).
II. Cytochrome P450
P450 enzymes are a group of heme proteins found largely in hepatocytes, but also in the small intestine, lungs, kidneys, and brain. The major families responsible for the oxidative metabolism of drugs and environmental chemicals are CYP1, CYP2, and CYP3. These enzymes also metabolize a diverse range of endogenous substances (e.g., steroids). The physiological consequences of polymorphism in P450 enzymes in the absence of drug therapy will not be discussed in this review.
In the excellent review of Weinshilboum (2003), a small number of drugs with “proven” clinical effect from P450 polymorphisms were listed. These included debrisoquine, sparteine, nortriptyline, and codeine for CYP2D6, warfarin and phenytoin for CYP2C9, and omeprazole for CYP2C19. The implication was that these drugs may be the tip of the iceberg and that many of the other drugs metabolized by these pathways are also likely to be affected to a clinically important extent. For reasons noted above we believe this is unlikely. We will now review the evidence, as we have found it, to determine which drugs are affected or are likely to be affected to a clinically important extent because of a significant change in AUC of the active moiety.
A. CYP2D6
Approximately 7 to 10% of European Caucasians and 1% of Chinese, Japanese, and Koreans are PMs of CYP2D6 (Nakamura et al., 1985; Alvan et al., 1990; Sohn et al., 1991; Bertilsson et al., 1992). Many variant alleles are associated with the PM phenotype, although most of these occur infrequently (http://www.cypalleles.ki.se). In Caucasians, CYP2D6*3, *4, and *5 produce inactive enzyme or no protein product and are the variants most commonly implicated in the PM phenotype. CYP2D6*4 is the most common variant allele in Caucasians (allele frequency ∼21%) (Sachse et al., 1997; Cascorbi, 2003), but it is virtually absent in Chinese. However, overall CYP2D6 activity is lower in Chinese than in Caucasians (Bertilsson et al., 1992) as a result of the high allele frequency of CYP2D6*10 (∼50%) which is largely absent in Caucasians. This variant produces an unstable enzyme with reduced (but not absent) ability to metabolize substrate drugs. At the other end of the spectrum, gene duplication/multiplication occurs in ∼1% of Swedish Caucasians (Dahl et al., 1995), 7% of white Spaniards (Agundez et al., 1995), and 29% of black Ethiopians (Aklillu et al., 1996) and is predictive of an UM phenotype. Genotyping for the more common variant alleles in a population can predict phenotype (PM versus EM) with high accuracy (∼99%) in a population of defined ethnicity (Sachse et al., 1997) and avoids the logistic problems with drug administration for phenotyping. However, some problems remain. For example, rare mutations may not be identified with “routine” genotyping methods, and many individuals with the UM phenotype may not have gene duplication/multiplication (Dahl et al., 1995).
CYP2D6 is the most widely studied enzyme in relation to polymorphisms and is involved in the elimination of ∼25% of drugs. Substrates are largely lipophilic bases and include some β-blockers, antidepressants, neuroleptics, antiarrhythmics, and opioids (Table 3). As noted earlier, however, just because a drug is a substrate for CYP2D6, clinical effects related to polymorphism cannot be assumed.
Difference in drug concentrations with CYP2D6 metabolizer status and evidence for and against genotyping Only studies involving oral drug administration and adult subjects were included. Case reports were excluded. AUC differences were significant unless otherwise specified. Cp12 h (concentration at 12 h post-dose) or Cpmin (trough concentration) were used only if AUC data were not available. No differentiation is made between *1 and *2 alleles. Heterozygous (het) EM is used when one high-activity allele and one-low activity allele (e.g., *1/*3) are present. PM refers to two low-activity alleles or a poor metabolizer phenotype. EM refers to combined het EM and homozygous (hom) EM, either known (genotype) or presumed (phenotype).
1. Tricyclic Antidepressants.
These drugs have a moderate therapeutic index, as they produce significant adverse effects at therapeutic concentrations and are dangerous in overdose. Tricyclic antidepressants (TCAs) are high-clearance, lipid-soluble drugs that are metabolized via multiple pathways involving both phase I (P450) and phase II (glucuronidation) processes. They exist as tertiary or secondary amines, and the tertiary forms are metabolized to secondary amines. Both tertiary and secondary amines are active, as are some of the subsequent hydroxylated metabolites. The tertiary amines are metabolized by many P450s, whereas the secondary amines are largely metabolized by CYP2D6. In addition, there may be differential metabolism of enantiomers. As these drugs have complex pharmacology, it is always going to be difficult to establish clear associations with genetic variations. The lesser complexity of the secondary TCAs (when administered as such, rather than as metabolites of the tertiary forms) and a more convincing involvement of these with CYP2D6 suggest a greater chance of establishing associations.
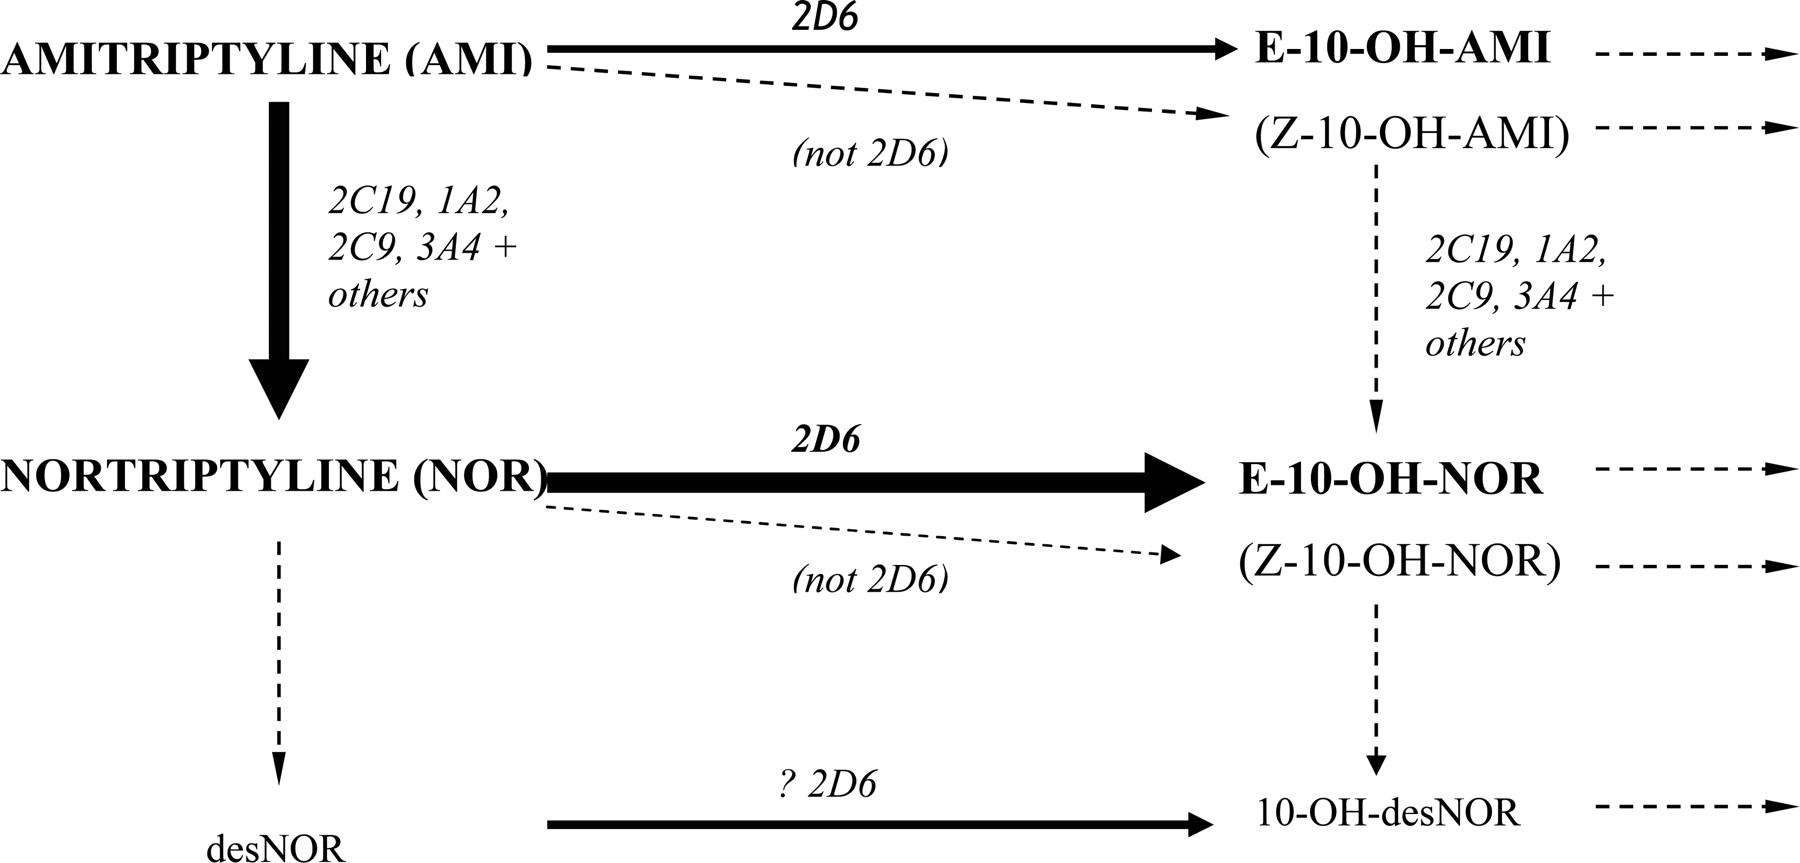
Main routes of amitriptyline metabolism (routes for other tricyclic antidepressants are very similar).
a. Amitriptyline (tertiary)/nortriptyline (secondary).
Most TCAs are handled similarly to amitriptyline and nortriptyline (Fig. 1). Metabolism of amitriptyline results in potentially eight active moieties, including amitriptyline, nortriptyline, the hydroxy metabolites of each (which are active but less so than the respective parents), and the respective enantiomers (Nordin and Bertilsson, 1995). CYP2D6 mediates the conversions to E-10-hydroxyamitriptyline and E-10-hydroxynortriptyline (Mellstrom et al., 1981; Breyer-Pfaff et al., 1992; Olesen and Linnet, 1997), whereas demethylation of amitriptyline to nortriptyline and of E-10-hydroxyamitriptyline to E-10-hydroxynortriptyline is by multiple P450s but especially CYP2C19 (Olesen and Linnet, 1997; Venkatakrishnan et al., 1998; Yan et al., 1998). Subsequent metabolism of hydroxy derivatives is generally via glucuronidation. Both amitriptyline and nortriptyline inhibit CYP2D6 but not enough to phenocopy (Baumann et al., 1992; Solai et al., 2002).
As the pharmacology is complex, it is not surprising that demonstrating clear effects for amitriptyline has been difficult. A significant correlation between amitriptyline clearance and the debrisoquine metabolic ratio has been observed in nonsmokers (Mellstrom et al., 1983, 1986) supporting some CYP2D6 dependence. In a recent study, patients with one dysfunctional CYP2D6 allele had a greater risk of side effects with amitriptyline 150 mg daily than those with two functional alleles (77 versus 12%), and this risk was associated with higher nortriptyline concentrations (Steimer et al., 2005).
The metabolism of nortriptyline, when administered as such, is simpler and is mediated mainly (>80% in EMs) by CYP2D6 (Bertilsson et al., 1980; Mellstrom et al., 1981; Nordin et al., 1985; Olesen and Linnet, 1997; Venkatakrishnan et al., 1999). After giving a 25-mg dose to Caucasians, the mean nortriptyline AUCs in genotypic PMs, IMs, and UMs were 3.3-, 2.8-, and 0.7-fold that observed in EMs, with reciprocal changes in 10-hydroxynortriptyline concentrations (Dalen et al., 1998). Changes in AUC have also been seen with reduced activity alleles (e.g., CYP2D6*10) in Asian subjects (Yue et al., 1998; Morita et al., 2000). The major metabolite produced by CYP2D6, E-10-hydroxynortriptyline, has approximately half the potency of the parent in inhibiting noradrenaline reuptake and greatly reduced anti-cholinergic activity (Nordin and Bertilsson, 1995). It is often present at comparable (or higher) concentrations to the parent drug and may contribute to the antidepressant effects (Nordin and Bertilsson, 1995). In one study, the sole PM among 21 Caucasians receiving nortriptyline 100 mg (n = 1, a heterozygous EM) or 150 mg (n = 20) daily achieved nortriptyline plus 10-hydroxynortriptyline concentrations that were only slightly above the mean observed in heterozygous and homozygous EMs (10.9, 7.0, and 7.8 nM/mg, respectively) (Dahl et al., 1996).
Evidence of variation in clinical effect in relation to nortriptyline and metabolizer status is sparse. A number of case reports have documented toxicity (e.g., dizziness and sedation) with elevated nortriptyline concentrations in PMs and individuals receiving CYP2D6 inhibitors (Bertilsson et al., 1981; van der Kuy et al., 2002). Cases of treatment failures in UMs are also documented (Bertilsson et al., 1985). However, clinical endpoints (salivation, accommodation, sedation, blood pressure, and pulse rate) did not vary between genotypes in a single-dose study in healthy subjects (Dalen et al., 1998). In another study of patients with depression, CYP2D6 did not influence the rate of adverse reactions to nortriptyline (Roberts et al., 2004). As the main metabolite is active, altered parent/metabolite ratios may be the reason that altered effect has been hard to demonstrate; i.e., there is minimal change in overall molar activity. It is notable that the major metabolite does not seem to have been measured in most of the assessments and is not considered clinically during therapeutic drug monitoring.
b. Imipramine (tertiary)/desipramine (secondary).
Imipramine is metabolized to desipramine via CYP2C19, 1A2, and 3A4 (Lemoine et al., 1993; Skjelbo et al., 1993; Madsen et al., 1995; Spina et al., 1997a), and both compounds are metabolized to their hydroxy derivatives, which are also active (Nordin and Bertilsson, 1995), largely via CYP2D6 (Brosen et al., 1986a; Brosen and Gram, 1989; Madsen et al., 1995). Data regarding enantiomers are lacking. The clearance of imipramine in PMs is approximately half that of EMs after a single dose, although steady-state concentrations may remain within the range of EMs, perhaps due to saturable kinetics in EMs (Brosen et al., 1986a,b). Desipramine concentrations at steady-state are 7-fold higher in PMs, with the sum of imipramine plus desipramine concentrations being 5-fold higher in PMs than in EMs (Brosen et al., 1986a). Although not well established, the sum of imipramine plus desipramine concentrations may be used to monitor treatment with imipramine, and PMs generally require lower doses to attain the target concentrations. For example, PMs required 20 to 25 mg/day, whereas EMs required 50 to 350 mg/day to produce summed concentrations of ∼300 to 500 nM in the treatment of diabetic neuropathy (Sindrup et al., 1990a). Data supporting increased adverse effects in PMs is again lacking for imipramine (Meyer et al., 1988).
After a single desipramine dose, the mean AUCs of desipramine were 4- to 8-fold higher in PMs and 1.8-fold higher in IMs than in EMs (Brosen et al., 1986b; Spina et al., 1987; Steiner and Spina, 1987). Mean steady-state concentrations were ∼3-fold higher in PMs (Spina et al., 1997b). Similar effects have been seen in Japanese (Shimoda et al., 2000b). In one study, two PMs received a greatly reduced dose compared with that given to EMs (50 mg versus 200 mg daily) and still attained desipramine concentrations at the upper end of the range observed in EMs (860 and 880 versus 130 to 910 nM) (Sindrup et al., 1990b). Evidence for increased toxicity in PMs is harder to find. In one study of 2 PMs and 29 EMs receiving desipramine 100 mg daily, three patients (including both PMs) required a dose decrease because of sedation or postural hypotension. Efficacy at 3 weeks did not correlate with dextromethorphan metabolic ratio or desipramine plasma concentrations (Spina et al., 1997b). In the absence of a clear concentration-effect relationship for desipramine, these findings are collectively hard to interpret.
c. Clomipramine (tertiary)/desmethylclomipramine (secondary).
Demethylation of clomipramine to desmethylclomipramine (active) is via CYP2C19, 1A2, and 3A4, and each compound is metabolized to respective hydroxy derivatives via CYP2D6 (Kramer Nielsen et al., 1992, 1994, 1996; Nielsen et al., 1996; Gram et al., 1999). The clomipramine AUC was ∼1.8-fold higher in PMs than in EMs after a single dose (Kramer Nielsen et al., 1994). During twice daily treatment, one PM had trough concentrations of clomipramine, desmethylclomipramine and clomipramine plus desmethylclomipramine that were ∼3-fold higher than the median of the respective compound(s) in EMs (n = 36). The clomipramine concentration was within the EM range (570 in the PMs versus 70-730 nM in the EMs), whereas desmethylclomipramine and summed concentrations were 20 to 40% above the upper concentration in EMs (Kramer Nielsen et al., 1992). In another study, the summed concentrations were higher in two PMs (590 and 750 nM) than in EMs (70-510 nM) despite receiving a lower dose (50 versus 75 mg/day) (Sindrup et al., 1990b). There is little evidence for altered effect in relation to CYP2D6 metabolizer status.
d. Doxepin (tertiary)/desmethyldoxepin (secondary).
Doxepin is given as a 15:85 mixture of Z-(cis)-/E-(trans)-isomers which differ in activity, with Z-doxepin suggested to have greater antidepressive effect (Pinder et al., 1977). Desmethyldoxepin (active) is produced by several enzymes (e.g., CYP2C19), whereas CYP2D6 stereospecifically hydroxylates the E-isomers of doxepin and desmethyldoxepin (Haritos et al., 2000; Hartter et al., 2002; Kirchheiner et al., 2002d). The AUC of the active moieties after a single dose was ∼3-fold higher in PMs than in EMs, whereas IMs behaved similarly to EMs (Kirchheiner et al., 2002d). There seems to be no data that quantify modified clinical outcomes with CYP2D6 status.
2. Selective Serotonin Reuptake Inhibitors.
The selective serotonin reuptake inhibitors (SSRIs) are generally thought to have a higher therapeutic index than TCAs. However, they have a wide range of adverse effects at clinical concentrations and are associated with the serotonin syndrome, which may be fatal. Like the TCAs, they are very lipid-soluble, high-clearance drugs subject to multiple metabolic pathways, and renal elimination is not relevant to the active moieties.
a. Fluoxetine.
R- and S-fluoxetine are metabolized (in part) to R- and S-norfluoxetine. These compounds share similar serotonin reuptake inhibition, although R-norfluoxetine is ∼20 times less potent (Fuller et al., 1992). CYP2D6 is the main enzyme producing S-norfluoxetine at low concentrations, with other enzymes (e.g., CYP3A4) filling in when this enzyme becomes saturated. CYP2C9 and CYP2D6 are largely responsible for R-norfluoxetine production (Margolis et al., 2000; Ring et al., 2001). Saturable metabolism and some autophenocopying occurs with chronic dosing (Alfaro et al., 2000; Amchin et al., 2001).
After a 20-mg dose, the AUC of fluoxetine was 3.9-fold higher and that of norfluoxetine was 0.5-fold lower in PMs than in EMs, whereas the sum of these moieties was 1.3-fold higher in PMs (Hamelin et al., 1996). After a higher 60-mg dose, the median AUCs of S- and R-fluoxetine were 11.5- and 2.4-fold higher in PMs, respectively, whereas S- and R-norfluoxetine were decreased marginally (∼0.8- and 0.6-fold, respectively) (Fjordside et al., 1999). After 23 days of fluoxetine 20 mg daily the sum of racemic parent plus norfluoxetine trough concentrations was comparable between PMs and EMs. Enantiomers were also examined, with no significant difference seen in the concentrations of R-fluoxetine and R-norfluoxetine, whereas S-fluoxetine was 2.2-fold higher and S-norfluoxetine was 3.4-fold lower in PMs than in EMs (Eap et al., 2001). In small studies a relationship between CYP2D6 status and adverse reactions with fluoxetine has not been identified (Clark et al., 2000; Stedman et al., 2002; Roberts et al., 2004). This finding is not unexpected given that the activity of the two S-moieties is similar (although residence time would also be a factor).
b. Paroxetine.
Paroxetine is inactivated by CYP2D6 and at least one other enzyme (Bloomer et al., 1992). The median paroxetine AUC was 7-fold higher in PMs after a 30-mg dose but diminished to 1.7-fold with chronic dosing (Sindrup et al., 1992c). Another steady-state study reported 3.3-fold higher 12-h concentrations in PMs than in EMs (Sindrup et al., 1992b). The difference observed with single versus repeated dosing is due to saturable metabolism (Sindrup et al., 1992b; Laine et al., 2001), which results in autophenocopying (Lam et al., 2002; Solai et al., 2002). Heterozygous EMs had nonsignificant 2-fold higher median steady-state trough concentrations than homozygous EMs (Ozdemir et al., 1999), although considerable overlap existed. Some have reported that UMs may have very low or undetectable concentrations of paroxetine with usual doses (Lam et al., 2002; Charlier et al., 2003). Data on the clinical implications are lacking, although one study (without pharmacokinetic assessment) suggested that sexual dysfunction was more frequent in those who were genotypically EMs, but who were phenotyped as PMs during treatment (17 of 24 patients or 71%) compared with those who were phenotyped as EMs (2 of 6 or 33%) (p = 0.015) (Zourkova and Hadasova, 2002). However, it seems unlikely that knowledge of the CYP2D6 genotype will assist with dosing given the unpredictable phenocopying that occurs. In addition, paroxetine concentrations do not seem to correlate with effect (as is the case with SSRIs as a class) (Lam et al., 2002).
c. Other selective serotonin reuptake inhibitors.
Fluvoxamine is metabolized in part by CYP2D6 and to a lesser extent by CYP1A2 (Spigset et al., 2001). Data are conflicting regarding the effect of CYP2D6 on fluvoxamine concentrations, with a single-dose study reporting a 1.3-fold higher AUC in PMs (Spigset et al., 2001), whereas in another no difference was observed (Christensen et al., 2002). Similar disparities were observed at steady state (Spigset et al., 1998; Christensen et al., 2002). Overall, the effect of the CYP2D6 genotype seems to be minor.
CYP2D6 status has little relevance for sertraline, which is metabolized by many P450s, including CYP2C19 (discussed later) (Hamelin et al., 1996; Kobayashi et al., 1999b; Xu et al., 1999). Likewise, citalopram is metabolized to a less active metabolite (desmethylcitalopram) mainly by CYP2C19 and 3A4 (∼35% each in EMs) and thence to didesmethylcitalopram (less active again) by CYP2D6 (Sindrup et al., 1993; Kobayashi et al., 1997; von Moltke et al., 1999, 2001; Herrlin et al., 2003). The AUC of racemic or S-citalopram (active enantiomer) does not vary appreciably with CYP2D6 status (Sindrup et al., 1993; Herrlin et al., 2003).
3. Other Antidepressants.
a. Maprotiline.
Maprotiline is metabolized to desmethylmaprotiline (active) mainly (∼80% in EMs) by CYP2D6 (Brachtendorf et al., 2003). Other metabolites (e.g., hydroxy derivatives) (Breyer-Pfaff et al., 1985) may also be active. The AUC of maprotiline (metabolites not measured) was 3.5-fold higher in PMs than in EMs after 50 mg twice daily for 8 days, and the half-life was proportionately longer. Prolonged histamine-induced bronchoconstriction has been seen in PMs (Firkusny and Gleiter, 1994).
b. Mianserin.
Production of desmethylmianserin (active) is largely by CYP1A2 (>50%), with CYP2D6 being involved in other pathways, including hydroxylation (8-hydroxymianserin is active) and further metabolism of desmethylmianserin (Pinder and van Delft, 1983; Dahl et al., 1994; Koyama et al., 1996a; Eap et al., 1998, 1999; Stormer et al., 2000). Consistent with this result, the mean AUCs of mianserin and desmethylmianserin were 1.8- and 1.5-fold higher, respectively, in PMs than in EMs (Dahl et al., 1994). A PM for both debrisoquine and mephenytoin had the highest summed concentrations among 18 patients with diabetic neuropathy (Sindrup et al., 1992d), and three of six patients with high mianserin concentrations were phenotypic PMs in another study (Tacke et al., 1992). In contrast, only one of seven patients with slow mianserin elimination was a PM, which does not support an important role for CYP2D6 (Begg et al., 1989).
S-Mianserin is more reliant on CYP2D6 (Dahl et al., 1994; Yasui et al., 1997; Eap et al., 1998) and may have a greater antidepressant effect than R-mianserin (Pinder and van Delft, 1983). Higher mean S-mianserin plasma concentrations and a slightly greater response were seen in Japanese patients with the CYP2D6*1/*10 versus those with the *1/*1 genotype (15 versus 8 mg/l at 12-h postdose) after 30 mg daily for 3 weeks (Mihara et al., 1997). Thioridazine inhibited CYP2D6 and increased S-mianserin, S-desmethylmianserin, and R-desmethylmianserin concentrations by 1.9-, 2.1- and 2.7-fold, respectively, whereas no effect on R-mianserin was observed (Yasui et al., 1997).
c. Venlafaxine.
There are multiple metabolic pathways and stereoisomerism, with the major route of metabolism to the equiactive O-desmethylvenlafaxime being partially mediated by CYP2D6 (Holliday and Benfield, 1995; Otton et al., 1996; Lessard et al., 1999). The ratio of parent to metabolite is significantly greater in PMs than in EMs, but the sum of parent and active metabolite seems similar (Fukuda et al., 1999, 2000; Veefkind et al., 2000), suggesting that polymorphism has minor clinical importance. CYP2D6 preferentially metabolizes R-venlafaxine (Eap et al., 2003), which has greater inhibitory effects on noradrenaline reuptake than the S-enantiomer but comparable serotonin reuptake inhibition (Holliday and Benfield, 1995). This finding could suggest that PMs may have greater serotonergic effects, although the activities of the metabolite enantiomers are not known. Some have suggested that PMs may be at risk of cardiac toxicity with this drug, although this theory is based on a small series of four subjects (Lessard et al., 1999), and there is no other supporting evidence.
4. Antidepressants (in General) and Clinical Outcomes.
As described above, there are case reports of toxicity in PMs (Bertilsson et al., 1981; Bluhm et al., 1993) and lack of effect in UMs (Bertilsson et al., 1985, 1993). In addition, there is some evidence to suggest that more problems with antidepressants (duration of hospital stay and frequency of adverse effects) occur at the extremes of CYP2D6 activity (Chou et al., 2000). A recent retrospective study reported that 29% of individuals with adverse reactions to antidepressants (most commonly TCAs) were genotypic PMs, whereas 19% (3 of 16) of nonresponders were genotypic UMs (4- and 5-fold higher than expected, respectively) (Rau et al., 2004). Consistent with this finding, a higher rate of CYP2D6 gene duplication was seen in patients in whom treatment with antidepressants metabolized by CYP2D6 failed (10 versus 1% expected) (Kawanishi et al., 2004). These initial studies suggest that prospective genotyping for CYP2D6 may identify individuals at increased risk of adverse reactions or treatment failure with antidepressants. However, although it is clear that toxicity and treatment failures are major issues in psychiatry, most adverse reactions and treatment failures occur in individuals who are EMs rather than PMs or UMs. This is not surprising since EMs are more frequent. Furthermore, although recommendations for antidepressant dose adjustment based on genotype have been proposed (Kirchheiner et al., 2001, 2004c) the effectiveness of this approach has not been validated. Large prospective studies (perhaps testing these dose recommendations) should be undertaken.
5. Antipsychotics.
This is a structurally diverse group of drugs with a moderate to high therapeutic index [except maybe thioridazine, use of which has been decreasing because of its unfavorable benefit to risk (arrhythmia) profile]. They are generally very lipid-soluble, subject to high clearance and eliminated by metabolic rather than renal mechanisms. Some, but not all, are dependent on CYP2D6. A strong concentration-effect relationship has not been established for this group.
a. Chlorpromazine.
Chlorpromazine has many metabolites, at least one of which, 7-hydroxychlorpromazine, is active (Bunney and Aghajanian, 1974; Levy et al., 2000). This metabolite is partly (∼50%) produced by CYP2D6 (Muralidharan et al., 1996; Yoshii et al., 2000). In Korean volunteers, nonsignificant 1.3- and 1.7-fold higher chlorpromazine AUCs were seen in heterozygotes and homozygotes for CYP2D6*10 (Sunwoo et al., 2004). These differences are minor, and intersubject variation is substantial. Consequently, the CYP2D6 genotype is unlikely to be helpful for chlorpromazine.
b. Haloperidol.
This drug has complex metabolism, with CYP2D6 involvement appearing to be minor. Cytosolic carbonyl reductase produces reduced haloperidol, which has 10 to 20% of the activity of the parent and is metabolized further by CYP3A4 and glucuronosyltransferases. Reduced haloperidol is also back-oxidized to haloperidol primarily by CYP3A4 (Pan et al., 1998; Kudo and Ishizaki, 1999; Tateishi et al., 2000). Other metabolic pathways include N-dealkylation by CYP3A4 and others, and direct glucuronidation (Kudo and Ishizaki, 1999; Tateishi et al., 2000). Although it seems that CYP3A4 is the most important enzyme for the overall disposition of haloperidol, CYP2D6 may also play a minor role (Llerena et al., 1992a). A single-dose study showed 2-fold greater haloperidol clearance in EMs than in PMs, and mean reduced haloperidol concentrations were 2- to 4-fold higher in PMs from 10 to 72 h postdose (Llerena et al., 1992a,b). This result is difficult to understand but may suggest CYP2D6 involvement in the metabolism of reduced haloperidol. In Caucasian and Japanese subjects, steady-state haloperidol concentrations tend to be a little higher in those with variant alleles, or sometimes there is no appreciable difference (especially with the CYP2D6*10 variant). Reduced haloperidol concentrations are more consistently elevated in those with variant alleles, suggesting greater reliance on CYP2D6 (Suzuki et al., 1997; Mihara et al., 1999; Pan et al., 1999; Shimoda et al., 2000a; Ohnuma et al., 2003). However, these differences often fail to reach statistical significance, and clinical relevance is limited by the overlap in concentrations between genotypes.
There is little evidence for clinical relevance of genotype, with a Chinese study (n = 18) reporting no relationship between CYP2D6 and antipsychotic symptoms with haloperidol 10 mg daily (Lane et al., 1997). In contrast, a study of eight Caucasian patients treated with depot haloperidol for schizophrenia reported that the highest haloperidol concentrations and dopamine-2 receptor occupancy (determined by positron emission tomography) were in the sole PM (Nyberg et al., 1995b). In a Korean study, 60% of individuals with the CYP2D6*1/*10 or *10/*10 genotypes (n = 93) required benztropine compared with 35% of EMs (n = 23) (Roh et al., 2001a). The complexity of haloperidol pharmacokinetics indicates that knowledge of CYP2D6 genotype is unlikely to be helpful clinically.
c. Perphenazine.
Perphenazine is primarily metabolized to N-dealkylperphenazine, perphenazine sulfoxide, and 7-hydroxyperphenazine, with the activity of the latter metabolite comparable with that of the parent in vitro (the activity of the other metabolites is not clear) (Hals et al., 1986). CYP2D6 metabolizes perphenazine in vitro (Olesen and Linnet, 2000), and an in vivo study showed a 4-fold higher perphenazine AUC in PMs after a single dose (Dahl-Puustinen et al., 1989). Similarly, steady-state studies demonstrated a 2-fold higher median AUC (Linnet and Wiborg, 1996b) and a 3-fold decrease in clearance (Jerling et al., 1996) in PMs. The strong CYP2D6 inhibitor, paroxetine, increased the AUC 7-fold in EMs and was associated with a significant increase in central nervous system symptoms (sedation, extrapyramidal symptoms, and psychomotor performance) (Ozdemir et al., 1997). In elderly patients with dementia, perphenazine 0.05 to 0.1 mg/kg/day led to improved psychotic symptoms overall without any difference between EMs (n = 40) and PMs (n = 5). However, PMs had significantly more side effects (primarily extrapyramidal and sedative) early in treatment that became similar in both phenotypes by day 17 of dosing (Pollock et al., 1995). Overall, the intergroup differences in perphenazine AUC suggests possible clinical relevance, although the failure to measure the active metabolites in vivo dilutes this somewhat. However, considerable overlap in concentrations exists between CYP2D6 groups, which is likely to decrease the value of prospective genotyping or phenotyping.
d. Thioridazine.
The production of mesoridazine, the first metabolite (also known as thioridazine 2-sulfoxide), correlates weakly with the debrisoquine metabolic ratio (Llerena et al., 2000, 2002; Berecz et al., 2003), whereas the subsequent metabolite sulforidazine (thioridazine 2-sulfone) does not seem to be reliant on CYP2D6 (von Bahr et al., 1991; Eap et al., 1996). The metabolites seem to have activity equal to (sulforidazine) or greater (mesoridazine) than that of the parent (Kilts et al., 1984), whereas a further ring sulfoxide (thioridazine 5-sulfoxide) produced from thioridazine may be less active as an antipsychotic, but more arrhythmogenic (Hale and Poklis, 1986). After a single dose, the sum of active moieties (thioridazine + mesoridazine + sulforidazine) was ∼1.4-fold higher in PMs, largely due to a 4.5-fold increase in thioridazine itself (von Bahr et al., 1991). Consistent with this, the dose-corrected median steady-state plasma thioridazine concentrations were 3.8- and 1.8-fold higher in the presence of no or one active CYP2D6 alleles, respectively, compared with two active alleles. Median concentrations of mesoridazine and sulforidazine were not statistically different (Berecz et al., 2003).
There are limited data on CYP2D6 and adverse effects. A case report described marked oversedation with high thioridazine concentrations in a PM (Meyer et al., 1990). One study reported a weak correlation between QTc interval and thioridazine plasma concentrations, debrisoquine metabolic ratio, and thioridazine/mesoridazine concentrations (r = 0.3 for each comparison) (Llerena et al., 2002). However, contradictory findings were found in another study in which QTc interval correlated with plasma concentrations of thioridazine, mesoridazine, and sulforidazine, but no relationship with CYP2D6 genotype was seen (Thanacoody et al., 2003). Dahl (2002) concluded that CYP2D6 is of importance, based on the study of von Bahr et al. (1991). However, the evidence for this conclusion seems poor, and the likelihood of clinical relevance low, given the multiple metabolic pathways, interindividual variability in pharmacokinetics, and the phenocopying in up to 80% of patients (Llerena et al., 2001; Berecz et al., 2003). Further confusing the picture is the presence of R- and S-enantiomers of thioridazine (and the metabolites), which have differing pharmacological activities (Eap et al., 1996).
e. Zuclopenthixol.
The metabolic profile of zuclopenthixol is unclear, although CYP2D6 is involved (Dahl et al., 1991; Jerling et al., 1996; Jaanson et al., 2002). After depot administration, median plasma concentrations were 1.6- and 1.4-fold higher in PMs and heterozygous EMs, respectively, than homozygous EMs (Jaanson et al., 2002). No increase in tardive dyskinesia was seen in this study (n = 52). Clearance was 2.2- and 1.5-fold higher in homozygous and heterozygous EMs, respectively, than in PMs at steady-state (Jerling et al., 1996), whereas a 1.9-fold higher AUC was seen in PMs after a single-dose (Dahl et al., 1991). Overall, the data suggests a gene-concentration effect but nothing convincing for clinical effects.
f. Atypical antipsychotics.
Of this class, risperidone is the most well studied with respect to CYP2D6 which, together with other P450s, e.g., CYP3A (Odou et al., 2000; Yasui-Furukori et al., 2001), produces a metabolite with comparable activity, 9-hydroxyrisperidone (Mannens et al., 1993; van Beijsterveldt et al., 1994). 9-Hydroxyrisperidone is further metabolized by N-dealkylation, possibly by CYP3A (Spina et al., 2000). The ratio of risperidone to 9-hydroxyrisperidone concentrations is <1 in EMs, and >1 in PMs, but the sum of active moieties is similar (Mannens et al., 1993; Nyberg et al., 1995a; Olesen et al., 1998; Scordo et al., 1999; Roh et al., 2001b; Bondolfi et al., 2002). UMs have very low ratios of risperidone to 9-hydroxyrisperidone (Guzey et al., 2000). Limited data associate PM status with increased risperidone adverse effects. In particular, a large (n = 500) cross-sectional study reported a 3-fold increased risk of moderate-to-severe adverse effects in PMs. However, PMs comprised only a small proportion (16%) of all individuals with adverse effects and only 9% of those who stopped risperidone because of toxicity were PMs. Thus, genotyping is only likely to be helpful in identifying individuals who might be at elevated risk of side effects and could benefit from closer monitoring (Rau et al., 2004). Overall, studies strongly support a gene-concentration effect, but similar activity between the parent and primary active metabolite may negate the effect of the altered ratio.
None of the more established atypical antipsychotics (clozapine, olanzapine, or quetiapine) are extensively metabolized by CYP2D6, with other enzymes such as CYP1A2 and CYP3A playing more important roles (Ring et al., 1996; Olesen and Linnet, 2001; Li et al., 2005). For example, the CYP2D6 phenotype did not correlate with the olanzapine AUC after a single dose (Hagg et al., 2001) or plasma concentrations at steady state (Carillo et al., 2003). CYP2D6 polymorphism is unlikely to be important for these compounds.
g. Antipsychotics (in general) and clinical outcomes.
Results of the studies investigating a relationship between CYP2D6 and parkinsonism or tardive dyskinesia with traditional antipsychotics have been conflicting (Andreassen et al., 1997; Armstrong et al., 1997; Kapitany et al., 1998; Ohmori et al., 1998; Hamelin et al., 1999; Vandel et al., 1999; Schillevoort et al., 2001; Mihara et al., 2002). This may be due to methodological issues such as small sample size, inclusion of antipsychotics with variable CYP2D6 metabolism, and phenocopying due to the antipsychotic or concurrent drug therapy. A recent meta-analysis showed a small, but significant, 1.4-fold (95% CI 1.06, 1.93) increased risk of tardive dyskinesia in PMs (Patsopoulos et al., 2005). This is perhaps the most significant and problematic side effect of this class, although the small increased risk in PMs does not seem to support routine prospective genotyping. A pilot study of 100 psychiatric inpatients showed a trend for increasing adverse reactions with CYP2D6 drugs (haloperidol, perphenazine, risperidone, and TCAs) from the UM to PM status and a higher cost of treating these two groups (Chou et al., 2000).
Evidence for a relationship between CYP2D6 metabolizer status and efficacy is virtually nonexistent (Pollock et al., 1995; Lane et al., 1997). For example, a retrospective study showed that only 0.9% of patients with schizophrenia or schizoaffective disorders refractory to treatment with traditional antipsychotics had CYP2D6 multiplication, compared with 4.1% of patients who responded to treatment. This suggests that UM status is not an important cause of treatment failure (Aitchison et al., 1999).
6. Antiarrhythmics.
This is a diverse group of drugs in both structure and function, with low therapeutic indices and a checkered history in terms of safety. Most antiarrhythmics are metabolized rather than eliminated renally unchanged, and mostly this is via CYP3A (amiodarone, lignocaine, and quinidine) or CYP2D6 (propafenone, flecainide, and mexiletine).
a. Propafenone.
This lipophilic, high-clearance drug is subject to variable first-pass metabolism and nonlinear pharmacokinetics (Siddoway et al., 1987; Boriani et al., 1990; Capucci et al., 1990). Its enantiomers have equal sodium channel blocking activity (the primary effect), but S-propafenone is 100-fold more potent as a β-blocker (Kroemer et al., 1989a). Propafenone is metabolized via CYP2D6 to 5-hydroxypropafenone, which has sodium channel blocking activity similar to that of the racemic parent drug but less β-blockade (Kroemer et al., 1989b), and also by CYP1A2 and 3A4 to N-desalkylpropafenone (some, but less, activity) (Botsch et al., 1993). Subsequent metabolism is via glucuronidation. Propafenone inhibits CYP2D6 strongly, with ∼70% phenocopying (Libersa et al., 1987; Siddoway et al., 1987), and R-propafenone inhibits the metabolism of the S-enantiomer (Mehvar et al., 2002). The propafenone/5-hydroxypropafenone ratio correlates with the debrisoquine metabolic ratio (Capucci et al., 1990). PMs have 3- to 7-fold higher propafenone AUCs at steady state than EMs and produce very low or negligible concentrations of 5-hydroxypropafenone (Siddoway et al., 1987; Kroemer et al., 1989a; Lee et al., 1990; Dilger et al., 1999; Labbe et al., 2000). CYP2D6 status is generally thought to matter little for antiarrhythmic effect (Siddoway et al., 1987; Labbe et al., 2000), although some studies have suggested greater efficacy in those with reduced CYP2D6 activity (Jazwinska-Tamawska et al., 2001; Cai et al., 2002). PMs may be predisposed to more central nervous system adverse effects (76 versus 14% in EMs) (Siddoway et al., 1987) and greater β-blockade (Lee et al., 1990; Morike and Roden, 1994), although the latter result has been contradicted (Labbe et al., 2000). There is a case report of toxicity (dizziness and bradycardia) in a PM (Morike et al., 1995). Overall, there is a convincing gene-concentration relationship but only sparse evidence indicating that this translates to and altered clinical effect. There are problems with active metabolites, enantiomers, variable first-pass metabolism, saturable kinetics, and phenocopying.
b. Flecainide.
Flecainide is inactivated by mechanisms that include metabolism by CYP2D6 (Mikus et al., 1989; Gross et al., 1991) and renal elimination that is pH-dependent (Funck-Brentano et al., 1994). PMs have 2-fold higher mean flecainide concentrations than EMs after single doses (Mikus et al., 1989; Gross et al., 1991), but a negligible difference at steady state (Funck-Brentano et al., 1994; Tenneze et al., 2002). Quinidine has only a slight effect on flecainide concentrations (Birgersdotter et al., 1992). CYP2D6 status does not seem to predict electrophysiological effects in volunteers (Funck-Brentano et al., 1994; Tenneze et al., 2002). Overall, the gene-concentration and gene-effect relationships between CYP2D6 and flecainide seem minor, at least in healthy subjects, and the other pathways of elimination would make significant effects unlikely.
c. Mexiletine.
Mexiletine is chiral, with the R-enantiomer having greater activity (Labbe and Turgeon, 1999). It is metabolized to various inactive metabolites, largely, but not exclusively, by CYP2D6 (urinary excretion of hydroxymethylmexiletine, m-hydroxymexiletine, and p-hydroxymexiletine in PMs was approximately one-third of that seen in EMs) (Broly et al., 1990, 1991; Turgeon et al., 1991; Labbe and Turgeon, 1999). The CYP2D6 elimination pathway does not seem to be stereoselective (Abolfathi et al., 1993), although other pathways probably are, as concentrations of S-mexiletine exceed those of the R-enantiomer during the elimination phase (Labbe and Turgeon, 1999). Renal elimination of unchanged drug is pH-dependent and may vary from 1% in alkaline urine to 60% in acid urine (Labbe and Turgeon, 1999). PMs have mean AUCs that are 1.6 to 2.3 times larger than those of EMs (Broly et al., 1991; Turgeon et al., 1991; Lledo et al., 1993; Labbe et al., 1999). A slight increase in nausea and lightheadedness has been observed in PMs, although the small sample size limits the conclusions that can be drawn (Lledo et al., 1993). Overall a minor gene-concentration effect seems to be present, but other pathways of elimination are significant.
7. β-Blockers.
In terms of pharmacokinetics, this is a diverse group of drugs. Some (e.g., atenolol) are eliminated unchanged by glomerular filtration; others have P-glycoprotein-mediated active secretion (e.g., celiprolol); others are metabolized, some with high clearance (e.g., carvedilol, metoprolol, and propranolol) and others with low clearance through mixed pathways (e.g., timolol). Those metabolized to a significant extent by CYP2D6 (and/or CYP2C19), and therefore potentially susceptible to genetic polymorphism include metoprolol, carvedilol, propranolol, and timolol.
a. Carvedilol.
Carvedilol is given as a racemic mixture of R(+)- and S(-)-enantiomers which are equipotent at blocking α1-receptors, whereas β1,2-blockade resides largely in the S-enantiomer (van Zwieten, 1993). Concentrations of R-carvedilol exceed those of S-carvedilol by 2- to 3-fold (Morgan, 1994; Tenero et al., 2000). Each enantiomer is metabolized by P450 pathways to a number of metabolites, some of which are active, and subsequently to conjugates (mainly glucuronides and sulfates). Carvedilol also undergoes direct glucuronidation. If both AUC and potency are taken into account, only one metabolite is likely to have relevance in terms of effect, namely 4-hydroxyphenylcarvedilol (M4). This metabolite usually has an AUC of only 5 to 10% of the parent drug at steady state, but it is 13 times more potent as a β-blocker (Gehr et al., 1999; Tenero et al., 2000). It seems to have little vasodilation (α) effect (Coreg prescribing information; http://www.fda.gov/cder/foi/label/2005/020297s013lbl.pdf).
The conversion of carvedilol to 4-hydroxyphenylcarvedilol is mediated mainly by CYP2D6 (Oldham and Clarke, 1997), with the average AUC of R-carvedilol being 2.5-fold higher in PMs (Zhou and Wood, 1995; Giessmann et al., 2004). In the first of these studies (single dose), a nonsignificant 1.4-fold higher AUC of S-carvedilol was seen in PMs (Zhou and Wood, 1995), whereas in the other study (steady state), a significant 2.0-fold higher AUC was observed (Giessmann et al., 2004). The reduced activity allele, CYP2D6*10, also seems to influence the disposition of both enantiomers (Honda et al., 2005). Fluoxetine, which inhibits CYP2D6 (among other P450s), was associated with 1.8-fold (significant) and 1.4-fold (nonsignificant) increases in AUC of R- and S-carvedilol at steady state (Graff et al., 2001). It has been speculated that PMs would have more hypotension early in treatment because of elevated concentrations of the R-enantiomer which produces α- but not β-blockade. One study has reported significantly lower systolic blood pressure in healthy PMs treated for 1 week (Giessmann et al., 2004). More studies in patients are needed to see whether this effect has clinical significance. Overall, this process is very complex, and it is possible that increased α-blockade might occur in PMs. No significant overall effect of polymorphism would be likely on β-blockade-mediated effects.
b. Metoprolol.
This β1-selective blocker is given as a racemate, with S-metoprolol thought to produce most of the β-blockade (Lennard et al., 1986). The main metabolite, O-desmethylmetoprolol (essentially inactive), accounts for approximately two-thirds of the metabolism, occurs via various pathways, including CYP2D6 (mainly R-metoprolol), and is itself rapidly oxidized. Another pathway, to α-hydroxymetoprolol, accounts for ∼10% of a dose in EMs and seems to be under CYP2D6 control as very little is produced in PMs (McGourty et al., 1985b). The AUCs of metoprolol are 4- to 6-fold higher in PMs than in EMs after one dose (Lennard et al., 1982a; Hamelin et al., 2000) and 3- to 4-fold higher after repeated dosing (Freestone et al., 1982; Lennard et al., 1982b). The strong CYP2D6 inhibitor, paroxetine, increased the mean AUCs of S- and R-metoprolol by 5- and 8-fold, respectively (Hemeryck et al., 2000). UMs achieve metoprolol concentrations that are half those observed in EMs (Kirchheiner et al., 2004a). Thus, overall there seems to be a strong gene-concentration relationship.
In terms of a gene-effect relationship, enhanced or prolonged β-blockade has been observed in both PMs (Lennard et al., 1982a; McGourty et al., 1985b; Hamelin et al., 2000) and EMs receiving CYP2D6 inhibitors (Hamelin et al., 2000; Hemeryck et al., 2000). As healthy subjects were used in these studies, it is important to investigate the gene-effect relationship in patients. A retrospective study demonstrated that the frequency of sparteine PMs did not differ between 37 hypertensive patients who stopped metoprolol because of adverse effects and 37 age- and gender-matched control subjects who tolerated metoprolol (Clark et al., 1984). In contrast, another retrospective study reported a higher frequency of genotypic PMs (38%) in patients with metoprolol side effects compared with historical control subjects (∼7%) (Wuttke et al., 2002). The disparate findings may relate to methodological issues. For example, the duration of metoprolol treatment in nontolerators was considerably longer in the first (mean of 2 years) versus the second study (mean of 3 days) (Clark et al., 1984; Wuttke et al., 2002) perhaps suggesting that early cessations due to toxicity were missed in the first study. Irrespective of this result, three recent prospective studies have been published that fail to show a relationship between CYP2D6 and adverse effects with metoprolol (Zineh et al., 2004; Fux et al., 2005; Terra et al., 2005). In the first study, metoprolol was started in hypertensive patients, and the dose was titrated until one of three endpoints was achieved (target blood pressure, intolerable side effects, or 400 mg/day). Neither adverse effects nor changes in blood pressure correlated significantly with CYP2D6 activity or metoprolol concentrations (Zineh et al., 2004). In the second study, metoprolol was initiated in patients with heart failure, and the dose was titrated up to 200 mg/day if tolerated. Substantial differences in S-metoprolol concentrations were observed with genotype, but no relationship with the rate of decompensation was seen (Terra et al., 2005). In the third study, a gene-concentration (dose-normalized) effect was seen in patients given metoprolol mainly for hypertension. A number of side effects (e.g., dizziness and fatigue) were studied, with a trend for more cases of cold extremities in PMs/IMs (16 versus 4% in EMs/UMs, p = 0.056) whereas sexual dysfunction occurred less often in the PM/IM group (5 versus 32%, p < 0.05). No explanation was offered for the latter finding, which is the opposite to what might be expected intuitively (Fux et al., 2005).
Overall, metoprolol seems to have both consistent gene-concentration and gene-effect relationships in healthy volunteers, suggesting that dose reduction to ∼25% should occur in PMs or those phenocopied by other drugs. However, although the gene-concentration effect is maintained in patients, there does not seem to be an important gene-effect (or concentration-effect) relationship. Consequently, normal dose titration to the desired effect or excessive bradycardia is likely to suffice in patients with hypertension or heart failure.
c. Propranolol.
Propranolol is chiral with the S-enantiomer being ∼100-fold more active than R-propranolol. Production of 4-hydroxypropranolol (active) is mediated in part by CYP2D6, with concentrations of this metabolite reduced but not absent in PMs (Lennard et al., 1984; Raghuram et al., 1984). This pathway constitutes a minor proportion of S-propranolol elimination (∼15% in EMs) (Sowinski and Burlew, 1997) so it is not surprising that most studies do not show a significant difference in AUC of S-propranolol (or racemic propranolol) or in β-blockade between EMs and PMs (Lennard et al., 1984; Raghuram et al., 1984; Ward et al., 1989; Sowinski and Burlew, 1997). In contrast, two studies found an ∼2.5-fold higher average AUC of racemic propranolol in PMs [debrisoquine PMs in Caucasians (Shaheen et al., 1989) or the CYP2D6*10/*10 genotype in Chinese (Lai et al., 1995). Furthermore, a 2-fold increase in racemic and S-propranolol AUC has been observed with the strong CYP2D6 inhibitor, quinidine (Zhou et al., 1990). Closer examination of the studies that did not identify a significant difference indicated a trend for slightly higher (∼1.3- to 1.6-fold) average AUCs in PMs (Raghuram et al., 1984; Ward et al., 1989), with considerable interpatient variation and sample size, perhaps preventing a significant relationship. Irrespective of these discrepancies, any difference in propranolol concentrations with CYP2D6 status is minor relative to the substantial interpatient variation in plasma concentrations. Consequently, there is little reason to determine the CYP2D6 genotype for clinical purposes in relation to propranolol.
d. Timolol.
Timolol is a nonselective β-blocker that is metabolized largely by CYP2D6. PMs have a 2- to 4-fold higher mean AUC and increased and prolonged β-blockade after oral administration (Lewis et al., 1985; McGourty et al., 1985a). β-Blockade can occur with very low plasma concentrations of timolol (Kaila et al., 1991), and ocular administration has been associated with systemic side effects (van der Zanden et al., 2001). One study reported that variable systemic exposure (e.g., with “spillover”) after administration of timolol eye drops exceeded interphenotype differences (Huupponen et al., 1991). However, a more recent study documented a 2.5-fold higher plasma AUC in PMs than in EMs after application of timolol 0.5% eye drops. The PMs also had a tendency for greater β-blockade, as judged by change in heart rate with exercise. Another formulation (timolol 0.1% hydrogel) was also investigated in this study. However, although PMs were observed to have 2.5-fold higher plasma AUC than EMs, this value did not reach statistical significance. There was also a tendency for greater β-blockade in PMs, but this effect was less pronounced compared with that for the eye drops (Nieminen et al., 2005). Consistent with these findings, application of timolol eye drops intranasally resulted in higher plasma concentrations and greater β-blockade in PMs than in EMs, consistent with a systemic gene-dose effect (Edeki et al., 1995). Thus, a similar case for genotyping exists as for metoprolol, although the extent of the gene-concentration/effect relationship may be less, and the evidence base is inferior
8. Opioid Analgesics.
a. Codeine.
In most individuals only a small fraction (∼10%) of codeine is metabolized to morphine via CYP2D6 (Caraco et al., 1996), with most being glucuronidated to codeine-6-glucuronide and the remainder being metabolized by CYP3A4 to norcodeine (Yue and Sawe, 1997). The AUC of codeine is similar in PMs and in EMs (Yue et al., 1991; Mikus et al., 1997; Eckhardt et al., 1998), whereas morphine is virtually undetectable in PMs (Yue et al., 1991; Caraco et al., 1996; Poulsen et al., 1996b; Eckhardt et al., 1998), as well as in EMs taking quinidine (phenocopying) (Desmeules et al., 1991; Sindrup et al., 1992a; Caraco et al., 1996). Clinical studies in volunteers generally support the lack of analgesia in PMs, which is consistent with the belief that morphine is the key metabolite responsible for the antinociceptive effects of codeine (Desmeules et al., 1991; Sindrup et al., 1991; Poulsen et al., 1996b; Eckhardt et al., 1998). There is some evidence to suggest that other metabolites (e.g., codeine-6-glucuronide) may also contribute to the opioid effects (Lotsch et al., 2006). This contribution may explain the disparate findings of studies investigating the relationship between CYP2D6 and other opioid effects [e.g., slowed gastrointestinal (GI) transit time]. Some studies suggest no major difference between EMs and PMs (Sindrup et al., 1992a; Hasselstrom et al., 1997; Eckhardt et al., 1998), whereas others suggest diminished opioid effects in PMs (Caraco et al., 1996; Poulsen et al., 1996b; Mikus et al., 1997). Theoretically, UMs may convert codeine to morphine more rapidly, thus resulting in increased opioid effects for a given dose. Evidence for this theory is suggestive but is limited to isolated case reports (Dalen et al., 1997; Gasche et al., 2004).
Overall there is a strong argument for a gene-concentration effect for failure of prodrug conversion to morphine in PMs and in phenocopied EMs. As far as the gene-effect relationship is concerned, there seems to be a predictable failure of analgesia in healthy volunteers but a less clear relationship with adverse effects. However, it seems unlikely that testing will occur routinely in practice, at least in the immediate future, because of the familiarity of physicians with codeine and its relatively high therapeutic index. Thus, a “trial and error” approach may be perceived as being acceptable for codeine, for which the main issue is lack of effect, but may not be considered reasonable for a drug such as azathioprine for which deficient metabolism may have disastrous consequences.
b. Dihydrocodeine.
Analogous to codeine, dihydrocodeine is converted by CYP2D6 to dihydromorphine, which has activity comparable to that of morphine (Kirkwood et al., 1995, 1997). EMs have 7-fold higher dihydromorphine concentrations (Fromm et al., 1995), with quinidine producing a 3- to 4-fold decrease in dihydromorphine concentrations (Wilder-Smith et al., 1998). Contrary to what might be expected, dihydrocodeine 60 mg seems to produce similar analgesic effects in EM and PM volunteers (Wilder-Smith et al., 1998; Schmidt et al., 2003). However, in one of the studies, no analgesic effect of dihydrocodeine was seen in the pain threshold model in either EMs or PMs, whereas pupillary diameter was reduced comparably in both groups (Schmidt et al., 2003). Further study is needed.
c. Tramadol.
Tramadol has two chiral centers and is marketed as a (±) racemate of the trans-isomer. (+)-Tramadol is metabolized to its O-desmethyl metabolite by CYP2D6, as is (-)-tramadol but to a lesser extent. (+)-O-Desmethyltramadol predominantly mediates the opioid effects, whereas (+)-tramadol is more potent against serotonin reuptake inhibition and (-)-tramadol against noradrenaline reuptake inhibition (Grond and Sablotzki, 2004). The ratio of tramadol to O-desmethyltramadol seems to be slightly higher in PMs than in EMs, but with substantial overlap (Poulsen et al., 1996a). Analgesia is present in both EMs and PMs, but perhaps is less in PMs through less of the opioid component. Side effects may be greater in EMs, through greater opioid effects (Poulsen et al., 1996a; Enggaard et al., 2006). Overall, there may be a slight gene-concentration effect relationship, but these results are far from convincing, and the evidence base is small.
d. Other opioids.
Production of the active metabolites of hydrocodone (hydromorphone) and oxycodone (oxymorphone) is reduced in CYP2D6 PMs (Otton et al., 1993; Heiskanen et al., 1998). However, there is little evidence of a difference in effect between EMs and PMs in human studies (Otton et al., 1993; Kaplan et al., 1997; Heiskanen et al., 1998) or in animal models (Tomkins et al., 1997; Lelas et al., 1999).
9. Antiemetics.
The major route of elimination of the 5-hydroxytryptamine 3 antagonist, tropisetron, in EMs is via metabolism to 6-hydroxyatomoxetine and 5-hydroxytropisetron and their conjugates (∼50-60% of the dose excreted) whereas PMs excrete only trace amounts (Fischer et al., 1994; Firkusny et al., 1995; Sanwald et al., 1996). Early work demonstrated 5- to 7-fold higher AUCs in PMs (de Bruijn, 1992). A Korean study (n = 13) reported a 6.8-fold higher mean AUC with the CYP2D6*10/*10 and *5/*10 genotypes compared with the wild-type and a 1.9-fold higher AUC with the CYP2D6*1/*10 genotype. No difference in adverse effects was seen, consistent with the high therapeutic index of this class (Kim et al., 2003). Data from a small number of UMs suggests they have similar or slightly reduced concentrations compared with EMs (Kaiser et al., 2002; Kim et al., 2003), with a decreased antiemetic effect shown in one study (Kaiser et al., 2002). However, it was estimated that 50 patients would need to be genotyped to prevent one case of severe vomiting. The relationship between genotype and outcomes with tropisetron may have been underestimated as the prediction was derived from patients treated with either tropisetron or ondansetron, with the latter drug being less reliant on CYP2D6 for metabolism (see below) (Kaiser et al., 2002).
In vitro studies demonstrate the involvement of CYP2D6 in the metabolism of at least three other antiemetics, ondansetron (Fischer et al., 1994; Dixon et al., 1995; Sanwald et al., 1996), dolasetron (Sanwald et al., 1996), and metoclopramide (Desta et al., 2002a). The pharmacokinetic implications have only been studied for ondansetron, with no difference in AUCs observed between EMs and PMs of debrisoquine (Ashforth et al., 1994). This is not surprising as ondansetron is metabolized by a number of P450 enzymes, with none appearing dominant (Fischer et al., 1994; Dixon et al., 1995; Sanwald et al., 1996). There is some evidence that UMs may have reduced response to ondansetron and dolasetron (Candiotti et al., 2005; Janicki et al., 2006). For example, postoperative vomiting with ondansetron was significantly higher in UMs (46%) than in EMs (15%), IMs (17%), or PMs (8%). Although it could be speculated that UMs clear more ondansetron via CYP2D6 than other genotype groups, the pharmacokinetics were not assessed in this study. Overall, a strong gene-concentration relationship exists for tropisetron. In addition, preliminary data suggest reduced efficacy of tropisetron and ondansetron in UMs.
10. Antihistamines.
CYP2D6 is involved in the in vitro metabolism of a number of antihistamines, including promethazine (Nakamura et al., 1996) and azelastine (Nakajima et al., 1999). Chlorpheniramine has been shown to be subject to CYP2D6 polymorphism in vivo, with concentrations of the 100-fold more potent S-enantiomer (Tan Tran et al., 1978) ∼3.2-fold higher in PMs. The AUC of the R-enantiomer is 2.4-fold higher in PMs, and quinidine increases both enantiomers ∼2-fold in EMs (Yasuda et al., 2002). The clinical implications of these findings are not clear as there is some confusion as to whether H1 receptor occupancy is different in PMs or EMs, and the possibility of an active metabolite has been suggested (Yasuda et al., 1995b, 2002). Currently, there seems to be no role for CYP2D6 genotyping in relation to this class.
11. Other Drugs.
a. Atomoxetine.
This noradrenergic reuptake inhibitor is metabolized to 4-hydroxyatomoxetine mainly by CYP2D6 (>90% in EMs), whereas multiple low-affinity enzymes are involved in PMs. 4-Hydroxyatomoxetine has activity comparable to that of the parent. The AUC of atomoxetine is 6- to 8-fold higher in PMs and in those taking paroxetine (Belle et al., 2002; Ring et al., 2002; Sauer et al., 2003). Concentrations of 4-hydroxyatomoxetine are much lower than those of the parent drug (∼1% in EMs and 0.1% in PMs), presumably due to rapid glucuronidation. Product information for atomoxetine indicates that side effects such as decreased appetite and tremor are more common (either “twice as frequent” or “statistically significantly more frequent”) in PMs than in EMs (Strattera prescribing information, http://pi.lilly.com/us/strattera-pi.pdf). Despite this difference, the discontinuation rate due to side effects in pediatric patients receiving at least 1.2 mg/kg/day was similar (∼3%) in EMs (n = 1290) and PMs (n = 67). However, PMs were more likely to incur a slight weight loss (-1.2 versus +0.8 kg) and to have a greater increase in pulse rate (10.6 versus 6.9 bpm) (Allen et al., 2001; Wernicke and Kratochvil, 2002). Similarly, healthy adult EMs receiving paroxetine had greater increases in heart rate than those receiving atomoxetine alone (Belle et al., 2002). Thus, a strong gene-concentration relationship exists for atomoxetine, and there may be a geneside effect relationship.
b. Perhexiline.
Perhexiline is an antianginal drug that is almost entirely metabolized by CYP2D6 to hydroxyperhexiline (inactive) (Cooper et al., 1984, 1987; Sorenson et al., 2003). PMs have trough concentrations up to 6-fold higher than EMs after a single dose (Cooper et al., 1984, 1987), with evidence of saturable metabolism (Horowitz et al., 1981). Perhexiline lost favor during the 1970s because of significant, sometimes irreversible, hepatotoxicity, and peripheral neuropathy that is generally reversible (Shah et al., 1982; Lorentz and Shortall, 1983; Morgan et al., 1984). A resurgence of usage particularly in Australasia (Gardiner and Begg, 2005) has occurred after recognition of the concentration-dependent nature of these adverse effects. Both hepatotoxicity (Morgan et al., 1984) and peripheral neuropathy (Shah et al., 1982) occur more in PMs. Therapeutic drug monitoring has assisted dosing, with a suggested range of 0.15 to 0.6 mg/l, supported by both concentration-dependent efficacy and toxicity (Horowitz et al., 1986; Cole et al., 1990; Stewart et al., 1996). In addition, the ratio of perhexiline to cis-hydroxyperhexiline concentrations determined early in treatment may facilitate appropriate dose adjustment, and the daily perhexiline dose may range from 10 to 25 mg in PMs to 100 to 250 mg in EMs and 300 to 500 mg in UMs (Sallustio et al., 2002). Overall, there is a reasonably strong case for prospective genotyping, with follow-up of phenotype (parent to metabolite ratio) via therapeutic drug monitoring.
c. Phenformin.
This biguanide antihyperglycemic drug is excreted largely unchanged renally (∼50-86%), with some metabolism mediated by CYP2D6 that is absent in PMs (Shah et al., 1980; Idle et al., 1981). Phenformin has largely been abandoned therapeutically because of lactic acidosis, which is fatal in ∼50% of cases (Marchetti and Navalesi, 1989). Risk factors for lactic acidosis include renal, liver or cardiac disease, alcoholism, and CYP2D6 poor metabolism (Marchetti and Navalesi, 1989; Krentz et al., 1994). Increased phenformin concentrations have been reported in patients with lactic acidosis (Marchetti and Navalesi, 1989), and the AUC of phenformin is ∼1.4-fold higher and lactate concentrations greater in PMs after a single dose (Oates et al., 1983). However, evidence directly implicating CYP2D6 status as a cause seems weak (Oates et al., 1981; Wiholm et al., 1981). Overall, the risk of lactic acidosis is probably related more to other factors than to PM status per se. This drug has little current therapeutic relevance and has been replaced in the clinic by metformin.
d. Tolterodine.
This anticholinergic drug is mainly oxidized to the active 5-hydroxymethyltolterodine by CYP2D6 and dealkylated by CYP3A4 (Nilvebrant et al., 1997; Postlind et al., 1998; Brynne et al., 1999b). 5-Hydroxymethyltolterodine is the major metabolite in EMs but is unquantifiable in the plasma of PMs (Brynne et al., 1998, 1999a,c; Olsson and Szamosi, 2001a). Although tolterodine concentrations are elevated 5- to 10-fold in PMs, the summed active moieties (unbound concentrations) do not vary between EMs and PMs (Brynne et al., 1999a,c; Olsson and Szamosi, 2001a,b). This suggests that clinical effects will not differ significantly between the two groups, and there is no convincing evidence of an important gene-effect relationship (Brynne et al., 1998). This is a good example of how measurement of the parent drug alone would give grossly erroneous predictions.
12. Summary of CYP2D6.
There is little to support a mandatory case for prospective genotyping/phenotyping for any CYP2D6 substrate, although such tests may be useful for a few drugs. The strongest case can be made for perhexiline, which scored within the “probable” range in our algorithm (Table 2). Prospective genotyping could help with initial doses and may save on the frequency of subsequent phenotype testing (therapeutic drug monitoring). Monitoring perhexiline concentrations would remain necessary to preempt hepatotoxicity and peripheral neuropathy, which are serious toxicities.
A strong case can be made for occasional testing for CYP2D6 in relation to codeine. There are convincing gene-concentration and gene-effect relationships, and codeine scored at the high end of “possible” in the algorithm (Table 2). However, studies to date have been in volunteers and not in the target population. Furthermore, although nonresponse to codeine may be explained by PM status, many nonresponders may be the result of other factors, including phenocopying by a CYP2D6 inhibitor such as paroxetine. As the effects of not knowing CYP2D6 status are not life-threatening, awareness of all these associations may be all that is required in practice.
A strong case for genotyping for metoprolol (assessed usefulness score of 7, i.e., “possible”, using the algorithm in Table 2) based on a gene-concentration relationship for racemic drug is weakened by the likelihood that the active S-enantiomer is affected less than the R-enantiomer. In addition, the high therapeutic index of the drug and the fact that the effects of excessive β-blockade usually are easy to detect clinically (e.g., bradycardia) lessen the need for genotype testing. The long history of metoprolol use without genotyping or phenotyping suggests that these tests are unlikely to happen in practice. Timolol is similar to metoprolol in some ways, although the case is less convincing and the evidence basis is inferior. For the reasons pertaining to metoprolol, it is difficult to mount a strong case for genotype/phenotype testing.
For the TCAs, some authors have advocated quite strongly for dosing based on genotype. We are less convinced. Although some strong gene-concentration effects are evident, especially for the secondary TCAs when measured alone, evidence of clinical effects is sparse. Overall, the data are most supportive for nortriptyline, which when subjected to the association algorithm scored 8 (Table 2). This puts it at the upper end of the “possible” category in terms of usefulness of prospective genotyping. Points in favor of prospective genotyping for nortriptyline are the strong gene-concentration relationship for the parent drug and the well-known concentration-effect relationship that is the basis of therapeutic drug monitoring. The case is weakened by the fact that CYP2D6 produces an active metabolite that is rarely considered in the studies. Clearly, more studies are needed, particularly relating genotype to effect. Occasional genotype testing could explain an aberrant response, perhaps especially for UMs.
The case for genotyping in relation to the SSRIs is even less strong than for the TCAs not only because concentration-effect relationships have never been clearly evident for this group but also because autophenocopying to PM status occurs with chronic dosing of fluoxetine and paroxetine. Of all the SSRIs, the case for paroxetine is the strongest, because the parent drug is the sole active moiety. However, there is little support for a clear gene-effect relationship, and paroxetine was judged to be at the lower end of “possible” (Table 2). The clinical importance of CYP2D6 status for fluoxetine is minimal because of reciprocal changes in the disposition of the active metabolite, differential enantiomer effects, some phenocopying, the lack of a clear concentration-effect relationship, and the relatively high therapeutic index. Usefulness of genotyping for fluoxetine was judged to be “unlikely” using the algorithm (Table 2).
The nontricyclic antidepressants (e.g., mianserin) have complex pharmacology with some similarities to the tertiary TCAs, including the presence of active metabolites. These features, along with minimal evidence to suggest any convincing genotype-effect relationship, offer little basis for consideration of genotyping in the clinic. The complexity of venlafaxine pharmacology (enantiomers, active metabolites, etc.) means any relationship with CYP2D6 is unlikely to be meaningful in the clinic.
The antipsychotic drugs have the same problems as the TCAs, although concentration-effect relationships are less established. Although some gene-concentration effects have been demonstrated, evidence relating to clinical effects has often been contradictory and unconvincing. This lack of evidence may be explained by active metabolites (especially after CYP2D6 conversion, thereby allowing little change in overall active concentrations), multiple metabolites by multiple pathways, some phenocopying, and all in the setting of a moderate to high therapeutic index. The best performing drug according to the algorithm (Table 2) was perphenazine, and this score did not even reach “possible”.
Propafenone has a strong gene-concentration effect, but the presence of active metabolites, enantiomers, complex pharmacokinetics, and only minor support for a gene-effect relationship suggest that the case for testing is weak at present. It scored a “possible” in the algorithm (Table 2). The case for testing for flecainide or mexiletine is even weaker. Atomoxetine and tropisetron both score at the low end of “possible” usefulness, suggesting that more work needs to be done on these drugs.
B. CYP2C9
The CYP2C subfamily has four known human members, CYP2C8, 2C9, 2C18, and 2C19, which are located mainly in the liver (Lapple et al., 2003). CYP2C9 and CYP2C19 have been studied relatively intensively and have some important consequences for therapeutics. CYP2C18 can be disregarded for this review, as there is currently no evidence that it has an important impact on drug metabolism in humans. The recent upsurge of interest in CYP2C8 is discussed in section II.D.
CYP2C9 is the most abundant of the CYP2C enzymes (Lapple et al., 2003) and comprises approximately one-third of the total hepatic P450 content (Lasker et al., 1998). It is involved in the metabolism of more than 100 drugs (Kirchheiner and Brockmoller, 2005), including coumarin anticoagulants, sulfonylureas, and some nonsteroidal anti-inflammatory drugs (Table 4). Many variants have been associated with reduced enzyme activity (http://www.cypalleles.ki.se), with CYP2C9*3, and to a lesser extent *2, having the most clinical relevance. The CYP2C9*2 and *3 alleles have single base substitutions resulting in amino acid changes at residue 144 (Arg to Cys) and 359 (Ile to Leu), respectively (Ingelman-Sundberg et al., 2005). In vitro studies show that *3 is associated with a lower intrinsic clearance of substrate drugs than *2 (Yamazaki et al., 1998a; Rettie et al., 1999; Yasar et al., 2001b), and this has also been demonstrated in vivo. The role of the *2 allele is less clear with only some CYP2C9 substrates (e.g., warfarin and phenytoin) being affected in vivo.
Difference in drug concentrations with CYP2C9 metabolizer status and evidence for and against genotyping Only studies involving oral drug administration and adult subjects were included. Case reports were excluded. AUC differences were significant unless otherwise specified.
At least one CYP2C9*2 or *3 allele is carried by ∼20 and 12% of Caucasians, respectively, with ∼2.5% being homozygotes for *2 or *3 or compound heterozygotes for both alleles. The remaining two thirds of the Caucasian population are wild-type and have normal enzyme activity (although as usual overlap exists between genotype groups) (Lee et al., 2002a). The small proportion of individuals (∼0.4% of Caucasians) homozygous for CYP2C9*3 have the lowest ability to metabolize substrate drugs. The CYP2C9*2/*2 and *2/*3 genotypes may also cause important reductions in the metabolism of some drugs (e.g., phenytoin). CYP2C9*2 and *3 are rare in African-American and Asian populations with the wild-type comprising more than 95% of these populations (Lee et al., 2002a).
1. Coumarin Anticoagulants.
The three oral coumarin anticoagulants—warfarin, acenocoumarol, and phenprocoumon— exist as S- and R-enantiomers. The S-enantiomers are CYP2C9 substrates and are responsible for most of the effects of warfarin and phenoprocoumon. In contrast, S- and R-acenocoumarol have comparable activities, but rapid elimination of the S-enantiomer means that R-acenocoumarol produces most of the anticoagulant effect. All three oral anticoagulants have low therapeutic indices, and the dose required to produce a target prothrombin time is largely unpredictable. The consequences of under- or over treating can be dire (thromboembolism or hemorrhage).
a. Warfarin.
S-Warfarin is 3- to 5-fold more potent than R-warfarin and is suggested to produce 60 to 70% of the overall anticoagulant effect (Takahashi and Echizen, 2001). S-Warfarin is largely (∼80%) metabolized by CYP2C9, whereas R-warfarin is metabolized mainly by CYP3A4 and 1A2 (Kaminsky and Zhang, 1997). Plasma concentrations of R-warfarin in EMs are usually ∼2-fold higher than those for the S-enantiomer (Takahashi and Echizen, 2001). Both CYP2C9*2 and *3 cause a reduction in S-warfarin clearance (Takahashi et al., 1998; Scordo et al., 2002; Kamali et al., 2004), with 10-fold variation seen from the genotype linked with the highest (CYP2C9*1/*1) to lowest (CYP2C9*3/*3) activity (*1/*1 > *1/*2 > *1/*3 > *2/*2 > *2/*3 > *3/*3) (Scordo et al., 2002). The effect of the CYP2C9*3/*3 genotype is the most dramatic, with S-warfarin clearance being only 10% of the wild type (Takahashi et al., 1998; Scordo et al., 2002).
Numerous studies show that CYP2C9*2 and *3 cause reduced warfarin dose requirements (Ogg et al., 1990; Furuya et al., 1995; Aithal et al., 1999; Freeman et al., 2000; Margaglione et al., 2000; Taube et al., 2000; Loebstein et al., 2001; Higashi et al., 2002; Scordo et al., 2002; Tabrizi et al., 2002; Wadelius et al., 2004). Patients with the CYP2C9*3/*3 genotype require a dose reduction of ∼90%, usually to <1 mg/day (Steward et al., 1997; Tabrizi et al., 2001; Gage et al., 2004; Hillman et al., 2004; Kamali et al., 2004). A recent meta-analysis (n = 2775) (Sanderson et al., 2005), and single studies (Ogg et al., 1990; Furuya et al., 1995; Margaglione et al., 2000; Taube et al., 2000; Loebstein et al., 2001; Higashi et al., 2002; Gage et al., 2004; Kamali et al., 2004; Peyvandi et al., 2004; Wadelius et al., 2004) suggested that individuals with the CYP2C9*1/*2 and *1/*3 genotypes require 10 to 20% and 20 to 50% lower average maintenance doses, respectively, than does the wild type. Furthermore, one study showed that 81% (29 of 36) of patients with low dose requirements (≤1.5 mg/day) had at least one CYP2C9*2 or *3 allele compared with 40% in a randomly selected group of warfarinized patients (Aithal et al., 1999). All of these data suggest a strong gene-effect relationship. In contrast, it has been suggested that CYP2C9 variants account for 10 to 20% of the total variation in warfarin dose (Gage et al., 2004; Hillman et al., 2004), whereas 26 to 39% of the variation can be explained by other factors (e.g., age and weight) in addition to CYP2C9 genotype (Tabrizi et al., 2002; Gage et al., 2004; Hillman et al., 2004; Wadelius et al., 2004). Indeed, one algorithm included parameters that could be known at the outset of warfarin therapy (age, body surface area, CYP2C9 status, concomitant drug therapy, race, and gender) (Gage et al., 2004), with a small prospective study (n = 48) demonstrating that it could predict 42% of the variation in dose (Voora et al., 2005). It is also increasingly recognized that a more important source of variation in response to warfarin is the VKORC1 gene that encodes the target enzyme, vitamin K epoxide reductase. Consideration of VKORC1 genotype together with CYP2C9 genotype and factors such as age and body size may account for 50 to 60% of the variability in warfarin dosing requirements (Rieder et al., 2005; Sconce et al., 2005; Aquilante et al., 2006; Takahashi et al., 2006).
Although the data associating the CYP2C9 genotype with warfarin maintenance dose are relatively consistent, the relationship with overanticoagulation and bleeding is less conclusive. A few studies suggest that major bleeding episodes are more frequent in those with CYP2C9 variants (Aithal et al., 1999; Margaglione et al., 2000; Higashi et al., 2002). In general, the data suggest that CYP2C9 variants increase the risk of supratherapeutic INRs (perhaps as much as 6-fold) (Aithal et al., 1999) during warfarin initiation with standard doses (Higashi et al., 2002; Peyvandi et al., 2004), although one study did not observe this with long-term treatment (Taube et al., 2000). It also seems that patients with CYP2C9 variants may take up to 3 months longer to achieve a stable regimen (Aithal et al., 1999; Higashi et al., 2002). A recent meta-analysis suggested that the presence of the *2 or *3 variant increased the risk of bleeding episodes by 2.3-fold (∼1.9-fold for the *2 variant and 1.8-fold for the *3 variant, respectively) (Sanderson et al., 2005).
Points in favor of CYP2C9 genotyping are a strong gene-dose relationship, strong dose-effect relationship and low therapeutic index. In addition, a pharmacoeconomic analysis suggests that use of CYP2C9 genotype, demographic, and clinical details in a pharmacogenetic model (described above) (Gage et al., 2004) to guide initial dose and frequency of INR assessment could reduce the occurrence of severe bleeding episodes at a relatively marginal cost (You et al., 2004). Points against genotyping include the minor contribution of CYP2C9 to the total variation in warfarin dose and the fact that prothrombin time monitoring will continue to be needed. Furthermore, there is considerable overlap in warfarin dose requirements and pharmacokinetics between CYP2C9 genotypes, particularly with the wild-type or heterozygous genotypes (Scordo et al., 2002). In addition, approximately one-third of individuals with low dose requirements (<25 mg/week) are wild-type (Scordo et al., 2002). Therefore, any attempt to use CYP2C9 genotyping as a routine clinical test needs to be accompanied by suitable education and guidelines to ensure appropriate use in conjunction with monitoring of prothrombin indices. Another factor to consider is that most of the studies performed to date have been retrospective and of cross-sectional design and consequently may have excluded individuals who stop warfarin early due to adverse effects or difficulty attaining the best dose. Furthermore, many studies had a small number of subjects and/or adverse events, did not formally investigate bleeding risk, and included variable patient populations and target INRs.
b. Acenocoumarol.
This drug is used in preference to warfarin in some countries, predominantly in Europe. R-Acenocoumarol is metabolized by several enzymes and produces most of the anticoagulant effect. S-Acenocoumarol is metabolized almost exclusively by CYP2C9 and although active, it contributes comparatively little because of rapid elimination (Thijssen et al., 2000a).
The presence of one CYP2C9*3 allele is associated with 20 to 30% lower acenocoumarol doses compared with the wild type (Tassies et al., 2002; Visser et al., 2004b), whereas two alleles lead to very low dose requirements (<1 mg/day compared with the “usual” dose of ∼2.5 mg/day) (Spreafico et al., 2002; Andre-Kerneis et al., 2003; Zarza et al., 2003). Several studies show a preponderance of CYP2C9*3 alleles in patients with very low dose requirements (≤1 mg/day) (Thijssen et al., 2000b; Hermida et al., 2002; Tassies et al., 2002). Available data on CYP2C9*2 are conflicting, with most (Spreafico et al., 2002; Tassies et al., 2002; Morin et al., 2004; Schalekamp et al., 2004b; Visser et al., 2004b) but not all studies (Mark et al., 2005) showing no difference in dose requirements compared with the wild type. Carriers of CYP2C9 variants (largely CYP2C9*3) are at increased risk of supratherapeutic INR values (Tassies et al., 2002; Schalekamp et al., 2004b; Visser et al., 2004b) and bleeding (Visser et al., 2004a). A recent study showed that polymorphisms in CYP2C9 (*3) and VKORC1 (1639G>A) explain up to 50% of the total variation in response to acenocoumarol after a single dose in volunteers (Bodin et al., 2005).
c. Phenprocoumon.
Phenprocoumon undergoes a large proportion of elimination via alternative pathways (e.g., renal and CYP3A4) (Toon et al., 1985; Ufer et al., 2004), so any relationship with the CYP2C9 genotype may be less important than for warfarin or acenocoumarol. After a single dose, a trend for decreased S-phenprocoumon clearance was seen with increasing number of CYP2C9 variant alleles in healthy subjects (Kirchheiner et al., 2004d). In two patient studies there was a 2- to 3-fold increased risk of bleeding or overanticoagulation (INR >6.0) in carriers of CYP2C9 variants (Hummers-Pradier et al., 2003; Schalekamp et al., 2004a). In one of these studies, a small decrease in dose requirements was observed in patients with CYP2C9 variants (e.g., 35% decrease with the CYP2C9*3/*3 genotype) (Schalekamp et al., 2004a). By contrast, another patient study did not show a relationship between CYP2C9 and dose requirements, excessive anticoagulation (Visser et al., 2004b), or bleeding (Visser et al., 2004a). These discrepancies could relate to variable study design. For example, the minor effect seen in the single-dose study could partly relate to an inadequate sampling period (144 h), which was comparable with the estimated half-lives of S- and R-phenprocoumon (Kirchheiner et al., 2004d).
2. Sulfonylurea Drugs.
CYP2C9 is important for the metabolism of this class, with CYP2C9*3 (but not CYP2C9*2) being clearly implicated in impaired clearance of tolbutamide, glyburide, and glimepiride (Kirchheiner et al., 2002a,b; Lee et al., 2002b; Niemi et al., 2002; Shon et al., 2002; Wang et al., 2005).
a. Tolbutamide.
In the late 1970s, tolbutamide metabolic inactivation was suggested to be polymorphic and inherited, with a wide variation in half-life (3-25 h) and an elimination rate constant that seemed to be trimodally distributed (Scott and Poffenbarger, 1979; Scott et al., 1979). One individual with the CYP2C9*3/*3 genotype had tolbutamide clearance that was only 20% of the mean expected in healthy subjects (Miners et al., 1985; Sullivan-Klose et al., 1996). More recently, four single-dose volunteer studies reported ∼2- and 6-fold higher AUCs in those heterozygous and homozygous for CYP2C9*3, respectively (Kirchheiner et al., 2002a; Lee et al., 2002b; Shon et al., 2002; Chen et al., 2005). The pharmacodynamic implications of this finding are less clear, with only two of the four studies showing a difference in blood glucose concentrations between genotype groups. In the first of these studies, the estimated change in AUC of serum glucose was 2.7-fold higher with the CYP2C9*1/*1 versus *1/*3 genotype when an oral glucose load (100 g) was administered 1 h after the tolbutamide dose (Shon et al., 2002). In the second study, significantly lower mean serum glucose concentrations occurred at 9 and 12 h postdose with the CYP2C9*1/*3 genotype compared with the CYP2C9*1/*1 genotype. However, the difference in AUC was not significant (Chen et al., 2005).
b. Glyburide.
A 2.8-fold higher mean glyburide AUC was seen with the CYP2C9*1/*3 genotype than the wild-type in a healthy volunteer study (Niemi et al., 2002). Another study used population pharmacokinetic analysis and showed a 1.4- and 2.3-fold higher mean AUC in those with the CYP2C9*1/*3 and *3/*3 genotypes, respectively. Elevated insulin concentrations at 12 h postdose were also observed in CYP2C9*3 homozygotes, whereas glucose concentrations were not appreciably different (Kirchheiner et al., 2002b). Among Chinese healthy volunteers, those with the CYP2C9*1/*3 genotype had ∼2-fold higher glyburide concentrations than those with the CYP2C9*1/*1 genotype and were more likely to require oral glucose supplementation for low blood glucose concentrations (Yin et al., 2005).
c. Glimepiride.
The AUC of glimepiride was 2.7-fold higher with the CYP2C9*1/*3 genotype than with the wild type, without any difference in glucose concentrations (Niemi et al., 2002). The active hydroxymetabolite (M1) of glimepiride produced by CYP2C9 was not assayed, although the contribution of this metabolite to the overall effect of glimepiride is not clear (Amaryl prescribing information, http://products.sanofi-aventis.us/amaryl/amaryl.pdf) (Badian et al., 1996). A single-dose study of Chinese volunteers identified a 1.3- and 1.5-fold higher median AUC with the CYP2C9*1/*3 and *3/*3 genotypes, respectively. However, it is not clear how reliable the AUC estimate was as the subject with the CYP2C9*3/*3 genotype was reported to have a glimepiride half-life of 38 h, and blood was sampled for only 48 h postdose (Wang et al., 2005). In this study, the formation clearance of glimepiride to M1 (and subsequent inactive M2 metabolite) was significantly reduced in the CYP2C9*1/*3 genotype. If significantly active, this M1 metabolite could offset the pharmacodynamic effects of elevated glimepiride concentrations in those with the CYP2C9*3 variant. An overall predisposition to hypoglycemia with CYP2C9 variants is supported by a retrospective analysis that showed an excess of individuals with the CYP2C9*2/*3 and *3/*3 genotypes among 20 patients hospitalized with severe hypoglycemia due to glimepiride or glyburide (10 versus ∼2% in control subjects) (Holstein et al., 2005).
d. Glipizide and gliclazide.
There is less information on the relationship between CYP2C9 and glipizide or gliclazide. In a glipizide bioavailability study, one subject had severe hypoglycemia associated with an AUC that was 5.5-fold greater than the mean value for the remaining subjects. This volunteer was later found to have the CYP2C9*3/*3 genotype and to have reduced clearance of another CYP2C9 substrate, phenytoin (Kidd et al., 1999). Animal studies suggest that CYP2C9 helps inactivate gliclazide (Rieutord et al., 1995), and a predisposition to hypoglycemia has been reported during coadministration with a CYP2C9 inhibitor in humans (Abad et al., 2001). Therefore, the available data suggest that both glipizide and gliclazide will behave like the other sulfonylureas, although clinical studies should be undertaken to prove this.
3. Angiotensin II Blockers.
Losartan, candesartan, and irbesartan are metabolized by CYP2C9, with losartan being the most studied with respect to polymorphism.
a. Losartan.
Losartan is metabolized by CYP2C9 via an aldehyde intermediate (E-3179) to E-3174, the predominant active moiety (Stearns et al., 1995; Yasar et al., 2001b). In vitro studies suggest that CYP3A4 may also be involved (Stearns et al., 1995), whereas in vivo studies suggest that this is only of minor importance (Csajka et al., 1997; Williamson et al., 1998). E-3174 is at least 10-fold more potent than losartan at the AT1 receptor (Cozaar label information; http://www.fda.gov/cder/foi/label/2005/020386s040,020387s034lbl.pdf). Furthermore, although only 14% of losartan is metabolized to E-3174 (Lo et al., 1995), the AUC of the latter is 4- to 8-fold higher than that of the parent and is thought to be responsible for most of the activity (Goa and Wagstaff, 1996; Csajka et al., 1997). This finding suggests that individuals with CYP2C9 variants might have a reduced response to losartan. Four studies comprising 60 healthy volunteers have investigated the relationship between CYP2C9 status and losartan/E-3174 plasma pharmacokinetics after a single losartan dose (Fischer et al., 2002; Yasar et al., 2002; Lee et al., 2003b; Sekino et al., 2003). The CYP2C9*3 allele was associated with decreased production of E-3174, with homozygotes converting <1% of a dose to E-3174 (McCrea et al., 1999; Yasar et al., 2002). In individuals homozygous and heterozygous for CYP2C9*3, mean AUCs of E-3174 were ∼7 and 50% of the wild type, respectively (Yasar et al., 2002). Two studies did not show a significantly lower E-3174 AUC in CYP2C9*3 heterozygotes (Lee et al., 2003b; Sekino et al., 2003), perhaps reflecting the short sampling period and smaller subject number compared with the previous study (Yasar et al., 2002). The *2 allele does not seem to affect E-3174 production significantly (Yasar et al., 2002).
The impact of variant alleles on the parent compound is less clear. Two studies showed no significant difference in mean losartan AUC in relation to genotype (Yasar et al., 2002; Lee et al., 2003b), whereas two other studies showed 1.6-fold (nonsignificant) and 3.0-fold (significant) higher AUCs with the CYP2C9*1/*3 (Sekino et al., 2003) and CYP2C9*1/*2 genotypes (Fischer et al., 2002), respectively. Overall, it seems unlikely that CYP2C9 variants will affect parent losartan concentrations significantly since production of E-3174 constitutes a quantitatively minor route of elimination.
Only one of the three studies (Yasar et al., 2002; Lee et al., 2003b; Sekino et al., 2003) that included blood pressure assessments reported a significant influence of CYP2C9 and suggested reduced response among those with the *1/*3 genotype (Sekino et al., 2003). The fact that these studies were in healthy volunteers limits extrapolation to patients with hypertension (or heart failure). However, the severely reduced production of the active E-3174 in individuals with two *3 alleles could be important clinically.
b. Candesartan.
Candesartan is liberated from its ester prodrug (candesartan cilexitil) by presystemic hydrolysis in the intestinal wall (Gleiter and Morike, 2002). Candesartan is primarily excreted as unchanged drug (75%) in the urine and feces (Gleiter and Morike, 2002) with a smaller proportion (20-25%) inactivated by CYP2C9 (McClellan and Goa, 1998; Hanatani et al., 2001). An 89-year-old Japanese man developed hypotension and syncope with candesartan 4 mg daily and was later found to have a 2.5-fold higher candesartan concentrations than expected, which was suggested to result from his CYP2C9*1/*3 genotype. Losartan was subsequently tolerated by the patient (Uchida et al., 2003). Elevated concentrations of this magnitude are not consistent with the proportion of candesartan eliminated by CYP2C9 (<25%), suggesting that an alternative explanation is more likely. His renal function was reported to be normal with a creatinine clearance of 90 ml/min. Overall, CYP2C9 variants are unlikely to be important for candesartan, given the limited metabolism of this drug by CYP2C9 and the high therapeutic index of this class.
c. Irbesartan.
Irbesartan is metabolized by CYP2C9 in vitro (Bourrie et al., 1999), but in vivo studies on the pharmacokinetic implications are lacking. In two articles, blood pressure response was correlated with CYP2C9 genotype in hypertensive patients. One study associated the CYP2C9*1/*2 genotype with a greater decrease in diastolic blood pressure than the wild-type (14.4 versus 7.5%, respectively), with a trend for a reduction in systolic blood pressure (Hallberg et al., 2002). A second study focused on genotyping methodology but included some data from 62 Chinese patients taking irbesartan. No difference in efficacy was noted among those with the CYP2C9*1/*3 (n = 7) versus *1/*1 (n = 55) genotype. Response was defined merely as “outstanding”, “effective”, or “failed”, suggesting that caution should be taken when interpreting these findings (Wen et al., 2003). Further study is needed.
4. Nonsteroidal Anti-inflammatory Drugs.
Many NSAIDs are metabolized by CYP2C9 in vitro (Zhao et al., 1992; Leemann et al., 1993; Takanashi et al., 2000), although the clinical implications of this polymorphism have been poorly studied for most drugs.
a. Diclofenac.
This drug is considered to be a probe for CYP2C9 in vitro (Yamazaki et al., 1998b), yet has been convincingly shown to be unaffected by CYP2C9 variants in vivo (Shimamoto et al., 2000; Yasar et al., 2001a; Brenner et al., 2003; Dorado et al., 2003; Kirchheiner et al., 2003c).
b. Ibuprofen.
Like most NSAIDs, ibuprofen is given as a racemate of R- and S-enantiomers, with S-ibuprofen being active. As ∼60% of R-ibuprofen is unidirectionally converted to S-ibuprofen in vivo (Davies, 1998), both enantiomers should be considered active. CYP2C9 metabolizes R- and S-ibuprofen in vitro, with R-ibuprofen also being metabolized by CYP2C8. Consistent with this, three human studies showed that ibuprofen concentrations correlate with CYP2C9 genotype (Kirchheiner et al., 2002c; Garcia-Martin et al., 2004; Martinez et al., 2004b). The AUC of racemic ibuprofen was 1.6- and 1.8-fold higher in the *1/*3 and *3/*3 genotypes, due to elevated S-ibuprofen concentrations (1.5- and 1.7-fold, respectively). The CYP2C9*3 allele was also associated with enhanced inhibition of cyclooxygenase ex vivo (Kirchheiner et al., 2002c). The presence of one or two CYP2C8*3 alleles (which exist in strong linkage disequilibrium with CYP2C9*2) was associated with 1.7- and 1.8-fold higher AUCs of R-ibuprofen, respectively (section II.D.) (Martinez et al., 2004b). Individuals who are homozygous for CYP2C8*3/*3 or CYP2C9*3/*3 or double heterozygotes for both alleles are likely to have markedly reduced ibuprofen clearance to below the 10th percentile (Garcia-Martin et al., 2004). The AUCs of another propionic acid derivative, flurbiprofen, were 1.4- and 1.7-fold higher in the *1/*2 and *1/*3 genotype compared with the wild type (Lee et al., 2003a).
c. Oxicams.
The oxicams are hydroxylated by CYP2C9 in vitro (Zhao et al., 1992; Leemann et al., 1993; Bonnabry et al., 1996; Takanashi et al., 2000), with lornoxicam, piroxicam, and tenoxicam being affected by CYP2C9 variants in vivo (Vianna-Jorge et al., 2004; Perini et al., 2005; Zhang et al., 2005b). In a Chinese bioequivalence study of lornoxicam, one volunteer had an AUC almost 40-fold greater than those seen in wild type subjects. This volunteer had one CYP2C9*3 allele together with a new mutation (later designated CYP2C9*13) that presumably caused poor metabolism. In this subject, the half-life of the CYP2C9 probe, tolbutamide, was 9 to 15 times longer than expected, supporting the presence of two alleles that greatly reduce CYP2C9 enzyme activity (Si et al., 2004; Guo et al., 2005; Zhang et al., 2005b). Heterozygosity for CYP2C9*2 or *3 has been associated with 1.6- to 1.9-fold higher mean lornoxicam AUCs compared with those for the wild type (Zhang et al., 2005b; Liu et al., 2006). For piroxicam and tenoxicam, the AUCs after a single dose were significantly higher in Brazilian volunteers with CYP2C9*1/*2 (1.7- and 1.4-fold, respectively) and *1/*3 (1.7- and 1.8-fold, respectively) compared with those for the wild type (Vianna-Jorge et al., 2004; Perini et al., 2005). Data on the CYP2C9*3/*3 genotype are not available.
d. Celecoxib.
CYP2C9*3 has been associated with reduced celecoxib metabolism in vitro and in five of six in vivo studies (Kirchheiner et al., 2003e; Tang et al., 2001; Werner et al., 2002; Stempak et al., 2005; Lundblad et al., 2006). Individuals heterozygous and homozygous for CYP2C9*3 had 1.5- and 3.0-fold higher AUCs in one single-dose study (Kirchheiner et al., 2003e). An earlier single-dose study reported that the three highest AUC values (∼2 times the mean AUC of all participants) were seen in carriers of *3 alleles (Tang et al., 2001), whereas another study reported that a PM had a 2-fold higher AUC than the mean of 11 EMs (genotyping was undertaken but only the predicted phenotype was reported) (Werner et al., 2002). Recently, a pediatric patient homozygous for CYP2C9*3 was reported to have a 8- to 9-fold higher AUC compared with three EMs (CYP2C9*1/*1 or *1/*2), after one dose and at steady state (Stempak et al., 2005). Consistent with this finding, a steady-state study in adults reported a 7-fold higher AUC with the CYP2C9*3/*3 genotype compared with either the CYP2C9*1/*3 or *1/*1 genotype (Lundblad et al., 2006). In contrast, the sole CYP2C9*3/*3 subject in another steady-state study had an AUC comparable with that of the wild-type subjects (Brenner et al., 2003). The conflicting steady-state results observed in the latter three studies are difficult to interpret but may relate to variable metabolism by alternate enzymes (e.g., CYP3A) in some individuals with CYP2C9 deficiency (Tang et al., 2001). CYP2C9*2 had no clinical implications (Kirchheiner et al., 2003e; Tang et al., 2001; Sandberg et al., 2002; Brenner et al., 2003).
e. Other selective cyclooxygenase-2 inhibitors.
Lumiracoxib may be metabolized by CYP2C9 (Novartis Pharmaceuticals Corporation, Basel, Switzerland; http://www.fda.gov/ohrms/dockets/ac/05/briefing/2005-4090B2_02_Novartis-Lumiracoxib.doc), but fluconazole (a CYP2C9/3A4 inhibitor) caused only a minor increase in the AUC of this drug (18%) implying that CYP2C9 status may not be important clinically (Scott et al., 2004). Valdecoxib (withdrawn from the market in April 2005) is metabolized by multiple enzymes, including CYP3A4 and CYP2C9. Interaction studies show 40 and 60% increases in valdecoxib AUC with both ketoconazole and fluconazole, indicating a low likelihood that CYP2C9 polymorphisms will have a significant impact (Stichtenoth and Frolich, 2003). CYP2C9 is not appreciably involved in the metabolism of etoricoxib (largely 3A4) (Kassahun et al., 2001) or rofecoxib (cytosolic enzymes) (Davies et al., 2003).
f. Nonsteroidal anti-inflammatory drugs (in general) and clinical outcomes.
Although there are some important pharmacokinetic changes with the CYP2C9 genotype for some NSAIDs, there is insufficient information to determine whether this translates to altered drug effects. Three studies have investigated the relationship between CYP2C9 and gastrointestinal toxicity with this class. The CYP2C9 genotype frequency did not vary between 23 individuals with a history of gastric ulceration with NSAIDs and 32 individuals taking NSAIDs without this toxicity (Martin et al., 2001). However, half of the cases involved NSAIDs such as diclofenac, which are not appreciably affected by CYP2C9 variants in vivo. A later study investigated CYP2C9 genotype frequency in 94 patients with gastric bleeding episodes after NSAID use and 124 control subjects who tolerated NSAIDs. The presence of CYP2C9*2 or *3 was associated with increased risk of a GI bleeding episode (odds ratio 1.64; 95% CI 1.05, 2.58). This was due largely to *2, which was present in 23.4% of individuals with bleeding episodes compared with 13.7% in control subjects (*3 occurred in 8.5% of both groups) (Martinez et al., 2004a). The association of CYP2C9*2 with increased GI bleeding is at odds with the available pharmacokinetic data suggesting that NSAIDs are affected minimally by this variant. Furthermore, there was a wide range of NSAIDs in this study, including agents with minimal reliance on CYP2C9 for metabolism (aspirin and paracetamol) and those that have very low risk of GI bleeding (paracetamol). Despite these weaknesses, if only those patients and control subjects exposed to a NSAID purported to have extensive CYP2C9 metabolism (e.g., celecoxib and ibuprofen) were considered, patients were still more likely to have variant alleles (odds ratio 2.6; 95% CI 1.10, 6.19). In this analysis, diclofenac was also considered as a drug metabolized extensively by CYP2C9, although previous studies have not supported a relationship between CYP2C9 variants and diclofenac pharmacokinetics (Martinez et al., 2004a). A third study investigated the pharmacokinetics of piroxicam, indomethacin, diclofenac, and naproxen in patients with and without a history of GI bleeding with these drugs. A trend was observed for lower rather than higher AUCs among those who bled, which does not support a relationship with CYP2C9 polymorphism (Wynne et al., 1998). Thus, overall the evidence for a gene-effect relationship is weak at present. Certainly no case exists for prospective genotyping for any NSAID at the present time.
5. Phenytoin.
Phenytoin is primarily (80-90%) eliminated via 4′-hydroxylation to 5-(4p-hydroxyphenyl)-5-phenylhydantoin (HPPH), largely via CYP2C9, which preferentially produces the S-enantiomer of HPPH. CYP2C19 also plays a role, especially at higher concentrations (Bajpai et al., 1996; Ieiri et al., 1997; Giancarlo et al., 2001). Case reports show substantial elevations (4- to 5-fold) in phenytoin AUCs in those with CYP2C9 genotypes associated with very low enzyme activity (e.g., CYP2C9*3/*3) (Kidd et al., 1999,, 2001). In patients receiving a stable dose of phenytoin who had plasma concentrations within the therapeutic range, the presence of at least one CYP2C9*2 or *3 allele is associated with one-third lower mean dose requirements (199 versus 314 mg/day, respectively). Furthermore, a “gene-dose” effect seemed to exist, with dose requirements of 314, 193, 202, 217, and 150 mg/day for the CYP2C9*1/*1, *1/*2, *1/*3, *2/*2, and *2/*3 genotypes, respectively (van der Weide et al., 2001). Three Asian studies (two Japanese and one Taiwanese) showed 30 to 40% lower mean maximal elimination rates (Vmax) in those with the CYP2C9*1/*3 genotype compared with those with the wild type (Odani et al., 1997; Mamiya et al., 1998; Hung et al., 2004). The authors of the Taiwanese study provided dosage recommendations based on CYP2C9 and CYP2C19 genotypes. For example, wild-type individuals may require 5.5 to 7 mg/kg/day, whereas those with the CYP2C9*1/*3 genotype require 2 to 4 mg/kg/day, depending also on the presence of CYP2C19 variants (Hung et al., 2004).
The findings described above are supported by a single-dose study in healthy volunteers that showed 30% lower concentrations in wild-type individuals compared with carriers of CYP2C9*2 or *3 alleles. CYP2C9*2 and *3 were suggested to account for 31% of the variation in phenytoin concentrations taken 12 h after a single 300-mg dose (Aynacioglu et al., 1999). In another study, the AUC0-96 h values were 1.5- and 2.7-fold higher in those with one or two variant alleles, respectively, compared with those with the CYP2C9*1/*1 genotype (Caraco et al., 2001).
Thus, given that central nervous system toxicity (e.g., ataxia and nystagmus) is closely related to concentration, it is likely that individuals with CYP2C9 variants will be predisposed to these effects. Studies have investigated the relationship between CYP2C9 and cutaneous reactions (Lee et al., 2004) and gingival overgrowth (Soga et al., 2004). More individuals with the CYP2C9*1/*3 genotype were found among Korean patients with skin reactions to phenytoin compared with nonexposed controls (3 of 10 versus 1 of 169; crude odds ratio 71, p = 0.001) (Lee et al., 2004). A relationship between CYP2C9 variants and gingival overgrowth was not observed in the second study (n = 28), although elevated phenytoin concentrations were associated with more severe disease (Soga et al., 2004). Both studies included only a small number of patients with adverse effects, limiting the conclusions that can be drawn.
Phenytoin remains in wide use for the treatment and prevention of seizures despite complex nonlinear pharmacokinetics and a low therapeutic index. These features plus the recognition that elevated drug concentrations predispose to central nervous toxicity indicate that genotyping could prove useful. Although it is evident that CYP2C9 influences phenytoin dose requirements, further study is needed to determine whether prospective testing represents an advantage over the current trial and error approach and therapeutic drug monitoring. In addition, other genes may influence outcomes with phenytoin and require further investigation. For example, a silent polymorphism in ABCB1 (3435C>T) that encodes the drug transporter, P-glycoprotein, has been weakly correlated with phenytoin plasma concentrations (Kerb et al., 2001), whereas polymorphisms in the genes (SCN1A) encoding the sodium channel targeted by phenytoin have been associated with dosage requirements (Tate et al., 2005).
6. Other Drugs.
Fluvastatin, a 3-hydroxy-3-methylglutaryl CoA reductase inhibitor, is 50 to 80% metabolized in vitro by CYP2C9 (Fischer et al., 1999). The CYP2C9*3/*3 genotype is associated with 3-fold higher concentrations of the more active (+)-3R,5S-enantiomer than the wild type in vivo, whereas the CYP2C9*1/*3 and *2/*3 genotypes have intermediate concentrations. Total cholesterol concentrations did not differ between genotypes after 2 weeks (Kirchheiner et al., 2003b). Further studies are needed in relation to long-term cholesterol control and incidence of adverse effects such as myalgia.
Nateglinide is a nonsulfonylurea hypoglycemic drug with extensive in vitro metabolism by CYP2C9 (70%) and 3A4 (30%) (Starlix prescribing information; http://www.starlix.com/PDF/EnglishPI.pdf). The AUCs were 1.2- and 2-fold higher with the CYP2C9*1/*3 and *3/*3 genotypes, respectively, whereas *2 had no important effect (Kirchheiner et al., 2004b). As with the sulfonylureas, this study was conducted in healthy subjects, and CYP2C9 did not affect glucose, insulin, or glucagon concentrations (Kirchheiner et al., 2004b).
Torsemide is a loop diuretic metabolized by CYP2C9 (rate-limiting step) to the methylhydroxylated metabolite (M1) that is carboxylated to another metabolite called M5. Approximately 20% of torsemide is eliminated unchanged in the urine, whereas M1 and M5 comprise 10 and 50% of a torsemide dose excreted renally, respectively (Miners et al., 1995; Knauf and Mutschler, 1998). A human study showed 1.5-, 1.7 and 2.8-fold higher torsemide AUCs with the CYP2C9*1/*3, *2/*3, and *3/*3 genotypes, respectively, whereas those with the *1/*2 genotype behaved similarly to the wild type (Vormfelde et al., 2004). An in vitro study supported these findings showing that *3 but not *2 caused reduced torsemide metabolism (Miners et al., 2000). In the human study, there was no significant relationship between the number of CYP2C9*3 alleles and urine volume or sodium, chloride, or potassium excretion over 24 h. However, CYP2C9*3 was associated with increased electrolyte excretion from 0 to 8 h postdose and lower uric acid excretion for 24 h postdose compared with the wild type (Vormfelde et al., 2004). Larger studies investigating the long-term effects of CY2C9 variants on this drug in humans are needed.
7. Summary of CYP2C9.
The only CYP2C9-mediated drugs for which a starting case can be made for prospective genotype testing are warfarin, acenocoumarol, and phenytoin. Of these, the case for warfarin is strongest and scored within the “probable” range in the algorithm. Although this result seems quite convincing, the long experience of prothrombin time monitoring with warfarin and many other causes of variance suggest that uptake in the clinic will not be widespread. The case for acenocoumarol is similar but less strong because there is substantially less supportive evidence. More studies are needed. However, there seems to be no need for further association studies (at least in the Caucasian population), but research should be directed toward prospectively comparing a genotype-guided dosing regimen with a conventional trial and error or nomogram-based method. One such study seems to be underway with warfarin, with an abstract suggesting that genotype-based dosing may result in faster anticoagulation and reduced toxicity compared with a validated algorithm (Caraco et al., 2003). Further research should also continue to explore the many other genetic factors that influence warfarin dose requirements; one large prospective study is underway in the United Kingdom (Kamali and Pirmohamed, 2006). However, although the coumarin anticoagulants are expected to remain in use for many years to come, the availability of alternative agents such as the direct thrombin inhibitors may render choices about whether to genotype for CYP2C9 redundant.
A reasonable case for genotyping in relation to phenytoin to guide the initial choice of a maintenance dose can be made on the basis of a strong gene-(dose) concentration effect, a moderate gene-effect relationship, a strong concentration-effect relationship for both desired and adverse effects, and a low therapeutic index. Points against genotyping include the fact that an alternative pathway (CYP2C19) exists for phenytoin metabolism, therapeutic drug monitoring will continue to be necessary, and clinicians have long experience with phenytoin. Overall, phenytoin scored low “probable” in the algorithm (Table 2).
Of the other CYP2C9 substrates, only for the sulfonylureas and losartan can a tentative claim for prospective genotyping be made, although the case is very weak at this time (both scored “possible” in the algorithm). CYP2C9*3 is associated with decreased sulfonylurea clearance and may predispose to hypoglycemia. However, available data do not yet support prospective CYP2C9 genotyping of diabetic patients. Most studies to date have involved single doses in healthy subjects and have not identified a relationship between genotype and glucose or insulin concentrations. Studies need to be undertaken in the target population, particularly given that patients with diabetes have altered glycemic regulation compared with healthy individuals. In addition, although a retrospective study showed an excess of variant alleles in patients with hypoglycemia, most cases (65%) occurred in those who were wild type for CYP2C9 (Holstein et al., 2005). Furthermore, a clear relationship between sulfonylurea concentrations and response does not exist (Ferner et al., 1991). However, the extensive use of sulfonylurea drugs coupled with the morbidity and mortality associated with under- and overdosing indicates that modalities that could improve outcomes with this class should continue to be explored.
It is currently unclear whether the CYP2C9 genotype predicts a hypertensive response to angiotensin II receptor blockers, although the *3/*3 genotype may be associated with decreased response to losartan. Studies combining pharmacokinetic and pharmacodynamic assessment should be undertaken in patients with hypertension or heart failure.
C. CYP2C19
The first individual to be identified as a PM of mephenytoin (later identified as being metabolized via CYP2C19) was in 1979 (Kupfer et al., 1979). Subsequent studies confirmed that S-mephenytoin hydroxylase is polymorphically expressed (Kupfer and Preisig, 1984; Wedlund et al., 1984) and that other drugs such as omeprazole and proguanil have metabolism that cosegregates with that of mephenytoin (Table 5) (Ward et al., 1991; Chang et al., 1995a). The ability of individuals to metabolize S-mephenytoin has enabled them to be classified as PMs or EMs. As with the other P450 enzymes, the frequency of PMs varies across races, with 13 to 23% of Asians and 1 to 8% of Caucasians and black Africans lacking functioning enzyme (Desta et al., 2002b). S-Mephenytoin hydroxylase is now known as CYP2C19 and although it shares >90% amino acid homology with CYP2C9, these enzymes usually have very different substrate specificities (Romkes et al., 1991).
Difference in drug concentrations with CYP2C19 metabolizer status and evidence for and against genotyping Only studies involving oral drug administration and adult subjects were included. Case reports were excluded. AUC differences were significant unless otherwise specified. Cp12 h (concentration at 12 h postdose) or Cpmin (trough concentration) were used only if AUC data were not available. Heterozygous (het) EM is used when one high-activity allele and one low-activity allele (e.g., *1 / *3) are present. PM refers to two low-activity alleles or a poor metaboliser phenotype. EM refers to combined het and homozygous (hom) EM, either known (genotype) or presumed (phenotype).
The genetic basis of CYP2C19 deficiency was identified >10 years ago (de Morais et al., 1994; Goldstein and De Morais, 1994). Seven variants (*2-*8) in the CYP2C19 gene have now been associated with reduced enzyme activity in vivo, largely due to production of inactive enzyme protein (Ingelman-Sundberg et al., 2005). Furthermore, a novel variant (CYP2C19*17) that may produce an ultrarapid phenotype was recently identified (Sim et al., 2006). Individuals with two wild-type alleles are designated as homozygous EMs, whereas those carrying one or two variant alleles are designated as heterozygous EMs or PMs, respectively. Genotyping for CYP2C19*2 and *3 identifies most PMs in African-American and Chinese populations, as the allele frequencies of these variants are relatively high (17 and 30% for *2 and 0.4 and 5% for *3, respectively), and other mutations are rare. CYP2C19*2 is also relatively common among Caucasians with an allele frequency of 15% compared with 0.04% for the *3 allele. In Caucasians, genotyping for CYP2C19*2 will identify 70 to 85% of variant reduced activity alleles, whereas genotyping for CYP2C19*2-*8 will identify more than 99% of PMs (Desta et al., 2002b). The CYP2C19*17 allele associated with an ultrarapid phenotype seems relatively common (allele frequencies of 18% in Swedes and Ethiopians and 4% in Chinese). Data on the clinical implications are generally lacking, although it is predicted that homozygosity for this allele may result in 40% lower omeprazole concentrations (Sim et al., 2006).
1. Proton Pump Inhibitors.
The proton pump inhibitors (PPIs) are among the most extensively used drugs in the world. In EMs, CYP2C19 is responsible for >80% of the metabolism of omeprazole, lansoprazole, and pantoprazole (Andersson et al., 1998), with CYP3A4 undertaking most of the remaining metabolism (Pearce et al., 1996; Bottiger et al., 1997). The metabolites produced are inactive. A fourth PPI, rabeprazole, may have less reliance on CYP2C19 as it undergoes nonenzymatic conversion to rabeprazole thioether. S-Omeprazole (esomeprazole) was recently marketed as an individual entity, exploiting its reduced variation in pharmacokinetics in relation to CYP2C19 genotype compared with the racemate or R-omeprazole (Andersson et al., 2001).
The AUCs of both omeprazole and lansoprazole are 4- to 15-fold higher in PMs than in homozygous EMs, whereas heterozygous EMs are intermediate between the two (2- to 3-fold higher than homozygous EMs) (Furuta et al., 1999a,b, 2001c; Ieiri et al., 2001; Shirai et al., 2001; Cho et al., 2002; Kim et al., 2002; Shirai et al., 2002). With multiple dosing, the increase in AUC of omeprazole (but not of lansoprazole or pantoprazole) decreases to ∼2-fold in EMs, due to inhibition of its own metabolism by CYP2C19 (Andersson et al., 1998; Shirai et al., 2001). This does not occur in PMs who lack functioning CYP2C19 enzyme to inhibit. Pantoprazole is less intensively studied with respect to CYP2C19 polymorphism, but seems to behave similarly to omeprazole and lansoprazole, with a 6-fold higher AUC in PMs than in heterozygous and homozygous EMs (combined) (Tanaka et al., 1997; Andersson et al., 1998). The AUCs of rabeprazole are also increased but less markedly in CYP2C19 deficiency (1.3- to 2.3-fold in heterozygous EMs and 3.0- to 5.3-fold in PMs) (Horai et al., 2001; Ieiri et al., 2001; Shirai et al., 2001; Lin et al., 2003).
Individuals with CYP2C19 deficiency have superior acid suppression with conventional doses of omeprazole and lansoprazole (Furuta et al., 1999b; Sagar et al., 2000; Shirai et al., 2001) and presumably pantoprazole. In one study, the mean 24-h intragastric pH values in PMs, heterozygous EMs, and homozygous EMs were 4.1, 3.3, and 2.3, respectively, after a single 20-mg dose of omeprazole (compare with a mean pH ≤2.0 with placebo) (Shirai et al., 2001). After 8 days of dosing, the mean pH values were 5.9, 4.7, and 4.1 (respectively) (Shirai et al., 2001), and the percentage of time with a pH >4 was significantly greater in PMs (∼92%) than in heterozygous EMs (72%) or homozygous EMs (37%) (compared with 3-6% with placebo) (Sagar et al., 2000). Most (Horai et al., 2001; Ieiri et al., 2001; Shirai et al., 2001; Lin et al., 2003) but not all (Adachi et al., 2000) of the studies with rabeprazole show the lowest intragastric pH in homozygous EMs. Thus, standard recommended doses of any of these PPIs might not provide sufficient acid suppression in homozygous EMs, suggesting that an increase in dose might be required in this group. Indeed, one study showed that increasing the lansoprazole dose from 30 mg once daily to four times daily in homozygous EMs lead to an increase in mean 24-h intragastric pH from 4.5 to 7.0 (Furuta et al., 2001c).
One of the areas of pharmacogenetics that has been most intensively studied is the relationship between the CYP2C19 genotype and Helicobacter pylori eradication with PPI-based dual or triple therapy (PPI plus amoxicillin ± clarithromycin or metronidazole). Overall, omeprazole and lansoprazole-based regimens produce lower eradication rates in homozygous EMs than in heterozygous EMs or PMs (Furuta et al., 2001b; Sapone et al., 2003). For example, a 7-day triple therapy regimen resulted in cure rates of 60% in homozygous EMs, compared with 84 and 100% of heterozygous EMs and PMs, respectively (Sapone et al., 2003). Another study observed eradication rates of 73, 92, and 98% in homozygous EMs, heterozygous EMs, and heterozygous PMs, respectively (Furuta et al., 2001b). Other studies have not observed differences among groups (Dojo et al., 2001; Miyoshi et al., 2001), perhaps due to variation in study design (e.g., sample size), medication compliance, or local antibiotic sensitivities. Homozygous EMs are likely to have reduced cure rates with pantoprazole-based regimens (Gawronska-Szklarz et al., 2005). Some studies on rabeprazole have shown no important influence of genotype (Dojo et al., 2001; Hokari et al., 2001; Miyoshi et al., 2001; Isomoto et al., 2003; Kawabata et al., 2003), whereas others show lower cure rates in homozygous EMs (∼60 versus >90% in the other groups) (Furuta et al., 2001a; Inaba et al., 2002). Almost all of the studies of H. pylori eradication have been undertaken in Japanese patients, although available data in Caucasians suggest similar findings (Sapone et al., 2003; Schwab et al., 2004; Gawronska-Szklarz et al., 2005).
It seems that genotyping could provide a useful aid to prescribing for H. pylori eradication, and initial data suggest that this effort may be cost-effective (Lehmann et al., 2003). If patients are confirmed as being PMs, dual therapy with PPI plus amoxicillin may be appropriate as the eradication rate is likely to be high (>90%) (Aoyama et al., 1999; Tanigawara et al., 1999). This regimen has the advantage of being cheaper and less complex than triple-therapy regimens. Individuals identified as homozygous EMs might be better to commence a triple-drug regimen (PPI, amoxicillin, and clarithromycin), because a higher cure rate is likely to be achieved (∼80-90 versus 30-40% for dual therapy) (Aoyama et al., 1999; Tanigawara et al., 1999). If the standard triple-drug therapy fails, alternative approaches may include a non-PPI-based regimen (e.g., metronidazole, amoxicillin, bismuth, or H2-antagonist) (Tanigawara et al., 1999) or high-dose PPI (e.g., omeprazole or lansoprazole 120 mg/day) plus amoxicillin for 2 weeks (Furuta et al., 2001b). However, the latter option with rabeprazole (40 mg/day) met with unsatisfactory results compared with a 1-week course of rabeprazole (20 mg/day), amoxicillin, and metronidazole (59 versus 82% cure rate) in individuals in whom a lansoprazole/amoxicillin/clarithromycin regimen had failed (Isomoto et al., 2003).
There has been less research into the relationship between CYP2C19 genotype and outcomes in gastroesophageal reflux disease (Furuta et al., 2002; Egan et al., 2003; Kawamura et al., 2003; Ohkusa et al., 2005; Schwab et al., 2005). Two studies reported significantly lower esophageal healing rates in homozygous EMs after lansoprazole 30 mg daily for 8 weeks (Furuta et al., 2002; Kawamura et al., 2003). In contrast, esophageal acid exposure or reflux symptoms did not vary with genotype in patients already taking a PPI for gastroesophageal reflux disease (Egan et al., 2003). Similarly, no difference in reflux symptoms or healing rate was observed among genotypes after omeprazole 10 to 20 mg daily for 6 months (Ohkusa et al., 2005) or esomeprazole 40 mg daily for 1 month (Schwab et al., 2005). Although conflicting, these data seem to suggest that the rate of esophageal healing may be quicker among PMs, but that genotype differences matter little with longterm treatment.
The PPIs are an exceptionally well-tolerated class of drugs, and there seems to be no clear evidence of increased toxicity among PMs, despite a markedly elevated AUC. For example, one study identified 29 patients with omeprazole-associated visual disturbances and found no relationship with CYP2C19 genotype (Lutz et al., 2002). However, individuals with CYP2C19 deficiency may be predisposed to vitamin B12 deficiency during long-term use of this class. Under normal circumstances, the vitamin B12 present in food is liberated in the presence of gastric acid. As the degree of gastric acid suppression varies with genotype, those with the greatest suppression (i.e., the PMs) may have reduced dietary vitamin B12 absorption. One study reported significantly lower serum vitamin B12 concentrations in heterozygous EMs than in homozygous EMs (246 ± 71 versus 305 ± 98 pmol/l, respectively) with long-term omeprazole (Sagar et al., 1999). The sole PM had a decline in vitamin B12 from 360 to 178 pmol/l over 1 year. The findings of this study could be of minimal significance given the limited evidence that cobalamin deficiency or megaloblastic anemia is a problem with PPIs in practice (Mitchell and Rockwood, 2001). However, this could also be an under-reported side effect given that there is likely to be a considerable delay between the initiation of the PPI and the development of clinically apparent deficiency.
Given the huge overall use of the PPIs, prospective genotype testing is unlikely to be routine in practice. However, when initial therapy with conventional doses is not satisfactory, testing might be helpful. Higher doses of the PPIs should be used in homozygous EMs (e.g., 40 versus 20 mg of omeprazole) and lower doses (e.g., 10 mg) could be used in heterozygous EMs and PMs if genotype is known.
2. Benzodiazepines.
CYP2C19 metabolizes several benzodiazepines, including diazepam, flunitrazepam, quazepam, and clobazam, with the remaining members of this class being metabolized primarily by CYP3A4 (e.g., midazolam) and glucuronidation (e.g., temazepam).
Diazepam is the best studied benzodiazepine with respect to CYP2C19, and in vitro studies suggest that CYP2C19 and 3A4 mediate 33 and 44% of the production of the main active metabolite desmethyldiazepam, respectively. CYP2C19 also plays a small role in producing two other active metabolites, oxazepam (from desmethyldiazepam) and temazepam (Andersson et al., 1994; Jung et al., 1997). The metabolism of diazepam cosegregates with S-mephenytoin hydroxylation in Caucasians (Bertilsson et al., 1989), Koreans (Sohn et al., 1992b), Japanese (Ishizaki et al., 1995), and Chinese (Wan et al., 1996; Qin et al., 1999). A lower overall clearance in Asians compared with Caucasians reflects the higher proportion of CYP2C19 variants in Asians (Bertilsson et al., 1989; Zhang et al., 1990). Single-dose studies in Caucasians and Koreans suggest that PMs of S-mephenytoin have 2-fold higher diazepam AUCs than EMs (Bertilsson et al., 1989; Sohn et al., 1992b). One Chinese study reported 2.5- and 6.1-fold higher AUCs in heterozygous EMs and PMs, respectively, compared with homozygous EMs (Qin et al., 1999). Desmethyldiazepam concentrations also increase in CYP2C19 PMs, as a result of reduced elimination by this enzyme (Bertilsson et al., 1989). Thus, the overall effect of CYP2C19 deficiency is to increase exposure to diazepam and its initial active metabolite. This increase may be associated with prolonged effect. A recent study reported that PMs and IMs took longer than EMs to emerge from anesthesia involving 0.1 mg/kg i.v. diazepam, with a median (25th-75th percentile range) time of 18 (13-21) and 13 (9-20) versus 10 (8-12) min, respectively (Inomata et al., 2005).
Flunitrazepam is metabolized by CYP2C19 in vitro, which is estimated to contribute substantially (approximately two-thirds) to the formation of desmethylflunitrazepam (Coller et al., 1999b; Kilicarslan et al., 2001). In vivo, PMs have been observed to have significantly higher mean concentrations from 8 h after a single dose. No difference in flunitrazepam AUC was seen among genotypes, perhaps reflecting an inaccurate AUC estimate as a result of the short blood sampling period (48 h) relative to the flunitrazepam half-life (∼25 h), and the small number of subjects studied (n = 16) (Gafni et al., 2003). Recently, the AUC of quazepam was shown to be 1.7-fold higher in PMs after a single dose (Fukasawa et al., 2004), whereas carriers of CYP2C19 variants have been shown to have elevated N-desmethylclobazam (active)/clobazam concentration ratios (Contin et al., 2002; Giraud et al., 2004; Kosaki et al., 2004).
Although diazepam has a clear gene-concentration effect, the implications are less clear, given the many active metabolites and involvement of other P450 enzymes. Genotyping is unlikely to provide a useful means of improving therapy with this class if only a single dose is to be given. There is currently insufficient evidence to determine whether genotyping would help prevent excessive central nervous system depression during longterm treatment, when accumulation may occur, especially in Asian patients who are PMs.
3. Tricyclic Antidepressants.
As indicated in section II.A., the metabolism of this class is complex, with CYP2C19 being involved in the demethylation of the tertiary amines (Fig. 1) (Nielsen et al., 1996; Koyama et al., 1997; Venkatakrishnan et al., 1998; Kirchheiner et al., 2003d). The tertiary TCAs all seem to behave similarly with respect to the CYP2C19 polymorphism (Skjelbo et al., 1991; Kramer Nielsen et al., 1994; Eap et al., 2000; Yokono et al., 2001; Kirchheiner et al., 2003d). In CYP2C19 PMs, elevated amitriptyline (1.4- to 1.8-fold) and reduced nortriptyline concentrations (to 40-80%) occur. However, the sum of amitriptyline plus nortriptyline (used for therapeutic drug monitoring) does not change appreciably (Shimoda et al., 2002; Jiang et al., 2003; Steimer et al., 2004), suggesting minimal impact on outcomes (assuming that this depends on the summed effect of both drugs). This may not be a reasonable assumption, given the differing affinities of parent and metabolites for various receptor types (serotonin, muscarinic, etc.) and the presence of other active metabolites. Recently, combined testing for CYP2C19 and CYP2D6 genotypes was suggested to predict those at increased risk of side effects with amitriptyline. In this study, side effects correlated with nortriptyline (not amitriptyline) concentrations and genetic scenarios that predisposed to a high nortriptyline/amitriptyline ratio increased the risk of side effects (i.e., reduced CYP2D6 activity and increased CYP2C19 activity). In particular, 82% (9 of 11) of patients who were wild type for CYP2C19 and carried only one functional CYP2D6 allele had significant side effects with amitriptyline 75 mg twice daily. This finding contrasts with the failure to observe significant side effects in 13 patients who were carriers of one functional CYP2C19 allele (heterozygous EMs) and two functional CYP2D6 alleles (EMs). The effect of CYP2C19 did not reach statistical significance, perhaps because the group with a presumed decrease in CYP2C19 function consisted almost entirely of heterozygotes (rather than PMs with two variant alleles) (Steimer et al., 2005). Further work needs to be conducted to corroborate these findings, particularly in the context of the clinical scenario in which the TCA dose is titrated against tolerability. As yet, there is currently no rationale for routine genotyping for CYP2C19 in relation to the TCAs.
4. Selective Serotonin Reuptake Inhibitors.
CYP2C19 PMs have significantly higher concentrations of citalopram (Sindrup et al., 1993; Herrlin et al., 2003), fluoxetine (Liu et al., 2001), and sertraline (Wang et al., 2001). Citalopram (racemic and the active S-enantiomer) concentrations are ∼1.7-fold higher in PMs at steady state (Sindrup et al., 1993; Herrlin et al., 2003), although no significant difference was seen after a single dose (Yu et al., 2003). The AUC of sertraline was 1.4-fold higher after a single dose in Chinese volunteers (Wang et al., 2001). These small differences in AUC are of doubtful clinical significance given the lack of a clear concentration-effect relationship with this class. The AUC of fluoxetine is higher (2.9-fold) in PMs than in homozygous EMs, although production of the active metabolite (norfluoxetine) decreases, suggesting total exposure to active drug may not change appreciably (Liu et al., 2001). CYP2C19 polymorphism is likely to be more relevant when multiple other routes of elimination are suppressed. For example, citalopram is metabolized by CYP2D6 and CYP3A as well as by CYP2C19. One PM for both CYP2C19 and 2D6 had a severe reaction (e.g., GI disturbance and restlessness) associated with a half-life of 95 h (2-3 times normal) (Herrlin et al., 2003). Overall, as with the TCAs, there is currently no rationale for routine genotyping for CYP2C19 in relation to the SSRIs.
5. Barbiturates.
CYP2C19 is involved in the metabolism of hexobarbital, mephobarbital, and phenobarbital to varying degrees. However, this pathway is responsible for only a small proportion of total phenobarbital elimination. Phenobarbital p-hydroxylation cosegregates with CYP2C19 activity (Hadama et al., 2001) but p-hydroxyphenobarbital is produced via alternative pathways, indicating that CYP2C19 polymorphism has little clinical consequence. No difference in phenobarbital AUCs were observed between EMs and PMs of mephenytoin after 14 days of dosing in healthy subjects (Hadama et al., 2001). However, a study of Japanese patients with epilepsy showed 20% lower phenobarbital clearance in PMs than in EMs (Mamiya et al., 2000), and a similar reduction has been observed during coadministration of felbamate, an inhibitor of CYP2C19 (Reidenberg et al., 1995). These small differences are unlikely to lead to the recommendation that routine genotyping should take place for phenobarbital, particularly given that the use of this drug in developed countries is declining in favor of agents with improved safety and that monitoring of phenobarbital concentrations is often undertaken.
Mephobarbital undergoes stereoselective metabolism, with two routes identified in humans. R-Mephobarbital is primarily (≥80%) metabolized by CYP2C19 to the 4′-hydroxymetabolite, whereas S-mephobarbital is largely N-demethylated by CYP2B6 to phenobarbital, the major metabolite in plasma (Kupfer and Branch, 1985; Kobayashi et al., 1999a, 2001, 2004). It is not clear whether R- and S-mephobarbital differ in activity. In a single-dose Japanese study (n = 30), the mean AUC of R-mephobarbital after administration of the racemate was 92-fold higher in PMs than in homozygous EMs, and the half-life was similarly prolonged (∼88 h in PMs versus 3.6 and 6.8 h in homozygous and heterozygous EMs, respectively). This is an enormous effect and perhaps impossible, but if confirmed even to a lesser extent in a steady-state study would provide a strong rationale for genotyping. The AUC of S-mephobarbital was not significantly different among groups. However, the AUC of the N-demethylated metabolite, phenobarbital, was higher in PMs, perhaps as a result of conversion from R-mephobarbital in PMs (Kobayashi et al., 2004). In vitro and in vivo studies show that the clearance of (R)- and (S)-hexobarbital is reduced in PMs compared with EMs of mephenytoin (Knodell et al., 1988; Yasumori et al., 1990; Adedoyin et al., 1994). Although these data look compelling, more studies are needed for corroboration.
6. Proguanil.
Proguanil is thought to be inactive at concentrations achieved in vivo, with the initial metabolite, cycloguanil, believed to produce the antimalarial effect (Carrington et al., 1951; Watkins et al., 1984). Production of cycloguanil and another metabolite, 4-chlorophenylbiguanide (inactive at usual concentrations), is partially mediated by CYP2C19 (Ward et al., 1991; Funck-Brentano et al., 1992, 1997; Brosen et al., 1993b; Birkett et al., 1994; Setiabudy et al., 1995; Skjelbo et al., 1996; Coller et al., 1997, 1999a; Hoskins et al., 1998; Bolaji et al., 2002). The ratio of proguanil to cycloguanil has been used as a marker of CYP2C19 activity (Funck-Brentano et al., 1992; Brosen et al., 1993b) but may not be as reliable as the test for S-mephenytoin (Hoskins et al., 1998), perhaps due to some involvement of CYP3A4 in cycloguanil formation (Birkett et al., 1994; Funck-Brentano et al., 1997; Coller et al., 1999a). CYP2C19 PMs may attain cycloguanil concentrations that range from undetectable to 38% of those observed in EMs (depending on factors such as timing of plasma sampling) (Helsby et al., 1993; Setiabudy et al., 1995; Edstein et al., 1996; Herrlin et al., 2000; Thaper et al., 2002). These results suggest that PMs may be more likely to experience failure in malarial prophylaxis compared with EMs. Furthermore, attainment of subinhibitory concentrations may encourage resistance to develop. However, there is little evidence to suggest that this resistance actually affects outcomes with proguanil (Edstein et al., 1994; Mberu et al., 1995; Skjelbo et al., 1996; Kaneko et al., 1999). More studies are needed.
7. Phenytoin.
As mentioned in section II.B., the relative involvement of CYP2C19 in phenytoin metabolism increases as phenytoin concentrations rise (Bajpai et al., 1996), due to saturation of CYP2C9. The latter enzyme is largely responsible for formation of S-HPPH, which is the dominant urinary metabolite. CYP2C19 produces a quantitatively less important metabolite, R-HPPH, and reduced urinary elimination of this metabolite (but not of S-HPPH) is seen in CYP2C19 PMs (Fritz et al., 1987). Single-dose studies suggest no important influence of CYP2C19 metabolizer status on phenytoin metabolism (Schellens et al., 1990; Kerb et al., 2001), possibly reflecting the lack of CYP2C9 saturation with single doses. In contrast, population pharmacokinetic studies in Japanese and Taiwanese patients who were regularly administered phenytoin for epilepsy have demonstrated a slight reduction in Vmax and/or Km in the presence of CYP2C19 variants (Odani et al., 1997; Mamiya et al., 1998; Hung et al., 2004). Dose recommendations from one of these studies included 5.5 to 7 mg/kg/day for those wild type for CYP2C9 and CYP2C19 and 5 to 7 mg/kg/day and 5 to 6 mg/kg/day for heterozygous EMs and PMs of CYP2C19, respectively. These differences in doses seem minor compared with those proposed in the presence of the CYP2C9*3 allele for which a 37% reduction in Vmax led to a suggested dose range of 3 to 4 mg/kg/day for heterozygotes (Hung et al., 2004). Other evidence for a role for CYP2C19 is derived from interaction studies, in which known inhibitors of CYP2C19, such as ticlopidine, reduce phenytoin clearance (Donahue et al., 1997; Donahue et al., 1999). Overall, these data suggest that CYP2C19 genotyping could be of clinical value for phenytoin, which has nonlinear pharmacokinetics and a narrow therapeutic range. This genotyping might be particularly important in individuals who are prescribed high doses or have concurrent CYP2C9 deficiency. However, with the ready availability and wide acceptance of therapeutic drug monitoring, it seems very unlikely that such genotyping will take place prospectively in the current milieu. Certainly, arguments in favor of testing for CYP2C9 would seem more compelling, and should have priority. Testing for both CYP2C9 and CYP2C19 could, of course, be performed concurrently.
8. Moclobemide.
A single-dose study showed elevated AUCs of this antidepressant in Caucasian and Chinese PMs (2.8- and 2.7-fold, respectively) and heterozygous EMs (1.7- and 1.3-fold, respectively), compared with homozygous EMs (Hoskins et al., 2000). A second single-dose study, presumed to be in Korean volunteers, reported a 3.5-fold higher average AUC in genotypic PMs, compared with that in homozygous EMs (Yu et al., 2001). An earlier study provided single- and multiple-dose data, with the AUCs estimated to be 2.7-fold after one dose and 1.7-fold after multiple dosing in PMs versus EMs (Gram et al., 1995). The lower difference in AUC with regular use may have resulted from the different susceptibility to autoinhibition, which causes 50 and 25% reductions in moclobemide clearance in EMs and PMs, respectively (Schoerlin et al., 1987; Gram et al., 1995). In addition, the multiple dose study used phenotyping rather than genotyping, and consequently all homozygous and heterozygous EMs were combined in the same group. Data on the pharmacodynamic implications are virtually nonexistent. Given the relatively benign side effect profile of moclobemide monotherapy, CYP2C19 genotype or phenotype may not significantly influence the tolerability of this drug.
9. Other Drugs.
A number of other drugs are substrates for CYP2C19, although in most cases this impacts little on drug concentrations or effect. For example, propranolol is metabolized via 4-hydroxylation, side chain oxidation, and glucuronidation, with the first two reactions involving CYP2D6 and CYP2C19, respectively. PMs of S-mephenytoin have a 50% reduction in the side chain oxidation (Ward et al., 1989), but the AUC of the parent propranolol is not appreciably affected because of the multiple enzymes involved in its overall metabolism. However, coinheritance of CYP2C19 and CYP2D6 deficiency may result in more important increases in propranolol concentrations, perhaps to 2-fold (Ward et al., 1989). Another example is nelfinavir, which is metabolized by CYP2C19 to a metabolite (M8) with comparable antiviral activity (Bardsley-Elliot and Plosker, 2000; Hirani et al., 2004). The decrease in M8 formation that occurs in CYP2C19 deficiency (Lillibridge et al., 1998) may not affect viral suppression, as the total amount of active drug may not change appreciably (Khaliq et al., 2000).
For a few other drugs, a large difference in active drug concentrations exists between PMs and EMs, but clinical relevance remains unclear. For example, the considerable interindividual variability in voriconazole pharmacokinetics is partially due to CYP2C19 polymorphism, with PMs having 2- to 6-fold higher average AUCs (Ikeda et al., 2004). In a pediatric study, a combined group of heterozygous EMs and PMs had 46% lower clearance than homozygous EMs after intravenous voriconazole administration (Walsh et al., 2004). These results suggest that PMs may be predisposed to concentration-dependent side effects, such as hepatotoxicity (Boucher et al., 2004). However, data confirming this supposition are lacking.
10. Summary of CYP2C19.
The PPIs omeprazole and lansoprazole scored at the low end of the “probable” range in our algorithm (Table 2), thus making a reasonably strong case for prospective genotyping. This score was based on a strong gene-concentration effect, a reasonably strong gene-desired effect relationship, and a suggestive pharmacoeconomic analysis. Against genotyping are a poor gene-adverse effect relationship and the overall high therapeutic index of the drugs. The situation with PPIs is different from that with most drugs in this article in that PMs respond better with conventional doses without a significant increase in adverse effects. The more common situation is for PMs to experience excessive effects, requiring dose reduction. Genotyping would allow EMs to be given higher doses of PPIs in the case of therapeutic failure. However, the very high therapeutic index of this class and the huge worldwide experience would suggest that genotyping is unlikely to be used commonly in practice, except to explain poor response. Of the other CYP2C19 substrates, the strongest case is perhaps for diazepam, although it scored “unlikely” in the algorithm (Table 2). Perhaps the only place for genotyping in relation to diazepam is to explain excessive apparent effect. The individual case of mephobarbital with the 92-fold increase in the R-enantiomer suggests that further study could be helpful. However, clinical relevance is limited in light of its low utilization.
D. Other Cytochromes P450
1. CYP2B6.
This enzyme has undergone comparatively little study, possibly because it was thought to be absent in some livers and present in low (perhaps unimportant) levels in others (Mimura et al., 1993; Shimada et al., 1994). It has now been shown to be relatively abundant in the livers of some individuals, with substantial (>100-fold) variation in expression (Ekins et al., 1998; Chang et al., 2003). CYP2B6 is involved in the metabolism of several therapeutic drugs, including bupropion (Faucette et al., 2000), cyclophosphamide (Xie et al., 2003), efavirenz (Ward et al., 2003), ifosfamide (Granvil et al., 1999), and nevirapine (Erickson et al., 1999). It also metabolizes some procarcinogens (e.g., 6-aminochrysene) (Mimura et al., 1993) and drugs of abuse (e.g., N-methyl-3,4-methylenedioxyamphetamine, ecstasy) (Kreth et al., 2000). CYP2B6 is subject to inhibition and induction by drugs such as clopidogrel (Richter et al., 2004; Turpeinen et al., 2005) and phenobarbital (Martin et al., 2003), respectively.
The genetic factors contributing to the variable expression of CYP2B6 are not yet understood. However, a number of single nucleotide polymorphisms have been identified in the CYP2B6 gene that result in amino acid substitution, e.g., R22C (64C>T, exon 1), Q172H (516G>T, exon 4), S259R (777C>A, exon 5), K262R (785A>G, exon 5) and R487C (1459C>T, exon 9). The distribution of these mutations (alone or in combinations) resulted in the definition of six initial CYP2B6 alleles: CYP2B6*2 (R22C), CYP2B6*3 (S259R), CYP2B6*4 (K262R), CYP2B6*5 (R487C), CYP2B6*6 (Q172H and K262R), and CYP2B6*7 (Q172H, K262R, and R487C) (Lang et al., 2001). Results of studies on the impact of these variants are conflicting. For example, one study demonstrated that carriers of the R487C mutation (CYP2B6*5 and CYP2B6*7) had reduced CYP2B6 protein expression and S-mephenytoin N-demethylation (a marker of CYP2B6 metabolism) than wild-type livers (Lang et al., 2001). Another study found no effect of R487C on protein expression or cyclophosphamide hydroxylation (Xie et al., 2003). With regards to clinical relevance, bupropion and efavirenz have been studied most intensively, with data suggesting that some of the above variants may have an impact on plasma concentrations and effect.
a. Bupropion.
This antidepressant is also marketed to assist with smoking cessation. CYP2B6 is the key enzyme producing hydroxybupropion (Faucette et al., 2000; Hesse et al., 2000), which exists in higher plasma concentrations than the parent in vivo (Laizure et al., 1985). Both the parent drug and the hydroxy metabolite are active. Wide interindividual variation (∼10-fold variation in AUC) in the pharmacokinetics of bupropion and hydroxybupropion were observed among 121 male Caucasian volunteers after a single dose (Kirchheiner et al., 2003a). No outliers that seemed to represent a separate group of very rapid or slow metabolizers were identified. A number of single nucleotide polymorphisms (R22C, Q172H, S259R, K262R, and R487C) were analyzed, with individuals with one CYP2B6*4 (K262R) allele having a 1.4-fold higher median bupropion clearance than those without this allele (203 versus 149 l/h, respectively). Consistent with this finding, the CYP2B6*1/*4 genotype was associated with a slightly higher (∼1.2-fold) AUC of hydroxybupropion than the CYP2B6*1/*1 genotype (Kirchheiner et al., 2003a). Although all variants have not been assessed, the small change in the AUC observed and the fact that the metabolite is also active suggests that polymorphic effects are likely to be minimal.
b. Efavirenz.
This non-nucleoside reverse transcriptase inhibitor is usually administered in a nonindividualized dose of 600 mg once daily. This practice makes little sense in the context of the substantial interindividual variability in plasma concentrations and the associations of low concentrations with treatment failure and high concentrations with central nervous system toxicity (e.g., headaches and fatigue) (Marzolini et al., 2001).
The relationship between variations in the CYP2B6 gene and outcomes with efavirenz has been investigated in several studies (Haas et al., 2004; Tsuchiya et al., 2004a; Rotger et al., 2005). In one study, 35 Japanese patients with human immunodeficiency virus (HIV) infection received efavirenz 600 mg once daily with two nucleotide reverse transcriptase inhibitors. Two of these patients were homozygous for the CYP2B6*6 allele (516G>T and 785A>G) and had significantly elevated efavirenz plasma concentrations (30.7 and 20.0 mM) compared with the mean concentration of the remaining patients with one or no CYP2B6*6 alleles (9.9 and 8.0 mM, respectively). Nine additional patients were subsequently studied, with three observed to have elevated efavirenz concentrations (>20 mM) and to be CYP2B6*6 homozygotes. The genotype of the remaining six patients with normal concentrations in this additional group was not disclosed (Tsuchiya et al., 2004a).
Two other groups used population-based pharmacokinetic analysis to investigate the effect of the 516G>T single nucleotide polymorphism on efavirenz concentrations and toxicity in participants enrolled in studies of HIV (Haas et al., 2004; Rotger et al., 2005). Both of these studies suggested a 3-fold increase in the average AUC of efavirenz among 516T homozygotes compared with 516G homozygotes, with heterozygotes falling intermediate between the two (Haas et al., 2004; Rotger et al., 2005). In addition, 2.3-fold higher intracellular (peripheral blood mononuclear cell) efavirenz concentrations were observed in 516T homozygotes in one of the studies (Rotger et al., 2005). In both studies, an increased risk of central nervous system effects (e.g., sleep or mood disorders) was observed in those homozygous for the CYP2B6 516T variant.
Collectively, these studies suggest that individuals homozygous for the 516T variant or the CYP2B6*6 allele (516G>T and 785A>G) may have 2- to 3-fold higher efavirenz concentrations and may be predisposed to side effects. This drug scores at the low end of “possible” in the algorithm (Table 2). As this is a relatively common genetic variant (∼ 3% of European-Americans and 20% of African-Americans have the CYP2B6 T/T genotype at position 516), prospective genotyping could offer an advantage in terms of improved tolerability (and perhaps compliance) and reduced drug costs. This could be particularly important when coadministered drugs such as nevirapine may also be affected by the 516G>T variant (Rotger et al., 2005). Clearly, further work needs to be undertaken to test this hypothesis.
2. CYP2C8.
The identification of CYP2C8 variants that may have an impact on important therapeutic compounds (e.g., paclitaxel) has led to renewed interest in this gene. At least four variants that result in amino acid changes have been identified and named CYP2C8*2 to *5. The *2 and *3 alleles have been associated with defective in vitro metabolism of the CYP2C8 probe, paclitaxel (Dai et al., 2001). The *3 allele is most frequently implicated in altered drug metabolism and is found predominantly in Caucasians with an allele frequency of 0.1 to 0.16, meaning that up to 30% of the Caucasian population have at least one *3 allele. People of African descent have a *3 allele frequency of ∼0.02, whereas this allele seems to be absent from the Japanese population (Dai et al., 2001; Bahadur et al., 2002; Nakajima et al., 2003; Yasar et al., 2003). The *2 allele is found primarily in individuals of African origin (allele frequency 0.18) (Dai et al., 2001). The implications of the *4 allele are not yet known (Bahadur et al., 2002). The *5 allele has been found in low frequency in the Japanese population (∼0.0025) and is expected to result in an inactive enzyme due to loss of two-thirds of its protein structure (Soyama et al., 2001; Nakajima et al., 2003). The small numbers of subject in these studies render it difficult to be definitive about true population frequencies. However, the high prevalence of the *2 and *3 alleles in certain populations could argue for prospective genotyping, if these variants were associated with important effects on drug response.
The impact of CYP2C8 variants in vivo has been explored directly for only a few drugs, and data are currently inadequate to determine clinical relevance. Many of the substrate drugs, e.g., gallopamil (Suzuki et al., 1999) and propofol (Guitton et al., 1998), have multiple other routes of elimination and are unlikely to be significantly affected. For drugs that are more reliant on CYP2C8 (e.g., paclitaxel, rosiglitazone, and repaglinide), it is tempting to speculate on the potential effect of CYP2C8 variants from in vivo pharmacokinetic interaction studies involving the strong CYP2C8 inhibitor, gemfibrozil (Wang et al., 2002). This is an example of phenocopying and is analogous to using quinidine to convert EMs of CYP2D6 to PMs. However, as demonstrated with repaglinide (below) available data on known CYP2C8 variants have not been convincing.
a. Paclitaxel.
CYP2C8 catalyzes the conversion of paclitaxel to its major metabolite, 6α-hydroxypaclitaxel (Rahman et al., 1994) whereas CYP3A4 mediates the production of other metabolites (Sonnichsen et al., 1995). The metabolism of paclitaxel to 6α-hydroxypaclitaxel, which is essentially inactive (Harris et al., 1994), has been used as an index of CYP2C8 activity in vitro. Several studies suggest that reduced paclitaxel metabolism may occur with the CYP2C8*2 and *3 alleles, with the latter producing the greatest reduction (Dai et al., 2001; Soyama et al., 2001; Bahadur et al., 2002). However, reports are inconsistent about the extent of the effect of CYP2C8*3, which could be relatively minor (activity reduced to ∼75%) or substantial (activity of ∼15%) compared with the wild type (Dai et al., 2001; Soyama et al., 2001; Bahadur et al., 2002). One unpublished in vivo study found no relationship between CYP2C8 and paclitaxel pharmacokinetics or pharmacodynamics in Japanese patients with ovarian cancer (further details unavailable) (Nakajima and Yukoi, 2005), which may be due to the low allelic frequency of CYP2C8*5 (0.0025) in their population (Nakajima et al., 2003). It remains to be seen whether the CYP2C8 genotype helps with dosing in populations with higher frequencies of variant alleles (e.g., Caucasians).
b. Ibuprofen.
As outlined in section II.B., CYP2C8 is primarily responsible for the hydroxylation of R-ibuprofen and CYP2C9 for S-ibuprofen (Hamman et al., 1997). A large (n = 130) Spanish study, in which a single dose of 400 mg of racemic ibuprofen was administered, reported that the mean AUC was 2.2- and 8.7-fold higher in individuals with the CYP2C8*1/*3 or *3/*3 versus *1/*1 genotype (subjects with the CYP2C9*3 allele were excluded to give a clearer picture of the impact of CYP2C8 variants) (Garcia-Martin et al., 2004). In individuals with the CYP2C8*1/*1 genotype, the AUCs of the racemate were 1.8- and 2.7-fold higher in those with CYP2C9*1/*3 and CYP2C9*3/*3, respectively. Eleven of 12 individuals with clearance below the 10th percentile were homozygous for the CYP2C8*3 or CYP2C9*3 allele or were double heterozygotes for both alleles. Of the 76 individuals who did not have CYP2C8*3 and CYP2C9*3, none had clearance below the 10th percentile. CYP2C9*2 was associated with altered ibuprofen pharmacokinetics only when it was coinherited with CYP2C8*3 (linkage disequilibrium exists). The estimates of those with the largest AUC need to be interpreted with some caution in light of the short blood-sampling period. For example, individuals with the CYP2C8*3/*3 genotype were estimated to have a half-life in excess of 4.7 days, which greatly exceeds the 12-h sampling period studied. Nevertheless, the data clearly show an important effect for both the CYP2C8*3 and the CYP2C9*3 alleles (Garcia-Martin et al., 2004). CYP2C8*3 and CYP2C9*3 are major contributors to the interindividual variability in plasma concentrations of ibuprofen. However, as yet there are no studies translating these pharmacokinetic differences to variation in analgesic/anti-inflammatory effects or toxicity.
c. Repaglinide.
In vitro data suggest that CYP2C8 and CYP3A4 are responsible for inactivating repaglinide, a nonsulfonylurea insulin secretagogue recommended for meal-time administration (Bidstrup et al., 2003). Interaction studies suggest that CYP2C8 is the dominant enzyme. CYP3A4 inhibitors such as ketoconazole and clarithromycin increase repaglinide concentrations by small amounts (15 and 40%, respectively) (Niemi et al., 2001; Hatorp et al., 2003) compared with the 5.5- to 15.5-fold increase with the CYP2C8 inhibitor, gemfibrozil (Niemi et al., 2003b). In addition, there are isolated reports of severe hypoglycemia when gemfibrozil is administered with repaglinide (http://www.hc-sc.gc.ca/hpfb-dgpsa/tpd-dpt/repaglinide_prof_e.html). However, two published studies by the same authors showed that individuals with the CYP2C8*1/*3 genotype had concentrations that were ∼50 to 60% lower than those of the wild type (Niemi et al., 2003c,, 2005). The reason for the opposing findings in the interaction versus genetic studies is not clear. However, other mechanisms are likely to be involved in the gemfibrozil-repaglinide interaction, such as inhibition of the organic anion-transporting polypeptide 1B1 (OATP1B1), which is thought to mediate the uptake of repaglinide into the liver (Shitara et al., 2004). Indeed, variation in the gene that encodes OATP1B1 (SLCO1B1) may influence the repaglinide AUC, with a 2.9-fold higher AUC in those with the 521CC versus 521TT (reference) genotype (Niemi et al., 2005). Overall, the data show that CYP2C8 is involved in the metabolism of repaglinide and that although drug interactions mediated through this enzyme may be of clinical importance, further study is needed with respect to the inherited CYP2C8 variants.
d. Thiazolidinediones.
Rosiglitazone and pioglitazone improve insulin sensitivity and are widely used to treat type 2 diabetes mellitus (Diamant and Heine, 2003). Both compounds are extensively metabolized by CYP2C8, and to lesser extent by CYP2C9 (rosiglitazone) and CYP3A4 (pioglitazone) (Baldwin et al., 1999; Kortboyer and Eckland, 1999; Jaakkola et al., 2004). Rosiglitazone has some active metabolites, but these are not expected to have an important impact on the effects of this drug (Cox et al., 2000). In contrast, at least one active metabolite of pioglitazone (1-hydroxyethylpioglitazone) is present in sufficient concentrations to influence efficacy (Actos data sheet; http://www.fda.gov/cder/foi/label/2004/21073s024lbl.pdf). There seems to be no published studies that investigate the impact of CYP2C8 variants on pioglitazone. A single-dose study identified no difference in rosiglitazone AUC between wild-type individuals and those heterozygous for various CYP2C8 alleles (*2, *3, and *4), whereas the sole subject homozygous for CYP2C8*3 had the second lowest AUC (Hruska et al., 2005). Gemfibrozil increases the AUCs of rosiglitazone and pioglitazone by ∼2.3-fold (Niemi et al., 2003a) and 3.1-fold (Jaakkola et al., 2004), respectively, which might suggest some clinical importance of CYP2C8 variants.
e. Cerivastatin.
This drug is metabolized by CYP2C8 and CYP3A4 to two metabolites (M-1 and M-23), which are both metabolized to another metabolite (M-24), all of which contribute to the anticholesterol effects (Muck, 2000; Wang et al., 2002). Cerivastatin was withdrawn in 2001 because of an unacceptably high rate of rhabdomyolysis. More than one-third of the deaths (12 of 31) reported to the U.S. FDA were in individuals who took gemfibrozil concurrently (http://www.fda.gov/bbs/topics/ANSWERS/2001/ANS01095.html), which is known to inhibit cerivastatin metabolism (Wang et al., 2002). Individuals with variants in the CYP2C8 gene may have been predisposed to this side effect. However, this theory is hypothetical, and there seems to be only one case report of rhabdomyolysis in association with CYP2C8 variants (CYP2C8*5/*5) (Ishikawa et al., 2004).
f. Summary.
Few studies have addressed the issue of CYP2C8 variants and drug responses. This presumably relates to the only recent recognition of its role in drug metabolism, the low frequency of CYP2C8 variants in many populations, and the lack of a suitable in vivo probe. Drugs that rely on CYP2C8 for a large proportion of their elimination (e.g., paclitaxel and repaglinide) are most likely to be affected by CYP2C8 variants. However, the lack of studies and the observed discrepancy in different types of studies with repaglinide (interaction versus CYP2C8 variant) indicate that it is premature to speculate on the impact of CYP2C8 clinically.
3. CYP3A5.
The CYP3A locus comprises four genes that code for the functional enzymes CYP3A4, CYP3A5, CYP3A7, and CYP3A43 (Ingelman-Sundberg et al., 2005). The latter two enzymes will not be discussed here as they are primarily fetal (CYP3A7) or minimally expressed with low functional activity (CYP3A43) (Burk and Wojnowski, 2004). In contrast, CYP3A4 and 3A5 metabolize a broad range of structurally diverse therapeutic compounds, including calcium channel blockers, benzodiazepines, and calcineurin inhibitors. They are often considered collectively as “CYP3A” because of their promiscuous substrate specificity and the difficulty discerning the relative role of each isoform in drug metabolism. The overall activity of CYP3A is unimodally distributed, exhibits wide intersubject variability (>10-fold), and is highly susceptible to the effects of enzyme inhibitors and inducers (Lin et al., 2001). The latter effect is demonstrated by the enormous 400-fold higher AUC of midazolam after oral dosing, when coadministered with itraconazole (inhibitor) versus rifampicin (inducer) (Backman et al., 1998).
Many single nucleotide polymorphisms have been identified in the CYP3A4 and CYP3A5 genes, although available data do not support a clinically important effect on drug metabolism. A possible exception is a single point mutation (6986A>G) in intron 3 of CYP3A5 (designated CYP3A5*3) that produces a truncated and non-functional protein. In contrast to the unimodal distribution of CYP3A taken as a whole, CYP3A5 exhibits a bimodal distribution that can be predicted by the presence or absence of this allele. Individuals homozygous for CYP3A5*3 produce little CYP3A5 enzyme (“low expressors”), whereas the remainder have at least one wild-type (CYP3A5*1) allele and express a large amount of CYP3A5 (“high expressors”) (Kuehl et al., 2001). It is estimated that 10 to 20% of Caucasians, 40 to 50% of East Asians, 60 to 70% of Hispanics, and >80% of African-Americans will be high expressors of CYP3A5 (Xie et al., 2004). In high expressors, the percentage of total CYP3A protein derived from CYP3A5 has been estimated to be >50% (Kuehl et al., 2001; Lin et al., 2002). However, later work demonstrated that it may comprise <2% of the overall CYP3A pool (Westlind-Johnsson et al., 2003). The reasons for the discrepancies may reflect methodological issues, but it seems likely that the contribution of CYP3A5 is minimal in many individuals. The following discussion on individual drugs focuses more on the pharmacokinetic differences seen in expressors (carriers of at least one CYP3A5*1 allele) compared with nonexpressors (homozygotes for CYP3A5*3) who are the minority group in Caucasians.
a. Midazolam.
Midazolam is probably the most widely used probe for CYP3A. In vitro studies reported enhanced clearance of midazolam in carriers of CYP3A5*1 (i.e., expressors) versus those homozygous for CYP3A5*3 (i.e., nonexpressors) (Kuehl et al., 2001; Lin et al., 2002). This result is supported by two studies in patients with cancer that showed 1.3- or 1.7-fold (mean) higher midazolam clearance in those with at least one CYP3A5*1 allele (Goh et al., 2002; Wong et al., 2004). Other in vivo studies in healthy subjects did not demonstrate a significant difference between genotype groups (Shih and Huang, 2002; Floyd et al., 2003; Eap et al., 2004; Yu et al., 2004). Whereas some of the studies that failed to detect a difference may have suffered from inadequate power, any minor change in midazolam pharmacokinetics caused by variants in CYP3A5 is not likely to be important in the clinic.
b. Calcineurin inhibitors.
Tacrolimus does seem to have variable pharmacokinetics with the CYP3A5 genotype. For solid organ transplantation, studies consistently show that individuals homozygous for CYP3A5*3 achieve greater dose-adjusted tacrolimus concentrations (usually >2-fold) than carriers of at least the CYP3A5*1 allele (Hesselink et al., 2003; Thervet et al., 2003; Zheng et al., 2003, 2004, 2005a; Tsuchiya et al., 2004b; MacPhee et al., 2005). Furthermore, tacrolimus trough concentrations in living donor liver transplant recipients are influenced by the CYP3A5 genotype of the graft, with CYP3A5*1/*1 being linked to lower dose-normalized tacrolimus concentrations 3 weeks after transplantation (Goto et al., 2004). Overall, these findings suggest that individuals homozygous for CYP3A5*3 require lower doses to achieve a target concentration than individuals carrying the CYP3A5*1 allele. However, considerable variability exists in the dose-adjusted concentrations of tacrolimus achieved, particularly among those with the CYP3A5*3/*3 genotype, and overlap also exists between the genotype groups. Furthermore, data correlating the CYP3A5 genotype with clinical endpoints (e.g., rejection episodes) are lacking. Overall, the preliminary pharmacokinetic data suggest that genotyping may prove to be a useful adjunct to, but not a replacement for, therapeutic drug monitoring. Tacrolimus scored “unlikely” with the algorithm (Table 2), reflecting the indaequate evidence base at present. In contrast to the findings for tacrolimus, most studies do not support a relationship between the CYP3A5 genotype and cyclosporin disposition, dose requirements, or long-term graft survival in renal transplant recipients (Hesselink et al., 2003; Anglicheau et al., 2004; Kreutz et al., 2004).
c. 3-Hydroxy-3-methylglutaryl-CoA reductase inhibitors.
Atorvastatin, lovastatin, and simvastatin are metabolized by CYP3A, with preliminary data suggesting an association between the CYP3A5 genotype and outcomes with these drugs. In one study, the change in total and low-density lipoprotein cholesterol concentrations after 1 year of treatment with these statins was ∼25% greater in individuals with the CYP3A5*1 allele (expressors), compared with homozygotes for CYP3A5*3 (non-expressors). Such findings were not observed in individuals receiving pravastatin or fluvastatin, which are less dependent on CYP3A (Kivisto et al., 2004). In another study, the frequency of CYP3A5*3 was comparable in individuals who did and those who did not develop increased serum creatine kinase with myalgia during treatment with atorvastatin. However, for individuals who did develop myalgia and were not taking additional lipid-lowering drugs, the degree of creatine kinase elevation was greatest in those with the CYP3A5*3/*3 genotype (Wilke et al., 2005). Together these studies suggest that the CYP3A5*3/*3 genotype may cause increased exposure to CYP3A metabolized statins, although pharmacokinetic studies are required to confirm this theory. Overall, it seems unlikely that CYP3A5 genotyping in relation to these drugs will occur in clinical practice as the gene-effect relationship seems minor and they are primarily dosed to clinical effect.
d. Protease inhibitors.
The pharmacokinetics of some antiretroviral drugs vary in relation to CYP3A5 genotype. Data from an abstract suggest that the apparent oral clearance of indinavir is ∼50% greater in homozygotes and heterozygotes for CYP3A5*1 (expressors) than for homozygotes for CYP3A5*3 (Anderson et al., 2004). In another study, CYP3A5 polymorphism was not related to saquinavir pharmacokinetics, although the 24-h urinary ratio of saquinavir to its hydroxy metabolites (M2 and M3) was reduced in individuals heterozygous for CYP3A5*1, suggesting a possible role for CYP3A5 in the metabolism of this drug (Frohlich et al., 2004).
e. Summary.
Evidence to date is not particularly impressive with respect to the ability of the CYP3A5 genotype to predict outcomes with drugs, with no drug reaching a score of “possible” in the algorithm. The strongest case is for tacrolimus, for which lower dose-adjusted concentrations have been consistently observed among those with the CYP3A5*1 allele. The clinical utilization of CYP3A5 genotyping with respect to this drug is likely to be limited by the considerable interpatient variability within each genotype group and the routine use of tacrolimus concentration monitoring in clinical practice.
III. Other Important or Potentially Important Enzymes
A. Acetyltransferase
Interindividual variation in acetylation capacity was identified in the 1950s, soon after isoniazid appeared on the market. Isoniazid was an effective treatment for tuberculosis, but peripheral neuropathy proved to be a significant clinical problem. Individuals at greatest risk excreted more isoniazid unchanged in the urine together with a reduced amount of acetylisoniazid (Hughes et al., 1954). Subsequent studies demonstrated that isoniazid plasma concentrations exhibited a bimodal distribution that was inherited (Price Evans et al., 1960).
The enzyme responsible for isoniazid acetylation is N-acetyltransferase type 2 (NAT2), and the related gene is NAT2. NAT2 acetylates a number of other therapeutic compounds, including hydralazine, procainamide, dapsone, and some sulfonamide derivatives. Studies have confirmed that NAT2 is trimodally distributed (Parkin et al., 1997), although many people continue to refer to two phenotypes, i.e., “slow” and “fast” acetylators. The proportion of slow acetylators varies with race and is ∼10% in Japanese, 20% in Chinese, and 40 to 70% in African-American and Caucasian populations (Ellard, 1976).
A number of compounds have been used as a probe for NAT2, and a good genotype-phenotype correlation is generally observed (>90% with caffeine as a probe) (Graf et al., 1992; Cascorbi et al., 1995; Gross et al., 1999). More than 35 variant alleles have been identified in the NAT2 gene, and these comprise one to four nucleotide substitutions (http://www.louisville.edu/medschool/pharmacology/NAT.html). Three substitutions (C481T, G590A, and G857A) account for most nucleotide changes in Caucasians and Asians and result in a slow phenotype (Lin et al., 1993). Individuals phenotyped as slow acetylators are likely to have two slow activity alleles, whereas those phenotyped as fast acetylators could have one or two high-activity alleles (most likely to be NAT2*4, which is considered to be the wild type). In Caucasians, most of the fast acetylators are heterozygotes for slow and fast alleles, whereas individuals homozygous for fast alleles (e.g., NAT2*4/*4) comprise ∼5% of the population (Cascorbi et al., 1995; Gross et al., 1999). In contrast, ∼30% of Chinese individuals are homozygous for rapid alleles, 45% are heterozygotes, and 25% are homozygotes for slow alleles (Xie et al., 1997).
1. Isoniazid.
Acetylation to acetylisoniazid (Ellard and Gammon, 1976) terminates the antimycobacterial effects but may lead to metabolites that contribute to toxicity (see below). The AUC and half-life of isoniazid are ∼2-fold greater in phenotypic slow versus rapid acetylators (Tiitinen, 1969; Anonymous, 1973). In genotypic slow and intermediate acetylators, AUCs was 6.1- and 2.6-fold higher, respectively, than in rapid acetylators. However, the sampling period of only 6 h may have reduced the accuracy of the AUC estimate, especially in slow acetylators (half-life 2-4.5 h) (Tiitinen, 1969; Parkin et al., 1997). A recent single-dose genotype study reported a 2.6-fold higher median AUC with 24 h sampling in homozygotes for slow-activity alleles and 1.4-fold higher AUC for heterozygotes compared with homozygotes for fast alleles (true rapid acetylators) (Kinzig-Schippers et al., 2005). It could be expected, based on these pharmacokinetic differences, that fast acetylators might experience more treatment failures than slow acetylators because of rapid elimination of isoniazid.
The evidence related to this difference is mixed. There does not seem to be any difference between groups with modern multidrug regimens when isoniazid is administered daily or two to three times per week. There is, however, a reasonable body of evidence to indicate that rapid acetylators have more treatment failures and relapses with once weekly isoniazid-based treatment (Anonymous, 1970, 1973, 1977; Ellard, 1976; Weiner et al., 2003). This finding has some clinical relevance as weekly dosing has the advantage, for both the administrator and patient, of directly observed therapy. Knowledge of acetylator status could be helpful, especially in populations dominated by slow acetylators who could be successfully treated with once weekly therapy (Ellard, 1976).
In fast acetylators the situation is more complex. Increasing the magnitude of the dose administered to these patients is too simplistic a plan as the duration of drug exposure with “safe” doses remains inadequate. Interestingly, U.S. guidelines recommend that once weekly isoniazid regimens are only considered for highly selected patient groups (e.g., HIV-negative, no cavitation on initial chest radiograph, and negative sputum smears at 2 months), with no consideration made for acetylator status (Anonymous, 2003). Recently, a modification to the recommended adult daily dose of 5 mg/kg (maximum 300 mg) was suggested on the basis of concentrations achieved with different NAT2 genotypes. Doses of 2.5, 5.0, and 7.5 mg/kg were suggested as possibly appropriate for those with no, one, or two rapid alleles, respectively. Prospective clinical studies could help assess the effectiveness of these dose adjustments (Kinzig-Schippers et al., 2005).
Two main side effects of isoniazid have been associated with acetylator status: peripheral neuropathy and hepatotoxicity. Peripheral neuropathy is a dose-dependent side effect and occurs more commonly in malnourished slow versus fast acetylators (20 versus 3%, respectively) receiving doses of 7.8 to 9.6 mg/kg/day (Devadatta et al., 1960). With current regimens (∼5 mg/kg/day), it seems that the overall frequency of peripheral neuropathy may be as low as 0.2% (Ormerod and Horsfield, 1996; Anonymous, 2003), which may reflect the low dose per se and/or coadministration with pyridoxine. In one study, 10 (63%) of 16 patients with neuropathy receiving isoniazid 5 mg/kg/day were slow acetylators, which was only marginally more than the proportion of slow acetylators in their control population (∼54%) (Goel et al., 1992). Given the low frequency of the neuropathy and the high prevalence of slow acetylator status, there seems to be little merit in ascertaining acetylator status before therapy to avoid this toxicity. The long history of nonuse of acetylator status testing (phenotype) before initiation of isoniazid supports the lack of clinical reality for this testing.
Subclinical alterations in liver function tests occur in 10 to 20% of patients during isoniazid treatment, with clinically apparent hepatitis occurring in 0.1% and 1% of patients undergoing preventative therapy and multidrug treatment for active disease, respectively (Nolan et al., 1999). The risk is increased with concurrent use of enzyme inducers (rifampicin or alcohol) and with underlying liver disease (Anonymous, 2003). Data are mixed with regard to whether slow acetylators (Gronhagen-Riska et al., 1978; Parthasarathy et al., 1986; Pande et al., 1996) or fast acetylators (Mitchell et al., 1975; Yamamoto et al., 1986) are predisposed to hepatotoxicity. The main hypothesis is that slow acetylators may be more susceptible as a result of elevated concentrations of hepatotoxic intermediates from acetylhydrazine, a metabolite of acetylisoniazid. Slow acetylators have reduced ability to metabolize acetylhydrazine by NAT2 to diacetylhydrazine (nontoxic), and consequently are thought to get a build up of the toxic intermediates (Ellard and Gammon, 1976; Timbrell et al., 1977; Lauterburg et al., 1985). Elevation of these same intermediates is thought to be the mechanism for the increased hepatotoxicity of isoniazid with alcohol and rifampicin, as a result of induction (Parthasarathy et al., 1986).
Recently, hepatitis with antituberculosis drugs (most likely related to isoniazid) was reported to occur more than twice as often and more severely in Taiwanese patients with two NAT2 variants than in those with at least one high-activity allele (Huang et al., 2002). An earlier study reported that the relative risk for drug-induced liver injury among Japanese patients treated with isoniazid and rifampicin was 4.0 for intermediate acetylators and 28.0 for slow acetylators (Ohno et al., 2000). In this study, a high rate of liver injury was reported (18%), presumably due to the low threshold for defining hepatotoxicity (aminotransferases >2 times baseline and >1.5 times the upper limit of normal). It is not clear how many would have progressed to clinically apparent hepatic disease if the drugs had not been ceased. As an aside, the maximal isoniazid dose usually used in adult Japanese patients is 400 mg daily, compared with 300 mg daily in Caucasians (Ohno et al., 2000), probably reflecting the higher proportion of rapid acetylators in the Japanese population.
It seems that knowledge of acetylator status is unlikely to assist for predicting outcomes with isoniazid in clinical practice, except perhaps when once weekly dosing is proposed. The relationship between acetylator status and hepatotoxicity with isoniazid remains unclear, although overall the data suggest that slow acetylators may be at increased risk. However, because the occurrence of significant liver injury is relatively uncommon even among slow acetylators, there is little advantage to be gained from genotyping.
2. Hydralazine.
In fast acetylators, the oral availability of hydralazine is 7 to 16%, reflecting presystemic metabolism by NAT2. Slow acetylators have higher oral availability (30-40%), and hydralazine pyruvic acid hydrazone is the main plasma metabolite, resulting from reaction with pyruvic acid in plasma (Reece et al., 1980; Shepherd et al., 1980). The AUC of hydralazine is ∼3-fold higher in slow acetylators, and this may increase to 6- to 7-fold higher with multiple dosing (Reece et al., 1980; Shepherd et al., 1980). With intravenous administration, presystemic metabolism is bypassed, and hydralazine pyruvic acid hydrazone is the major plasma metabolite in both acetylator groups. Acetylator status does not predict hydralazine concentrations with this route (Reece et al., 1980), so the genetic effects are relevant to oral use only.
Some evidence suggests that rapid acetylators may have a reduced therapeutic effect (Zacest and Koch-Weser, 1972; Jounela et al., 1975; Koopmans et al., 1984; Ramsay et al., 1984). For example, hypertensive patients given oxprenolol 60 mg daily with hydralazine titrated to a maximum of 150 mg daily had a significantly greater blood pressure reduction if they were slow acetylators (mean 33/23 versus 22/15 mm Hg in fast acetylators). Furthermore, this was produced with a lower mean dose of hydralazine (1.3 versus 1.6 mg/kg in rapid acetylators) (Jounela et al., 1975). Consistent with these findings, the dose required for “satisfactory” blood pressure control was 60% higher in fast versus slow acetylators who previously had inadequate control with a diuretic and β-blocker (3.7 versus 2.4 mg/kg/day) (Zacest and Koch-Weser, 1972). In another study, 81% of rapid acetylators required the maximum dose used in the study (200 mg/day) compared with 38% of slow acetylators, yet blood pressure was controlled in a smaller proportion of fast versus slow acetylators (27 versus 65%, respectively) (Ramsay et al., 1984). In contrast, other studies have not demonstrated a significant effect of acetylator status on hypertensive response (Hunyor, 1975; Vandenburg et al., 1982), which may reflect the different methodologies used in the studies.
The most significant toxicity of hydralazine is a lupuslike reaction, and a reasonable body of evidence indicates that this almost always occurs in slow acetylators (Perry et al., 1970; Perry, 1973; Strandberg et al., 1976). In one report, 29 of 31 patients with this side effect were slow acetylators, with one of the remaining two patients having an “uncertain” phenotype. The last patient (a rapid acetylator) was the only individual who did not improve after cessation of hydralazine and was suspected of having spontaneous lupus (Strandberg et al., 1976). In another study, 44 of 371 patients developed lupus-like reactions or rheumatoid arthritis after treatment with hydralazine 100 to 1600 mg/day for a mean of 17 months. Of these, 24 (96%) of the 25 individuals who had acetylator status determined were found to be slow acetylators (expected ∼50%) (Perry, 1973). Other side effects such as flushing and headache might also occur more frequently in slow acetylators with oral hydralazine (Vandenburg et al., 1982) although this theory has not been confirmed in all studies (Ramsay et al., 1984).
Thus, the evidence for hydralazine is suggestive, although not definitive, of a gene-effect relationship for efficacy, but compelling for the lupus reaction. However, the value in predicting lupus-like reactions is limited given that lupus occurs relatively uncommonly (3-4%) (Ramsay et al., 1984), despite the high prevalence of slow acetylator status. Perhaps a possible role of acetylation status in relation to hydralazine would be to allow safe escalation of hydralazine doses beyond 200 mg daily in fast acetylators, as previous authors suggest (Ramsay et al., 1984). Hydralazine currently does not have much long-term clinical usage, probably as a result of the lupus-like reaction. It is possible that prospective genotyping might enable hydralazine to continue to have a small but useful role in current therapeutics.
3. Procainamide.
Approximately 25 to 33% of a procainamide dose is metabolized by NAT2 to N-acetylprocainamide (active) in fast acetylators with normal renal function (Dutcher et al., 1977; Lima et al., 1979). The kidneys eliminate ∼50% of procainamide, and 85% of N-acetylprocainamide (Lima et al., 1979). As both compounds are active, an important change in antiarrhythmic effects is unlikely to occur in relation to metabolizer status. However, most patients taking procainamide develop antinuclear antibodies, with 10 to 20% developing lupus-like reactions (Tan and Rubin, 1984; Jiang et al., 1994; Mongey et al., 1999). Slow acetylators have been reported to develop antinuclear antibodies more rapidly than fast acetylators and after a lower dose (Woosley et al., 1978). Furthermore, lupus-like reactions occurred after a mean of 12 months of treatment in slow acetylators, compared with 48 months in fast acetylators (Woosley et al., 1978). In one study, 80% of patients receiving procainamide had antinuclear antibodies after 6 to 12 months of treatment, compared with 17% of those receiving acetylprocainamide (Lahita et al., 1979). The concentration-dependent nature of this reaction is supported by a study in which fast acetylators developed lupus-like reactions as rapidly as slow acetylators when the mean daily dose (3.6 versus 3.2g, respectively) was adjusted to maintain comparable procainamide concentrations (Sonnhag et al., 1979). Collectively, these data suggest that the parent drug and not the metabolite is implicated in the lupus-like reactions (Drayer and Reidenberg, 1977).
A more recent study used genotyping rather than phenotyping and reported that seven (78%) of nine patients with procainamide-induced lupus were fast acetylators. However, four of the patients with the lupus were identified from a group of patients who had already received procainamide for a mean of 40 months at the time of study entry. Consequently, patients who discontinued the study earlier because of this side effect may have been excluded. The remaining five patients were referred to the drug as a result of their procainamide-induced lupus reaction which occurred after a mean of 15 months (range 3-48 months) of procainamide treatment (Mongey et al., 1999). Although the last study casts some doubt on the relationship between acetylator status and lupus-like reactions to procainamide, most of the evidence supports slow acetylator status as a risk factor. As a result of the lupus reaction, procainamide is little used clinically.
4. Sulfonamide Antibiotics.
Hypersensitivity reactions to sulfonamides affect ∼3% of the population and may be severe (Koch-Weser et al., 1971; Bigby et al., 1986). Almost all of these reactions seem to occur in individuals who are slow acetylators (Shear et al., 1986; Rieder et al., 1991; Wolkenstein et al., 1995), who presumably divert more drug to reactive hydroxylamine or nitroso metabolites by cytochrome P450 enzymes. Individuals infected with HIV are particularly vulnerable to these reactions, which occur in at least one-third of patients (>10-fold the number expected in the general population) (Jaffe et al., 1983; Gordin et al., 1984; Wolkenstein et al., 2000). Some (Carr et al., 1994; Kaufmann et al., 1996) but not all studies (Delomenie et al., 1994; Pirmohamed et al., 2000; Wolkenstein et al., 2000) in HIV-infected patients report slow acetylation as a risk factor for hypersensitivity reactions. There is little clinical value in knowing an individual's acetylator status before commencing treatment with sulfonamides since the frequency of hypersensitivity reactions is small relative to that of slow acetylator status. Furthermore, genotype may not predict phenotype very accurately especially in the presence of severe underlying disease such as HIV infection (Wolkenstein et al., 2000; O'Neil et al., 2002).
5. Sulfasalazine.
This drug is composed of 5-aminosalicyclic acid and sulfapyridine joined via an azo bond. A small proportion of sulfasalazine is absorbed in the small intestine, but most is delivered to the large intestine where colonic bacteria cleave the azo bond liberating both compounds. 5-Aminosalicyclic acid has poor systemic availability and is active locally in inflammatory bowel disease. Sulfapyridine is essentially completely absorbed and is responsible for the antirheumatic effects of this drug. NAT2 acetylates sulfapyridine (Das and Eastwood, 1975) with average plasma concentrations ∼2-fold higher and half-life ∼3-fold longer in slow acetylators (with considerable overlap) (Schroder and Price Evans, 1972; Azad Khan et al., 1983). Thus, it could be anticipated that the efficacy of this drug in rheumatoid arthritis would vary with acetylator status. One study supports this supposition (Kumagai et al., 2004), whereas others do not (Azad Khan et al., 1980; Pullar et al., 1985; Bax et al., 1986; Kitas et al., 1992; Ricart et al., 2002). Slow acetylator status does seem to increase the risk of side effects (Schroder and Price Evans, 1972; Azad Khan et al., 1980; Pullar et al., 1985; Rahav et al., 1990; Laversuch et al., 1995; Gunnarsson et al., 1997; Tanaka et al., 2002; Ohtani et al., 2003), although this risk has not been observed in all studies (Chalmers et al., 1990; Kitas et al., 1992; Wadelius et al., 2000; Ricart et al., 2002; Kumagai et al., 2004). It is reasonable to expect that slow acetylators might experience more problems with sulfasalazine given that a number of the side effects (e.g., nausea and vomiting) are associated with elevated sulfapyridine concentrations (Das et al., 1973; Rahav et al., 1990). In one study, 16 of 21 (76%) individuals who developed side effects were slow acetylators compared with 17 of 35 (49%) who did not. Nausea, malaise, and headache occurred almost exclusively among slow acetylators (Azad Khan et al., 1980, 1983). In another study, 24 of 28 (86%) patients with side effects (e.g., cyanosis, frank hemolysis, and reticulocytosis) were slow acetylators, compared with two-thirds of all 133 patients studied (Das et al., 1973). A study of high-dose sulfasalazine (4.5-6 g daily) showed that 18 (95%) of 19 individuals with hemolysis were slow acetylators compared with 6 (35%) of 17 patients without hemolysis (van Hees et al., 1978). All 11 patients with sulfasalazine-associated lupus were slow acetylators (∼50% expected) (Gunnarsson et al., 1997). These findings could suggest that knowledge of acetylator status would help identify individuals who were more susceptible to side effects. However, a number of the side effects are minimized by commencing treatment with a low dose and by titrating to effect and using relatively low maintenance doses (e.g., 2-3 g daily) (Anonymous, 2002). The accelerating use of other agents (e.g., mesalazine in inflammatory bowel disease) and the paucity of pretreatment genotyping/phenotyping in relation to sulfasalazine usage over the years suggest that pretesting is unlikely to occur in clinical practice.
6. Dapsone.
This drug is extensively metabolized, with <20% eliminated unchanged renally. The two established metabolic routes are acetylation to monoacetyldapsone (reversible) and hydroxylation by P450 enzymes to dapsone hydroxylamine (May et al., 1990). Acetylation is a minor contributor to the overall elimination of dapsone, and thus acetylator status does not influence the efficacy of this drug (Venkatesan, 1989; Le Louet et al., 1999). Production of dapsone hydroxylamine is thought to be responsible for the hematological toxicity (especially methemoglobinemia) of dapsone (Israili et al., 1973; Coleman et al., 1989; Gill et al., 1995). A recent study reported more severe adverse reactions (anemia or neurotoxicity) in individuals who were both slow acetylators and rapid hydroxylators (Bluhm et al., 1999), presumably because more dapsone is metabolized via the detrimental hydroxylamine pathway rather than by acetylation. Overall, it seems unlikely that knowledge of acetylator status will assist with dosing of this drug.
7. Phenelzine.
This drug is a hydrazine derivative that was expected to undergo acetylation by NAT2. Several studies have shown improved antidepressant response in slow acetylators (Johnstone and Marsh, 1973; Johnstone, 1976; Paykel et al., 1982), whereas others have not (Davidson et al., 1978; Marshall et al., 1978; Yates and Loudon, 1979; Tyrer et al., 1980). It was subsequently shown that up 80% of phenelzine is eliminated as the nonacetylated products, phenylacetic acid and parahydroxyphenylacetic acid (Robinson et al., 1985). Consequently, genotyping or phenotyping for NAT2 is unlikely to assist in the therapeutic effects of phenelzine.
8. Summary.
Acetylator status seems to be more important for adverse effects than for efficacy (although efficacy may be important for hydralazine), with lupuslike reactions and hypersensitivity reactions occurring more commonly in slow acetylators. Clinical uptake of tests for acetylator status remains low (Gardiner and Begg, 2005) despite long experience and established knowledge. The strongest case for prospective genotyping is for hydralazine, although it was only a “possible” in the algorithm. For isoniazid, the increased toxicity in slow acetylators and reduced efficacy in fast acetylators has been largely avoided through use of lower daily doses along with pyridoxine in high-risk groups and avoidance of once weekly regimens except in highly selected patients. Another possible explanation for the low utilization of predictive tests is that alternative agents might be used (e.g., angiotensin-converting enzyme inhibitors instead of hydralazine for heart failure or methotrexate instead of sulfasalazine for rheumatoid arthritis), particularly in developed countries where tests for acetylator status are more likely to be available. Furthermore, although it is recognized that hypersensitivity reactions to sulfonamides occur predominantly in slow acetylators, other factors are clearly involved, given the low rate of such reactions relative to the proportion of slow acetylators in many populations. Overall, there seems little likelihood that genotyping or phenotyping will become part of routine therapy for any of the drugs metabolized by NAT2. However, a case could be made for pretesting in some patients before the use of these drugs, if other agents have been tried unsuccessfully.
B. Butyrylcholinesterase
Deficiency in butyrylcholinesterase (pseudocholinesterase) is probably the example most widely recognized clinically of an inherited defect in drug metabolism that affects outcomes with drugs. The clinical relevance is primarily in anesthesia in which genetic butyrylcholinesterase (BChE) deficiency predisposes to marked prolongation of paralysis with two neuromuscular blockers, suxamethonium and mivacurium. The physiological function of BChE is not known. Only a few therapeutic compounds other than the neuromuscular blockers have some metabolism by BChE, including bambuterol (Tunek et al., 1988) and cocaine (Stewart et al., 1977). The clinical impact of deficiency on these drugs is less defined than that for the muscle relaxants.
BChE is synthesized in the liver under the control of the gene BCHE and is distributed to numerous body sites, including plasma (Kalow and Grant, 2001). Its presence in plasma means that, along with thiopurine methyltransferase and dihydropyrimidine dehydrogenase (see below), it can be phenotyped via a single blood test without the need for probe drug administration (as is done with cytochrome P450 enzymes). Traditionally, inherited BChE deficiency is investigated by assay for plasma BChE enzyme activity and by inhibition studies (phenotyping tests or “biochemical genotyping”). The inhibition studies use compounds such as dibucaine and fluoride to identify the type and/or quantity of enzyme protein present and therefore to imply a genotype. Among Caucasians, 96% are homozygous for the most common (usual) BCHE allele (UU) and produce normal amounts of active enzyme. The remaining 4% have at least one abnormal allele that causes production of an enzyme with either altered affinity [atypical (A), fluoride (F), and some silent (S) variants] or decreased quantity (e.g., K, J, and some S variants). Only a small proportion (1 in 3500 or ∼0.03%) have genotypes (AA, AK/AK, A/AK, SS, S/AK, and AS) that result in BChE activity that is low enough to prolong apnea meaningfully with the muscle relaxants (Kalow and Grant, 2001). Other genotypes (e.g., AF, AK/F, and SF) have modestly prolonged responses that will significantly increase the duration of action of the muscle relaxants only if acquired deficiency occurs concurrently [e.g., pregnancy (Blitt et al., 1977) or cardiopulmonary bypass (Rump et al., 1998)]. The heterozygous presence of an allele associated with reduced activity (e.g., UA and UK) rarely leads to important prolongation in effect.
Genotyping is increasingly performed and has replaced the traditional phenotyping tests in some centers (Gardiner and Begg, 2005). Screening for the five most common mutations (fluoride-1, fluoride-2, K variant, dibucaine, and silent-1) identifies 85% of individuals with a genetic basis for prolonged apnea with neuromuscular blockers (Yen et al., 2003). However, many mutations (>17) cause the silent phenotype (Kalow and Grant, 1995) (either no enzyme is produced or it is present in normal amounts but lacks activity), and complete nucleotide sequencing of the coding region would be required to identify all silent mutations. Clearly, time constraints and cost make this inappropriate for routine screening, although it could prove useful for equivocal results.
1. Suxamethonium and Mivacurium.
Suxamethonium is a depolarizing neuromuscular blocker with a unique combination of rapid onset (∼45 s) and short duration of action (2-6 min in most patients). Rapid hydrolysis by BChE in plasma means that only a small proportion of an intravenous dose reaches the neuromuscular end-plate (Bourne et al., 1952; Evans et al., 1952), and the effect of the BChE that does is terminated by diffusion away from the end-plate (Kalow and Grant, 2001). Since the 1950s, many reports have confirmed the link between inherited BChE deficiency and “scoline apnea”, in which paralysis persisted for 20 to 40 min, or more (Evans et al., 1952; Gould, 1952; Harper, 1952). In one series of 1247 patients, inhibition studies revealed a genetic cause in 47% of patients, whereas low activity of the usual enzyme due to other factors such as pregnancy was identified in ∼7% of patients. Most of the remaining patients (39%) did not have a clearly identifiable cause, largely because of equivocal “genotyping” (inhibition studies) (Jensen and Viby-Mogensen, 1995). In another study, 52 (80%) of 65 patients with a history of suxamethonium apnea had reduced BChE activity caused by variations in the BCHE gene (Yen et al., 2003).
Mivacurium is a nondepolarizing muscle relaxant that is metabolized by BChE and, under normal circumstances, has a relatively short duration of action (∼25 min). The duration of action exhibits a weak inverse relationship with BChE activity, at least in phenotypically normal subjects (Ostergaard et al., 2002). In BCHE genotypes associated with severe deficiency (e.g., AA and SS), paralysis lasts up to 6 to 8 h (Rosenberg and Lebenborn-Mansour, 1997; Gatke et al., 2001). Administration of a small (10% of normal) dose has also resulted in prolonged paralysis in an individual with the AA genotype (Vanlinthout et al., 1998) indicating that a test dose approach may not offer a suitable method of avoiding excessive dosing in deficient individuals.
The association between inherited BChE deficiency and prolonged paralysis with these neuromuscular blockers cannot be disputed. Currently, most tests related to these drugs are performed retrospectively in response to unexpectedly long paralysis. In these cases, measurement of BChE enzyme activity and either inhibition studies or genotyping would normally be undertaken. From a clinical perspective, there seems to be little justification for performing both phenotyping and genotyping tests, and choice may depend on local expertise and cost. From a scientific standpoint genotyping may offer an advantage, as phenotyping can give equivocal results. The rarity of scoline apnea suggests that there is little merit in prospective testing of all patients before drug use, aside from investigating family members of those with suspected or confirmed inherited deficiency. Prolonged paralysis is readily managed with continued anesthesia and mechanical ventilation (early fatalities resulted from desperate attempts to treat the paralysis before the understanding that a conservative approach was all that was necessary) (Kalow, 2004). Although formal analyses have not been undertaken, it is likely that the costs associated with managing prolonged apnea are considerably less than those associated with prospectively testing all patients. A crude estimate using data from our institution suggests that a 24-h intensive care admission would cost approximately $NZ2000 per patient. In contrast, it would cost approximately $NZ680,000 to screen 3500 patients (BChE activity, dibucaine, and fluoride numbers and six variants in the BCHE gene) to identify one individual who will probably have a prolonged response.
2. Procaine.
Procaine and related ester anesthetics (e.g., oxybuprocaine) are metabolized by BChE (Kalow, 1952; Dubbels and Schloot, 1983), with procaine being metabolized at a lower rate by the atypical versus the usual enzyme in vitro (Becker, 1973). There are isolated reports of augmented effect (high or prolonged block or seizures) with epidural 2-chloroprocaine in acquired (Monedero and Hess, 2001) or inherited (Kuhnert et al., 1982; Smith et al., 1987) deficiency. In addition, dental use of procaine has been associated with severe reactions (weakness, nausea, dyspnea, and unconsciousness due to hypoxia) in individuals homozygous for the atypical enzyme (Zsigmond and Eilderton, 1968). Little else is documented, which is perhaps not unexpected, given that the duration of action of this class is often dependent upon local blood flow (they are often coadministered with vasocontrictors) rather than metabolism.
3. Cocaine.
This naturally occurring alkaloid is highly addictive and abused extensively for its psychostimulant effects. It has limited clinical application beyond surgical procedures of the upper respiratory tract (e.g., nose) for which its anesthetic and vasoconstrictive properties are desirable. Although illicit use remains high, its therapeutic use is decreasing because of the occurrence of severe and unpredictable reactions such as myocardial infarction and stroke (Latorre and Klimek, 1999). In many instances, these reactions seem disproportionate to the magnitude of cocaine exposure, with 40% of deaths (6 of 15) occurring after an expected safe dose (< 200 mg) in one report (Johns and Henderson, 1976). This implies a lack of a conventional dose-response relationship and could implicate defective metabolism as a contributing factor.
Approximately 30 to 50% of cocaine is metabolized by BChE to an inactive metabolite, ecgonine methylester (methylecgonine) (Stewart et al., 1977, 1979; Inaba et al., 1978). Other metabolites, benzoylecgonine and norcocaine (both active) are produced via nonBChE-dependent mechanisms, although norcocaine is subsequently metabolized by BChE (Stewart et al., 1977,, 1979). Thus, BChE deficiency has the potential to increase exposure to cocaine and active metabolites, either by inhibiting their metabolism directly or by increasing the availability of cocaine for metabolism by alternate pathways.
A number of sources provide indirect evidence for a relationship between impaired BChE activity and increased exposure (and therefore toxicity) with cocaine. In vitro studies show that the atypical enzyme has reduced capacity (∼[1/10th]) to hydrolyze cocaine compared with the usual enzyme (Stewart et al., 1979; Xie et al., 1999). One study showed that plasma from individuals homozygous for the usual enzyme (UU) had ∼40% cocaine remaining in plasma after 2-h incubation, compared with 70 and 94% in those heterozygous or homozygous for the atypical enzyme, respectively (Jatlow et al., 1979). Illicit cocaine users with severe toxicity were found to have 15 to 25% lower mean BChE activity compared with nonusers or users without complications (Devenyi, 1989; Hoffman et al., 1992; Om et al., 1993). Addicts have deliberately inhibited BChE with organophosphate pesticides in an attempt to prolong the cocaine “high” (Herschman and Aaron, 1991). Furthermore, there is some evidence from in vitro and animal studies that administration of exogenous BChE may help in the management of cocaine toxicity and addiction (Browne et al., 1998; Carmona et al., 1998, 2000). It is plausible that inherited BChE deficiency may lead to accumulation of cocaine with repeated cocaine exposure. However, it is evident that susceptibility to toxicity with cocaine will depend on numerous other factors, including the route and dose administered (e.g., peak concentrations may be more relevant than the rate of elimination). It is intriguing to speculate on the possible role for prospective genotyping in relation to cocaine. Clearly, there is little role within conventional medicine.
4. Bambuterol.
This prodrug is hydrolyzed by BChE to the active β2-agonist, terbutaline (Tunek et al., 1988; Nyberg et al., 1998). It is also a strong inhibitor of BChE, with enzyme activity suppressed by ∼90% at 2 h after a 20-mg single dose (Ostergaard et al., 2000), and 50% at 24 h on a steady-state regimen of 20 mg daily (Sitar et al., 1992). Thus, bambuterol inhibits its own metabolism and that of the BChE-dependent neuromuscular blockers (Fisher et al., 1988; Staun et al., 1990). Bambuterol 20 or 30 mg 2 h before anesthesia with suxamethonim or mivacurium in phenotypically normal patients resulted in prolongation of the neuromuscular blockade by 3- to 4-fold, respectively (Fisher et al., 1988; Bang et al., 1990b; Ostergaard et al., 2000). A 2- to 3-fold prolongation of response was observed among those with an inferred UA or US genotype (Bang et al., 1990a).
With regard to the consequence of variable BChE activity on bambuterol, in vitro studies showed that this drug has much lower affinity (∼10%) for the atypical enzyme compared with the usual enzyme (Tunek et al., 1991). However, an in vivo study demonstrated that those with an inferred AA genotype (i.e., carrying two atypical forms of the enzyme) produced terbutaline as effectively as those with the UU genotype (Bang et al., 1998). The authors suggested that the uptake (absorption/availability) of bambuterol is more rapid in the presence of the AA genotype. A shorter half-life and a higher Cmax of bambuterol as well as an elevated Cmax for terbutaline was seen in those with the AA genotype (Bang et al., 1998). Thus, preliminary in vivo data suggest that the response to bambuterol may not be affected by the presence of the atypical enzyme variant. The major importance of BChE with respect to bambuterol is the potential for BChE inhibition, which is not relevant to our discussion.
5. Summary.
Testing for BChE deficiency is entrenched in clinical practice and its niche is found in the evaluation of patients (and their families) with prolonged response to suxamethonium and mivacurium. Although phenotyping is likely to be more familiar to clinicians and is performed more frequently (Gardiner and Begg, 2005), genotyping is a suitable alternative. There is insufficient evidence to warrant testing in relation to other therapeutic agents that are subject to this enzyme.
C. Thiopurine Methyltransferase
Thiopurine methyltransferase (TPMT) is the drug-metabolizing enzyme that probably has the strongest case of all for prospective pharmacogenetic testing. Inherited TPMT deficiency predisposes to myelosuppression with both azathioprine and its initial product, 6-mercaptopurine (6-MP). Three enzymes, hypoxanthine phosphoribosyltransferase, xanthine oxidase, and TPMT, compete to break down 6-MP (Fig. 2). The main pathway for clinical effect involves hypoxanthine phosphoribosyltransferase and other enzymes to produce the active 6-thioguanine nucleotides (6-TGNs) (Tidd and Paterson, 1974; Elion, 1989). The two other pathways involve xanthine oxidase and TPMT, and produce 6-thiouric acid (inactive) and 6-methylmercaptopurine (largely inactive), respectively. The relative activities of the three pathways determine the net amount of 6-TGN produced. In particular, reduced TPMT or xanthine oxidase activity (e.g., via inherited deficiency or allopurinol administration, respectively) leads to increased production of 6-TGN, and the possible development of myelotoxicity. Another commercially available thiopurine, thioguanine, produces 6-TGN more directly, but because this production does not involve TPMT it will not be included in the following discussion.
TPMT is a cytosolic enzyme found in many tissues, with activity most commonly determined in red blood cells. In Caucasians, a trimodal distribution exists, with 0.3 to 0.6% having low or undetectable activity, 10% having intermediate activity, and the remaining 90% having high (normal) activity (Weinshilboum and Sladek, 1980; Lennard et al., 1987; Tinel et al., 1991; McLeod et al., 1994; Schaeffeler et al., 2004). In the largest TPMT genotyping-phenotyping study to date (1222 German volunteers), considerable variation in erythrocyte TPMT activity was observed (≥2-65 nmol of 6-methylthioguanine formed per h per g of hemoglobin). TPMT activity was ≤2, 9-22, and (≥22 nmol/h/g Hb, respectively, in those with low, intermediate, and high activity defined by modeling frequency distributions (Schaeffeler et al., 2004). Approximately 2% of this population had very high TPMT activity (51-65 nmol/h/g Hb), corroborating the suggestion of an earlier study of the existence of a group of “ultrarapid metabolizers” (Yan et al., 2000). Care must be taken when extrapolating reported cutoffs of TPMT activity that define low, intermediate, and high activity to any new population, as different assay methodology may yield variable measured TPMT activities.

Metabolism of azathioprine and 6-mercaptopurine. GMPS, guanosine monophosphate synthetase; HPRT, hypoxanthine phosphoribosyltransferase; IMPD, inosine monophosphate dehydrogenase; TG, thioguanine; TGMP, thioguanine monophosphate; TGN, thioguanine nucleotides; TIMP, thioinosine monophosphate; TXMP, thioxanthosine monophosphate.
Many TPMT variants have been identified, with TPMT*2, *3A, *3B, and *3C being responsible for most cases of TPMT deficiency (Krynetski et al., 1995; Szumlanski et al., 1996; Tai et al., 1996; Otterness et al., 1997, 1998; Spire-Vayron de la Moureyre et al., 1998; Hon et al., 1999; Colombel et al., 2000; Hamdan-Khalil et al., 2003; Schaeffeler et al., 2003, 2004; Lindqvist et al., 2004). TPMT*3A is the most common variant in Caucasians (Yates et al., 1997; Collie-Duguid et al., 1999), whereas *3C is the most frequent mutation in those of African (Ameyaw et al., 1999; Hon et al., 1999) or East or Southeast Asian origin (Otterness et al., 1997; Collie-Duguid et al., 1999; Kumugai et al., 2001; Chang et al., 2002). All other known variants are rare (Otterness et al., 1997, 1998). Homozygotes for a variant allele (e.g., TPMT*3A/*3A) have negligible TPMT activity, whereas heterozygotes (e.g., TPMT*1/*3A, intermediate activity) have an average activity that is approximately half that observed in homozygotes for wild-type alleles (TPMT*1/*1, normal/high activity). Minor overlap exists between these groups with 1 to 2% of genotypic wild types (presumed normal/high activity) having enzyme activity in the intermediate range and ∼5% of heterozygotes (presumed intermediate activity) having TPMT activity in the normal/high range (Schaeffeler et al., 2004).
Genotyping is reasonably accurate in predicting TPMT phenotype, defined as low, intermediate or normal/high TPMT activity. The large German study showed that screening for TPMT*2 and *3A to *3D plus sequencing of the open reading frame predicted phenotype in 98% of cases (Schaeffeler et al., 2004). Smaller studies suggested that screening for TPMT*2, *3A, and *3C will identify 80 to 97% of variant alleles (Otterness et al., 1997; Yates et al., 1997; Rossi et al., 2001). Choice of genotyping or phenotyping depends partially on local expertise and available equipment, although clinicians seem to prefer to measure TPMT activity over genotype (Gardiner and Begg, 2005). This could be due to the perception that TPMT activity, which varies 30-fold overall and 3- to 4-fold in wild-type individuals (Yan et al., 2000; Schaeffeler et al., 2004), gives a better indication of the patient's actual ability to metabolize thiopurines than genotype, which divides a population into three groups. Phenotyping may also be advantageous in populations with diverse racial make-up, as routine genotyping could prove unreliable due to the presence of novel or unscreened variants. Therefore, measurement of TPMT activity may usually be more clinically relevant, except in the case of a recent blood transfusion, which may result in incorrect phenotype assignment. An argument that is often given in support of genotyping is that TPMT activity is inhibited by salicylates (mainly sulfasalazine) (Szumlanski and Weinshilboum, 1995; Lewis et al., 1997; Xin et al., 2005), which are often used with thiopurines. However, in the most likely scenario of combined use (inflammatory bowel disease), salicylates are usually initiated before azathioprine or 6-MP and are generally continued concurrently. Thus, TPMT enzyme activity may provide a better indication of the patient's actual ability to handle thiopurines than genotype. Further complicating the issue is the fact that thiopurine drugs induce TPMT activity, especially in heterozygotes (∼30% increase), indicating that baseline TPMT activity may not predict activity during treatment (Chocair et al., 1992; Schutz et al., 1995; Cuffari et al., 2004).
1. Azathioprine and 6-Mercaptopurine.
These drugs are widely used despite problems such as high discontinuation rates due to adverse effects (10-42% (Harris et al., 1971; Hamdy et al., 1987; Pearson et al., 1995; Black et al., 1998; Stolk et al., 1998; Gearry et al., 2004)) and treatment failures in chronic inflammatory conditions. Identification of factors that predict efficacy and toxicity could greatly improve the use of these drugs. Neither thiopurine dose (Zimm et al., 1983; Ohlman et al., 1993; van Os et al., 1996) nor 6-MP concentrations (Zimm et al., 1983; Lafolie et al., 1991; Bergan et al., 1994) are useful in this regard; thus, testing for TPMT status has added a valuable dimension to improving the therapeutic index of these drugs.
The therapeutic niche of TPMT testing relates to its ability to identify prospectively the small proportion of patients (0.3-0.6%) with enzyme deficiency who will almost certainly develop life-threatening myelosuppression if standard doses are used. TPMT activity is inversely related to erythrocyte 6-TGN concentration (Lennard et al., 1987, 1990), with the latter correlating with white cell and neutrophil count (Herber et al., 1982; Lennard et al., 1983, 1997; Schmiegelow and Bruunshuus, 1990). Individuals with TPMT deficiency develop very high concentrations of the cytotoxic 6-TGNs (>2000 pmol/8 × 108 red blood cells) (Lennard et al., 1987, 1993, 1997; Evans et al., 1991; Anstey et al., 1992; Schutz et al., 1996a,b). Intermediate TPMT activity also predisposes to myelotoxicity (Black et al., 1998; Relling et al., 1999a; Schwab et al., 2002). One rheumatological study (n = 67) reported that five of six (9%) patients with the TPMT*1/*3A genotype stopped azathioprine 2 to 3 mg/kg/day within 1 month as a result of leukopenia (0.9-2.7 × 10⁹ leukocytes/l). The sixth patient was noncompliant. None of the remaining 61 wild-type individuals had myelosuppression and the median duration of tolerated therapy was considerably longer, at 39 weeks (range 6-≥180) versus 2 to 4 weeks for the nontolerators (Black et al., 1998). Although it is clear that TPMT deficiency (particularly complete deficiency) predisposes to myelotoxicity, approximately three-quarters of cases of bone marrow depression occur in those without mutations (i.e., presumed normal enzyme activity) (Colombel et al., 2000). This indicates that TPMT metabolizer status is a useful adjunct to (but not replacement for) regular blood count monitoring. The clinical usefulness of prospective determination of TPMT metabolizer status is supported by pharmacoeconomic studies (Marra et al., 2002; Oh et al., 2004; Winter et al., 2004; Dubinsky et al., 2005; Priest et al., 2005).
Evidence for other adverse effects correlating usefully with TPMT activity or genotype is less clear. There is a link between TPMT deficiency, primarily inferred from elevated 6-TGN concentrations, and increased risk of brain tumors in childhood acute lymphoblastic leukemia (Relling et al., 1999b) and skin cancers in renal transplant recipients (Lennard et al., 1985). High TPMT activity might also predispose to hepatotoxicity that interrupts treatment (Relling et al., 1999a), through elevated 6-MMP production. 6-MMP concentrations have been correlated with hepatotoxicity in acute lymphoblastic leukemia (Nygaard et al., 2004), and very high concentrations (>5700 pmol/8 × 108 erythrocytes) have been implicated in a 3-fold increased risk of liver toxicity in inflammatory bowel disease (Dubinsky et al., 2000).
Evidence supporting determination of TPMT status to predict efficacy is more contentious. Individuals with TPMT deficiency might achieve greater therapeutic effect, whereas those with high TPMT activity might be predisposed to treatment failure (Lennard et al., 1990; Chocair et al., 1992). Conflicting results have been seen in the renal transplant setting. In one study, pretreatment TPMT activity did not predict rejection episodes among 22 patients. However, 9 (82%) of 11 patients with at least one rejection episode had high TPMT activity (>25.0 nmol/h/ml erythrocytes) at 1 month post-transplantation, whereas the remaining eleven patients with lower TPMT activity (<25.0 nmol/h/ml erythrocytes) did not experience rejection in the 1st year (Dervieux et al., 1999). A larger study (n = 112) found no relationship between TPMT genotype and risk of renal graft rejection (Kurzawski et al., 2005). In inflammatory bowel disease, pretreatment TPMT activity <15.3 nmol/h/ml erythrocytes was associated with a 6-fold greater likelihood of response (Cuffari et al., 2004). Other studies both support (Campbell et al., 2002) and refute these findings (Lowry et al., 2001a; Reuther et al., 2003). The reasons for the disparate results are unclear but may reflect variable study designs and the complex thiopurine pharmacology. None of the latter three studies included early discontinuations due to inadequate dosing or drug toxicity (Lowry et al., 2001a; Campbell et al., 2002; Reuther et al., 2003).
The general (although somewhat variable) findings above are consistent with the predicted inverse relationship between TPMT activity and 6-TGNs, and a direct relationship between 6-TGNs and efficacy. However, as yet there is insufficient evidence to suggest that baseline TPMT activity will assist with predicting efficacy or toxicity aside from that in those with complete deficiency.
2. Summary.
The case for prospective genotyping or phenotyping for TPMT status is the strongest of all that we have studied, according to the algorithm (Table 2). It is the only one to reach the “definite” status in the algorithm in relation to prospective testing (the case for butyrylcholinesterase also seems strong, but testing is most helpful retrospectively). It is our opinion that all individuals commencing thiopurine therapy should undergo prospective screening (genotype and/or phenotype) for TPMT status. The main clinical value lies in the ability to identify those with extremely low TPMT activity who will almost certainly develop profound myelosuppression with standard thiopurine doses. However, as most cases of myelosuppression occur in wildtype individuals, tests for TPMT will not replace routine monitoring of blood count.
For individuals who have negligible TPMT activity, an alternative immunosuppressant should be considered. If these are unavailable, it is reassuring to know that thiopurines have been used successfully in individuals with very low TPMT activity in acute lymphoblastic leukemia and inflammatory bowel disease, at a markedly reduced dose (5-25% of normal) (Evans et al., 1991; Lennard et al., 1993; Kaskas et al., 2003; Gardiner et al., 2006). For these individuals, measurement of erythrocyte 6-TGN concentrations together with frequent full blood counts could facilitate safer use of these drugs. As these patients normally develop very high 6-TGN concentrations, the aim would be to achieve concentrations within the range consistent with those associated with improved outcomes. For example, in inflammatory bowel disease, aiming for a concentration on the order of 235 to 450 pmol/8 × 108 erythrocytes might be reasonable to promote response without significant risk of myelotoxicity (Schutz et al., 1996b; Dubinsky et al., 2000, 2002; Cuffari et al., 2001; Dubinsky et al., 2002; Achkar et al., 2004). However, it should be recognized that the clinical benefit of erythrocyte 6-TGN monitoring is controversial (and that of 6-MMP more so) (Sandborn et al., 1999; Lowry et al., 2001b). This controversy might partially reflect the observational nature of the studies undertaken to date, the presence of other active metabolites (e.g., S-methyl-thioinosine 5′-monophosphate) (Coulthard et al., 2002), and the failure of erythrocyte 6-TGN concentrations to reflect active drug concentrations in the target tissue (e.g., bone marrow or lymphocytes). Despite these issues, it could be argued that erythrocyte 6-TGN concentrations provide a better means of optimizing response than dose, as they are several steps closer to the biophase of activity. Thus, in the absence of better alternatives, monitoring of 6-TGN concentrations could be useful in certain cases such as TPMT-deficient individuals or patients with suspected underdosing or noncompliance. The implications of identifying individuals with intermediate status are less clear. Some authors have advocated a 50% dose reduction (e.g., azathioprine 0.5 mg/kg/day) to reduce the risk of myelotoxicity, which seems reasonable based on available data.
The choice of testing using TPMT genotype or phenotype remains open to debate. TPMT enzyme activity could have an advantage for the reasons outlined previously, as well as to identify individuals with very high TPMT activity who could benefit from high thiopurine doses (azathioprine >2 mg/kg/day) (Sanderson et al., 2004). However, this suggested dosage adjustment is speculative and could predispose to toxicity as a result of elevated 6-MMP concentrations. Prospective clinical trials could help determine whether use of TPMT status to guide initial dosage selection has a significant impact on outcomes, particularly for those individuals with intermediate or very high TPMT activity.
D. Dihydropyrimidine Dehydrogenase
Dihydropyrimidine dehydrogenase (DPD) metabolizes two endogenous pyrimidines, thymine and uracil (Daher et al., 1990), and is relevant in drug therapy involving the pyrimidine analog, 5-fluorouracil (Fig. 3). DPD is particularly highly expressed in the liver and peripheral blood mononuclear (PBM) cells (Naguib et al., 1985; Ho et al., 1986; van Kuilenburg et al., 1999b). DPD activity in PBM cells has been used as a surrogate of total body DPD activity (Lu et al., 1993; Etienne et al., 1994; van Kuilenburg et al., 1999b) and varies up to 20-fold. Absolute and partial DPD deficiencies occur in 0.1 and 3%, respectively, of the Caucasian population. Unexpectedly, DPD activity is usually described as normally distributed, perhaps reflecting the absence of cases of absolute deficiency in the studies (Lu et al., 1993, 1995; Etienne et al., 1994; McMurrough and McLeod, 1996; Ridge et al., 1998b; van Kuilenburg et al., 1999b; Morsman et al., 2000). It has been proposed that individuals with PBM cell DPD activity below the lower 95th and 99th percentiles (< 0.064 and <0.024 nmol/min/mg, respectively, in one study) should be classified as having partial and absolute deficiency, respectively (Lu et al., 1993). Care must be taken when extrapolating these specific cutoffs to other settings, as storage of the samples (e.g., duration and temperature) greatly affects measured enzyme activity (Lu et al., 1993; McMurrough and McLeod, 1996; Ridge et al., 1998a).

Metabolism of 5-fluorouracil.
Approximately 30 variant alleles have been identified in the DPYD gene (Ridge et al., 1998a,b; van Kuilenburg et al., 1999a, 2000, 2002a; Collie-Duguid et al., 2000), with DPYD*2A (a G>A point mutation) being most frequently implicated in DPD deficiency (Vreken et al., 1996; Wei et al., 1996; Fernandez-Salguero et al., 1997; van Kuilenburg et al., 1997, 2000; Ridge et al., 1998b). Among Caucasians, 1 to 2% are heterozygous for DPYD*2A (homozygotes have not been detected in screening studies) (Wei et al., 1998; Raida et al., 2001; van Kuilenburg et al., 2001) and have ∼50% lower PBM cell DPD activity than the wild type (van Kuilenburg et al., 2002b). Other mutations have also been associated with DPD deficiency, but their clinical value as a screening test has not been defined (Christensen et al., 1998; Vreken et al., 1998; van Kuilenburg et al., 2000, 2001).
1. 5-Fluorouracil.
5-Fluorouracil (5-FU) is mainly used to treat solid tumors of the head, neck, breast, and gastrointestinal tract. Despite extensive usage and many attempts to improve its therapeutic index, response rates remain low and toxicities severe and unpredictable. These problems are partially due to variable expression of DPD.
5-FU is metabolized via two main pathways termed catabolic and anabolic (Fig. 3). DPD is the dominant and rate-limiting enzyme of the catabolic pathway. The amount of 5-FU metabolized by DPD dictates the proportion available for anabolism (Heggie et al., 1987) to the active nucleotides that inhibit cell replication (Daher et al., 1990). Most individuals eliminate ∼85% of a 5-FU dose catabolically and up to 10% unchanged renally, with a half-life of 5 to 27 min. Individuals with absolute DPD deficiency eliminate 5-FU 90% unchanged via the kidneys, with a half-life of 2.5 to 60 h (Heggie et al., 1987; Diasio et al., 1988; Diasio and Harris, 1989; Fleming et al., 1993).
Some patients are more susceptible to toxicity and develop severe gastrointestinal symptoms, myelosuppression and neurotoxicity with standard 5-FU doses (Diasio et al., 1988; Harris et al., 1991; Fleming et al., 1993; Houyau et al., 1993; Lu et al., 1993). Case reports show that absolute (Tuchman et al., 1985; Diasio et al., 1988) and partial (Houyau et al., 1993; Lyss et al., 1993; Milano et al., 1999; Franco and Greenberg, 2001) deficiency increase the risk. Unfortunately, PMB cell DPD activity varies widely (8- to 200-fold) in patients with severe 5-FU toxicity, although up to 60% of these may have some degree of deficiency (<70% of that seen in a control population) (Lu et al., 1993; Milano et al., 1999; van Kuilenburg et al., 2000, 2000b; Di Paolo et al., 2002; Terashima et al., 2003). Sequencing of the DPYD gene may identify a genetic cause in ∼80% of these patients, with half (55%) having the *2A allele (van Kuilenburg et al., 2000). Thus, screening for DPYD*2A could identify up to 25% of patients who will develop 5-FU toxicity due to DPD deficiency. Two other studies show that 24 to 50% of patients with severe toxicity (usually myelosuppression) carried at least one DPYD*2A mutation (Raida et al., 2001; van Kuilenburg et al., 2002b).
There seems to be some merit in prospective assessment of DPD status to identify those individuals who may be predisposed to toxicity. One group suggested that all patients should be screened for DPYD*2A, based on a simple pharmacoeconomic evaluation. They estimated that 2500 of the 250,000 to 300,000 individuals in the United States who received 5-FU annually would carry the *2A allele and that half of these might develop severe toxicity at a cost of ∼$US36 to 145 million/year to treat. This would exceed the costs of genotyping all patients, which was estimated to be $US25 to 30 million/year at $100/test (Raida et al., 2001; Behnke et al., 2002). Others have argued against this approach on the basis of low sensitivity and specificity of the test (Innocenti and Ratain, 2002). More formal pharmacoeconomic analyses should be undertaken.
Unfortunately, testing for DPD does not seem to usefully predict 5-FU pharmacokinetics or efficacy (Vokes et al., 1996). PBM cell DPD activity and 5-FU clearance correlate poorly (Fleming et al., 1992; Etienne et al., 1994), perhaps due to the weak correlation between DPD activity in PBM cells and the liver (r2 = 0.31), the primary site of pyrimidine metabolism (Chazal et al., 1996). Fatal neurotoxicity has been reported in a patient with elevated 5-FU concentrations and normal PBM cell DPD activity, but markedly reduced hepatic DPD activity perhaps due to metastases (Stephan et al., 1995). Another problem with assessment of PBM cell DPD activity clinically includes circadian variation (Harris et al., 1988; Grem et al., 1997) with no interindividual consistency in terms of the timing of peak and trough activity (Harris et al., 1990; Grem et al., 1997). For these sorts of reasons, other methods of phenotyping have been explored, including the administration of a 5-FU test dose with measurement of 5′,6′-dihydrofluorouracil (initial catabolite) concentrations (Bocci et al., 2000). This approach could provide a better estimate of total body DPD activity. One area where assessment of DPD activity may be of particular values is in tumor tissue (McLeod et al., 1998; Fujiwaki et al., 2000; Mizutani et al., 2001), as increased activity is associated with reduced response to 5-FU (Beck et al., 1994). Identification of tumors with high DPD activity at the outset of treatment could facilitate earlier selection of alternate drugs.
The debate about testing for DPD is complicated by the increasing clinical use of DPD inhibitors such as eniluracil, which irreversibly inactivate DPD and thereby abolishes much of the variability in 5-FU pharmacokinetics. For example, the oral availability increases from 0 to 80% (Cohen et al., 1974; Hahn et al., 1975; Christophidis et al., 1978; Almersjo et al., 1980) to ∼100% and the half-life to 5-6 h (from <0.5 h). Renal clearance becomes the dominant form of elimination (Baker et al., 1996; Schilsky et al., 1998) for which dose adjustment is easy (based on estimated creatinine clearance). Another advance is the development of capecitabine, an oral fluoropyrimidine derivative that is preferentially metabolized to 5-FU in tumors after a series of enzymatic steps. Further discussion on this compound is beyond the scope of this article except to indicate that inherited variability in the enzymes involved, including DPD, may also influence response to this drug (Ishikawa et al., 1998).
2. Summary.
Patients with absolute or partial DPD deficiency may be predisposed to toxicity with 5-FU. Determination of PBM cell DPD activity (i.e., phenotype) may identify up to 60% of patients who may develop severe toxicity, whereas screening solely for the DPYD*2A allele (genotype) will identify approximately 25% of these patients. Identification of a patient with absolute deficiency would allow selection of alternative chemotherapy, whereas those with partial deficiency could be treated with a lower dose of 5-FU. There could be a role for assessing intratumoral DPD activity, since high enzyme activity suggests poorer outcomes with 5-FU. The increasing availability of DPD inhibitors may make assessment of metabolizer status redundant. Overall, there are too many unknowns for screening for DPD to be recommended routinely in the clinic. Formal pharmacoeconomic analyses need to be performed to see whether prospective genotype testing is worthwhile.
E. Uridine Diphosphate Glucuronosyltransferase 1A1
Uridine diphosphate glucuronosyltransferase 1A1 (UGT1A1) belongs to the uridine diphosphate glucuronosyltransferase superfamily and gained recognition recently as the first pharmacogenetic test to achieve FDA approval for use in conjunction with a specific drug (irinotecan) (http://www.fda.gov/bbs/topics/NEWS/2005/NEW01220.html; http://www.twt.com/company/pressreleases/2005/Aug_22_2005.html). Variants in UGT1A1 have been associated with greater exposure to the active cytotoxic metabolite of irinotecan (Sai et al., 2004) and elevated risk of the major dose-limiting toxicities of diarrhea and myelosuppression (Ando et al., 2000). Irinotecan is widely used, particularly in the treatment of colorectal and lung cancers. It is a prodrug that is metabolized by carboxylesterases to the active topoisomerase inhibitor 7-ethyl-10-hydroxycamptothecin (SN-38) and by CYP3A4 to inactive metabolites. Thereafter, SN-38 is glucuronidated by UGT1A1 (Iyer et al., 1998) with the resultant SN-38 glucuronide excreted into the intestine via bile. Enteric bacterial β-glucuronidase regenerates SN-38, which can be reabsorbed into the systemic circulation. Liberation of SN-38 within the gut may cause local tissue damage and diarrhea.
The activity of UGT1A1 varies widely, with an in vitro study demonstrating a 17-fold variation in SN-38 glucuronidation (Iyer et al., 1999). UGT1A1*28 is the variant most frequently implicated in defective SN-38 glucuronidation and involves an extra thymine-adenine (TA) repeat in the TATA section of the UGT1A1 promoter [i.e., (TA)7TAA instead of (TA)6TAA in the wild type]. It is also the primary cause of Gilbert's syndrome (Bosma et al., 1995) consistent with the role of UGT1A1 as the principle enzyme responsible for bilirubin glucuronidation (Bosma et al., 1994). This variant occurs commonly, with the homozygous genotype found in 5 to 15% of Europeans, 10 to 25% of Africans and South Asians, and 1 to 5% of Southeast Asians and Pacific Islanders (Premawardhena et al., 2003).
Initial case reports documented severe neutropenia in patients with Gilbert's syndrome receiving standard doses of irinotecan (Wasserman et al., 1997). Subsequently, studies reported an increased risk of toxicity in homozygotes for UGT1A1*28 compared with homozygotes for UGT1A1*1 (individuals heterozygous for these alleles were sometimes included in the latter comparator group). These included a 5-fold higher risk of severe neutropenia and diarrhea (Ando et al., 2000), ∼3-fold lower absolute neutrophil count nadir (Iyer et al., 2002), and 9-fold increased risk of severe (grade 4) leukopenia (Innocenti et al., 2004). Consistent with this, the mean AUCs of SN-38 were 1.6- and 2.6-fold higher in UGT1A1*28 homozygotes than UGT1A1*1 homozygotes in two studies, whereas a marginally higher AUC (∼1.4-fold) was observed in heterozygotes (Iyer et al., 2002; Innocenti et al., 2004). Other studies have failed to identify an increased risk of neutropenia and/or diarrhea among UGT1A1*28 homozygotes (Ando et al., 2000; Innocenti et al., 2004; Rouits et al., 2004). These variable findings may relate to methodological differences, variable dosage regimens, and the small number of subjects studied. In addition, many other genes (e.g., ABCB1 and UGT1A9) affect outcomes with irinotecan, potentially blurring the relationship with UGT1A1*28.
The above information led to revised irinotecan labeling (Camptosar label information; http://www.fda.gov/cder/foi/label/2005/020571s024,027,028lbl.pdf) after an FDA advisory committee meeting in November 2004. However, whereas the revised labeling contains information about the possible implications of UGT1A1 status, it does not explicitly endorse genetic pretesting. It indicates that “... the precise dose reduction in [UGT1A1*28 homozygotes] is not known...”; but that “... a reduction in the starting dose by at least one level [15-25%] should be considered for patients known to be homozygous for the UGT1A1*28 allele.” This approach seems fairly conservative and allows for dose escalation in subsequent cycles. However, it may be premature to recommend dose reduction for UGT1A1*28 homozygotes given the conflicting findings observed to date. Furthermore, a large proportion (30-50%) of individuals with this genotype will not develop severe toxicity (Ando et al., 2000; Iyer et al., 2002; Rouits et al., 2004) and may be undertreated if the dose is reduced. The latter statement is supported by some preliminary data suggesting that UGT1A1*28 may be associated with improved response (not unexpected if there is a dose-response relationship) (Font et al., 2002). Further research is needed to establish the benefit of genotyping in relation to irinotecan. It is possible that the FDA approval may result in overuse of the test, before its place in therapeutics is established.
IV. Overall Summary and Conclusions
A convincing case for routine genotyping or phenotyping before drug administration can be made for very few drugs and perhaps only for the thiopurines (Table 6). Retrospective testing for BChE deficiency by phenotype or genotype is already part of clinical practice in patients with prolonged apnea after suxamethonium or mivacurium and in close relatives of these patients. It is unlikely, both logistically and pharmacoeconomically that routine pretesting would occur, except in close relatives of affected patients. BChE is also involved with a few other drugs, but evidence is sparce for any meaningful clinical effect of enzyme deficiency.
Tests for drug-metabolizing enzymes that are relevant or potentially relevant clinically
The case for azathioprine/GMP in relation to TPMT activity is certainly the strongest in terms of routine pretesting. There is a good gene-enzyme relationship, a good gene-effect relationship for adverse effects (myelosuppression), the drugs have a low therapeutic index, and pharmacoeconomic analysis is supportive. Although pretesting for both genotype and phenotype is possible, measuring the phenotype (TPMT activity) is the most reliable index in most circumstances. Pretesting can help greatly with therapeutic decisions, although it will not obviate the need to monitor endpoints of activity such as blood counts and liver function test results. Furthermore, active moiety concentration measurement (6-TGNs and perhaps 6-MMP) may also assist dosing, although clinical relevance has been debated and further study is necessary.
The next strongest case is for warfarin, in relation to CYP2C9 activity. The evidence puts this in the range of probable in terms of the usefulness of prospective genotyping. The major active moiety S-warfarin is metabolized appreciably by CYP2C9, a strong gene-dose relationship is seen, the dose-effect relationship is quite strong for both desired effect (decreased clotting) and adverse effects (largely excessive bleeding), a reasonable gene-effect relationship has been shown, and a pharmacoeconomic analysis has been supportive of genotyping. Alongside this evidence, the long experience with prothrombine time monitoring, which will still need to be performed to confirm the dosing strategy, makes it unlikely that genotype testing will develop much traction in the clinic at least in the near future. If prospective studies show outcome benefits and as genotype testing becomes more available routinely, it is possible that genotyping for CYP2C9 activity, perhaps along with other polymorphically expressed genes governing the warfarin effect (e.g., VKORC1), might assist in the therapeutics of this drug. Of other drugs that have CYP2C9 as a major pathway, a case for genetic pretesting can be mounted only for phenytoin. As with warfarin, the long experience with phenytoin dosing in conjunction with monitoring (in this case of phenytoin concentrations, which will still require monitoring regardless), makes it unlikely that genotyping will become part of routine practice in most centers.
Although CYP2D6 has been widely touted as the enzyme with the most drugs of potential importance in terms of pretreatment genotyping/phenotyping, the evidence in support is disappointing. The best evidence is for perhexiline, which is the only drug to attain a probable rating in terms of potential usefulness. This rating is based on a strong gene-phenotype relationship, a strong concentration-effect relationship (especially for adverse effects), and a low therapeutic index. Although genotyping correlates well with phenotyping (parent/metabolite ratio), the majority of the few centers in the world in which perhexiline remains popular are so used to phenotyping (which also provides more information) that genotyping is unlikely to take over.
The next best evidence is for nortriptyline, which is often used as an archetypal example of a drug that has a clear and strong gene-concentration effect. The main problem is that nortriptyline is administered as a racemate of enantiomers and has an active metabolite that also has enantiomers. When all are considered, the proposed gene-concentration effect becomes blurry. This problem is common to many other substrates of CYP2D6 and other enzymes and illustrates one of the major problems besetting the clinical relevance of pharmacogenetics. Despite this problem, genotyping before dosing with nortriptyline could be considered to be possibly useful in some settings. More work is needed.
Other CYP2D6 substrates for which a possible case could be made include codeine, metoprolol, tropisetron, and atomoxetine. Of these, the strongest evidence is related to codeine, yet it is unlikely that prospective genotyping will happen with this drug because codeine has been used so widely for so long that it is subject to the cliché “familiarity breeds contempt”. Pretesting is unlikely to occur to any degree, because of the urgent setting in which pain relief is often required. The value of testing is also decreased by the relatively high therapeutic index, and the fact that many cases of poor response can be explained by phenocopying to slow metabolizer status (e.g., by paroxetine given concurrently) or factors other than metabolism. Occasional testing might yield a person of PM status, which may explain poor response. A good case seems possible to be made for metoprolol because of a strong gene-concentration relationship, but this is weakened by differential enantiomer effects, the long history of use without genotyping, and the fact that clinical endpoints such as heart rate can be easily measured. Furthermore, several studies show that clinical outcomes do not vary in relation to CYP2D6 status. No viable case can be mounted for any other CYP2D6 substrate based on current evidence.
The other major P450 with proven polymorphism and several substrates is CYP2C19. Of these, only the PPIs warrant discussion in terms of clinical relevance of genotype pretesting. The case for the PPIs omeprazole and lansoprazole approaches probable, but for quite different reasons than the other cases above. The gene-concentration effect is among the strongest of any, with increases in AUC observed in PMs of up to 12-fold. These increases might suggest a greatly increased chance of adverse reactions among PMs, but these drugs have a very high therapeutic index. With conventional doses however, some EMs may have inadequate response. Proof of EM status via genotyping may allow much higher doses to be given in these patients. Given that this group of drugs is among the most highly used worldwide, it is unlikely that pretesting for genotype will happen in practice. With respect to the other P450 enzymes, possible cases can be mounted for CYP2B6 and efavirenz, CYP2C8 and ibuprofen, and CYP3A5 and tacrolimus. However, much more work needs to be done before any clinical relevance can be attributed to this testing.
Whereas “acetylator status” was one of the earliest pharmacogenetic polymorphisms discussed by pharmacologists, there was very little translation of these discussions to the clinic. It could be argued that the effective demise of hydralazine and procainamide, because of the lupus reaction, resulted in part from genetic polymorphisms, but this reason was not recognized widely at the time. The enzyme involved, NAT2, remains the subject of pharmacogenetic debate in relation to various purported substrates, including isoniazid and various sulfonamides. Overall there seems little likelihood that genotyping or phenotyping will occur with any frequency with any of currently known substrates.
The case of UGT1A1 and irinotecan needs discussion because this is the first pharmacogenetic test to achieve FDA approval. Prospective genotyping may identify patients predisposed to toxicity. However, an elevated bilirubin level (suggesting Gilbert's syndrome) may identify many of these patients, and the presence of variant alelles does not guarantee toxicity. More work is needed.
The case for testing for DPD to preempt toxicity related to 5-FU seems to have merit and is supported by a simple pharmacoeconomic evaluation. However, the case is weakened by a poor correlation between phenotype and pharmacokinetic effects and an incomplete prediction of phenotype from genotype. As with TPMT, phenotyping provides more information than genotyping, and may predict up to 60% of patients who may develop severe toxicity. The controlled situation of oncology clinics, in which 5-FU is usually given, makes it more likely that some form of pretesting could be adopted clinically, and this is supported by the increasing familiarity of these doctors with TPMT testing. More work is needed to define the true place of DPD testing.
V. Future Directions
The practical application of pharmacogenetics in the clinic is currently limited to only a few drugs, and this situation is unlikely to change in the near future. Many issues militate against adoption of testing, including specific factors that contaminate the signal, such as active metabolites/enantiomers as noted above and more general factors such as access and availability of tests.
Other forces that make testing unlikely include drug companies, which do not want the therapeutics of their drugs to be complicated. Features of human nature that prevent uptake include the desire for simplicity (much of the information is difficult for people outside the field to comprehend), resistance to altering the status quo, and pragmatism (the process of pretesting is complex). It is reassuring that the two enzymes, TPMT and BChE, that are suggested by this review as most relevant to the clinic are those for which tests are being undertaken (albeit rarely) in clinical practice (Gardiner and Begg, 2005). However, in both cases it is phenotyping rather than genotyping that is performed most frequently.
A more formalized approach to both obtaining and interpreting the evidence is needed. Critical among these is the degree to which total molar activity is altered by the polymorphisms, and how this compares with variability from other sources. We believe algorithms, perhaps like the one we have used, should be developed and tested to assist in interpreting the evidence. Our algorithm has not been validated formally but proved useful for providing a more objective approach for this review at least in terms of comparing the evidence between drugs. We challenge other groups to develop and test algorithms that could be used to assess the relevance of pharmacogenetic tests in clinical practice.
Formal pharmacoeconomic studies need to be performed whenever a strong evidence-based case is made for pharmacogenetic testing. This is valuable from a population perspective when there are limited funds available for health care expenditure. However, it is also recognized that the business model may intervene, with aggressive marketing, e.g., of genetic tests encouraging clinical uptake before the evidence supports use of the test. From a “best evidence” perspective, it would be useful for pharmacoeconomists to define standards for conducting such studies that are both feasible and readily comprehensible.
Prospective studies would be useful at least for proof of concept to demonstrate that therapeutic advantage actually follows the use of pharmacogenetic testing. Although the clinical uptake of the two tests with greatest utilization (TPMT and BChE) does not seem hindered by the lack of such studies, a case could be made for specific prospective studies in relation to TPMT. For example, it has been suggested that individuals with intermediate TPMT activity could benefit from a dose reduction to 50% of normal. It would be useful to test this hypothesis formally with the view to ascertaining whether a dose reduction at the outset of therapy improves effectiveness or tolerability. If this were proven to be the case, it would give credibility to the concept of genotype-based dose adjustment. A case could also be made for prospective testing when there is substantial complexity to the overall pharmacology of a drug. For example, warfarin is influenced by so many factors that it would be useful to see whether CYP2C9 (or VKCOR1)-guided dosing could improve outcomes by reducing the time to dose stabilization or adverse outcomes such as bleeding episodes. Nortriptyline is another example. Pharmacokinetic data show profound difference in nortriptyline concentrations with the CYP2D6 genotype (Dalen et al., 1998), which has led to the suggestion that PMs may require very small doses (∼20 mg daily), whereas UMs may require up to 500 mg daily to produce the same nortriptyline concentrations. However, the presence of an active metabolite produced by CYP2D6 confuses the matter. A study designed to investigate the impact of CYP2D6-guided dosing on therapeutic outcomes (e.g., antidepressant effect or adverse effect) could prove helpful. Thus, some prospective studies could be useful to prove the case for pharmacogenetic testing. However, it would be foolish to demand prospective studies in all cases. Once a few examples have been established as useful, others with similarities could be assumed to follow the same course.
There has been an enormous amount of work done in the field of pharmacogenetics and many promises made about a new era in dose individualisation. However, genetic profiling currently improves the therapeutics of very few drugs. The challenge now is to develop robust assessment and testing processes to clarify which other drugs could also benefit. Until then, pharmacogenetics will remain a nice idea that has little practical reality.
Footnotes
-
↵1 Abbreviations: P450, cytochrome P450; EM, extensive metabolizer; PM, poor metabolizer; IM, intermediate metabolizer; UM, ultrarapid metabolizer; AUC, area under the concentration-time curve; TCA, tricyclic antidepressant; SSRI, selective serotonin reuptake inhibitor; QTc, heart-rated corrected QT interval; CI, confidence interval; INR, international normalized ratio; NSAID, nonsteroidal anti-inflammatory drug; GI, gastrointestinal; HPPH, 5-(4-p-hydroxyphenyl)-5-phenylhydantoin; PPI, proton pump inhibitor; HIV, human immunodeficiency virus; FDA, Food and Drug Administration; NAT2, N-acetyltransferase type 2; BChE, butyrylcholinesterase; TPMT, thiopurine methyltransferase; 6-MP, 6-mercaptopurine; 6-TGN, 6-thioguanine nucleotide; 6-MMP, 6-methylmercaptopurine; DHPD, dihydropyrimidine dehydrogenase; PBM, peripheral blood mononuclear; 5-FU, 5-fluorouracil; UGT1A1, uridine diphosphate glucuronosyltransferase 1A1; SN-38, 7-ethyl-10-hydroxycamptothecin.
-
Funding was via a Top Achiever Doctoral (Tertiary Education Commission, New Zealand) scholarship (to S.G.). Article, publication date, and citation information can be found at http://pharmrev.aspetjournals.org.
-
doi:10.1124/pr.58.3.6.
- The American Society for Pharmacology and Experimental Therapeutics
References
- ↵
- ↵
- ↵
- ↵
- ↵
- ↵
- ↵
- ↵
- ↵
- ↵
- ↵
- ↵
- ↵
- ↵
- ↵
- ↵
- ↵
- ↵
- ↵
- ↵
- ↵
- ↵
- ↵
- ↵
- ↵
- ↵
- ↵
- ↵
- ↵
- ↵
- ↵
- ↵
- ↵
- ↵
- ↵
- ↵
- ↵
- ↵
- ↵
- ↵
- ↵
- ↵
- ↵
- ↵
- ↵
- ↵
- ↵
- ↵
- ↵
- ↵
- ↵
- ↵
- ↵
- ↵
- ↵
- ↵
- ↵
- ↵
- ↵
- ↵
- ↵
- ↵
- ↵
- ↵
- ↵
- ↵
- ↵
- ↵
- ↵
- ↵
- ↵
- ↵
- ↵
- ↵
- ↵
- ↵
- ↵
- ↵
- ↵
- ↵
- ↵
- ↵
- ↵
- ↵
- ↵
- ↵
- ↵
- ↵
- ↵
- ↵
- ↵
- ↵
- ↵
- ↵
- ↵
- ↵
- ↵
- ↵
- ↵
- ↵
- ↵
- ↵
- ↵
- ↵
- ↵
- ↵
- ↵
- ↵
- ↵
- ↵
- ↵
- ↵
- ↵
- ↵
- ↵
- ↵
- ↵
- ↵
- ↵
- ↵
- ↵
- ↵
- ↵
- ↵
- ↵
- ↵
- ↵
- ↵
- ↵
- ↵
- ↵
- ↵
- ↵
- ↵
- ↵
- ↵
- ↵
- ↵
- ↵
- ↵
- ↵
- ↵
- ↵
- ↵
- ↵
- ↵
- ↵
- ↵
- ↵
- ↵
- ↵
- ↵
- ↵
- ↵
- ↵
- ↵
- ↵
- ↵
- ↵
- ↵
- ↵
- ↵
- ↵
- ↵
- ↵
- ↵
- ↵
- ↵
- ↵
- ↵
- ↵
- ↵
- ↵
- ↵
- ↵
- ↵
- ↵
- ↵
- ↵
- ↵
- ↵
- ↵
- ↵
- ↵
- ↵
- ↵
- ↵
- ↵
- ↵
- ↵
- ↵
- ↵
- ↵
- ↵
- ↵
- ↵
- ↵
- ↵
- ↵
- ↵
- ↵
- ↵
- ↵
- ↵
- ↵
- ↵
- ↵
- ↵
- ↵
- ↵
- ↵
- ↵
- ↵
- ↵
- ↵
- ↵
- ↵
- ↵
- ↵
- ↵
- ↵
- ↵
- ↵
- ↵
- ↵
- ↵
- ↵
- ↵
- ↵
- ↵
- ↵
- ↵
- ↵
- ↵
- ↵
- ↵
- ↵
- ↵
- ↵
- ↵
- ↵
- ↵
- ↵
- ↵
- ↵
- ↵
- ↵
- ↵
- ↵
- ↵
- ↵
- ↵
- ↵
- ↵
- ↵
- ↵
- ↵
- ↵
- ↵
- ↵
- ↵
- ↵
- ↵
- ↵
- ↵
- ↵
- ↵
- ↵
- ↵
- ↵
- ↵
- ↵
- ↵
- ↵
- ↵
- ↵
- ↵
- ↵
- ↵
- ↵
- ↵
- ↵
- ↵
- ↵
- ↵
- ↵
- ↵
- ↵
- ↵
- ↵
- ↵
- ↵
- ↵
- ↵
- ↵
- ↵
- ↵
- ↵
- ↵
- ↵
- ↵
- ↵
- ↵
- ↵
- ↵
- ↵
- ↵
- ↵
- ↵
- ↵
- ↵
- ↵
- ↵
- ↵
- ↵
- ↵
- ↵
- ↵
- ↵
- ↵
- ↵
- ↵
- ↵
- ↵
- ↵
- ↵
- ↵
- ↵
- ↵
- ↵
- ↵
- ↵
- ↵
- ↵
- ↵
- ↵
- ↵
- ↵
- ↵
- ↵
- ↵
- ↵
- ↵
- ↵
- ↵
- ↵
- ↵
- ↵
- ↵
- ↵
- ↵
- ↵
- ↵
- ↵
- ↵
- ↵
- ↵
- ↵
- ↵
- ↵
- ↵
- ↵
- ↵
- ↵
- ↵
- ↵
- ↵
- ↵
- ↵
- ↵
- ↵
- ↵
- ↵
- ↵
- ↵
- ↵
- ↵
- ↵
- ↵
- ↵
- ↵
- ↵
- ↵
- ↵
- ↵
- ↵
- ↵
- ↵
- ↵
- ↵
- ↵
- ↵
- ↵
- ↵
- ↵
- ↵
- ↵
- ↵
- ↵
- ↵
- ↵
- ↵
- ↵
- ↵
- ↵
- ↵
- ↵
- ↵
- ↵
- ↵
- ↵
- ↵
- ↵
- ↵
- ↵
- ↵
- ↵
- ↵
- ↵
- ↵
- ↵
- ↵
- ↵
- ↵
- ↵
- ↵
- ↵
- ↵
- ↵
- ↵
- ↵
- ↵
- ↵
- ↵
- ↵
- ↵
- ↵
- ↵
- ↵
- ↵
- ↵
- ↵
- ↵
- ↵
- ↵
- ↵
- ↵
- ↵
- ↵
- ↵
- ↵
- ↵
- ↵
- ↵
- ↵
- ↵
- ↵
- ↵
- ↵
- ↵
- ↵
- ↵
- ↵
- ↵
- ↵
- ↵
- ↵
- ↵
- ↵
- ↵
- ↵
- ↵
- ↵
- ↵
- ↵
- ↵
- ↵
- ↵
- ↵
- ↵
- ↵
- ↵
- ↵
- ↵
- ↵
- ↵
- ↵
- ↵
- ↵
- ↵
- ↵
- ↵
- ↵
- ↵
- ↵
- ↵
- ↵
- ↵
- ↵
- ↵
- ↵
- ↵
- ↵
- ↵
- ↵
- ↵
- ↵
- ↵
- ↵
- ↵
- ↵
- ↵
- ↵
- ↵
- ↵
- ↵
- ↵
- ↵
- ↵
- ↵
- ↵
- ↵
- ↵
- ↵
- ↵
- ↵
- ↵
- ↵
- ↵
- ↵
- ↵
- ↵
- ↵
- ↵
- ↵
- ↵
- ↵
- ↵
- ↵
- ↵
- ↵
- ↵
- ↵
- ↵
- ↵
- ↵
- ↵
- ↵
- ↵
- ↵
- ↵
- ↵
- ↵
- ↵
- ↵
- ↵
- ↵
- ↵
- ↵
- ↵
- ↵
- ↵
- ↵
- ↵
- ↵
- ↵
- ↵
- ↵
- ↵
- ↵
- ↵
- ↵
- ↵
- ↵
- ↵
- ↵
- ↵
- ↵
- ↵
- ↵
- ↵
- ↵
- ↵
- ↵
- ↵
- ↵
- ↵
- ↵
- ↵
- ↵
- ↵
- ↵
- ↵
- ↵
- ↵
- ↵
- ↵
- ↵
- ↵
- ↵
- ↵
- ↵
- ↵
- ↵
- ↵
- ↵
- ↵
- ↵
- ↵
- ↵
- ↵
- ↵
- ↵
- ↵
- ↵
- ↵
- ↵
- ↵
- ↵
- ↵
- ↵
- ↵
- ↵
- ↵
- ↵
- ↵
- ↵
- ↵
- ↵
- ↵
- ↵
- ↵
- ↵
- ↵
- ↵
- ↵
- ↵
- ↵
- ↵
- ↵
- ↵
- ↵
- ↵
- ↵
- ↵
- ↵
- ↵
- ↵
- ↵
- ↵
- ↵
- ↵
- ↵
- ↵
- ↵
- ↵
- ↵
- ↵
- ↵
- ↵
- ↵
- ↵
- ↵
- ↵
- ↵
- ↵
- ↵
- ↵
- ↵
- ↵
- ↵
- ↵
- ↵
- ↵
- ↵
- ↵
- ↵
- ↵
- ↵
- ↵
- ↵
- ↵
- ↵
- ↵
- ↵
- ↵
- ↵
- ↵
- ↵
- ↵
- ↵
- ↵
- ↵
- ↵
- ↵
- ↵
- ↵
- ↵
- ↵
- ↵
- ↵
- ↵
- ↵
- ↵
- ↵
- ↵
- ↵
- ↵
- ↵
- ↵
- ↵
- ↵
- ↵
- ↵
- ↵
- ↵
- ↵
- ↵
- ↵
- ↵
- ↵
- ↵
- ↵
- ↵
- ↵
- ↵
- ↵
- ↵
- ↵
- ↵
- ↵
- ↵
- ↵
- ↵
- ↵
- ↵
- ↵
- ↵
- ↵
- ↵
- ↵
- ↵
- ↵
- ↵
- ↵
- ↵
- ↵
- ↵
- ↵
- ↵
- ↵
- ↵
- ↵
- ↵
- ↵
- ↵
- ↵
- ↵
- ↵
- ↵
- ↵
- ↵
- ↵
- ↵
- ↵
- ↵
- ↵
- ↵
- ↵
- ↵
- ↵
- ↵
- ↵
- ↵
- ↵
- ↵
- ↵
- ↵
- ↵
- ↵
- ↵
- ↵
- ↵
- ↵
- ↵
- ↵
- ↵
- ↵
- ↵
- ↵
- ↵
- ↵
- ↵
- ↵
- ↵
- ↵
- ↵
- ↵
- ↵
- ↵
- ↵
- ↵
- ↵
- ↵
- ↵
- ↵
- ↵
- ↵
- ↵
- ↵
- ↵
- ↵
- ↵
- ↵
- ↵
- ↵
- ↵
- ↵
- ↵
- ↵
- ↵
- ↵
- ↵
- ↵
- ↵
- ↵
- ↵
- ↵
- ↵
- ↵
- ↵
- ↵
- ↵
- ↵
- ↵
- ↵
- ↵
- ↵
- ↵
- ↵
- ↵
- ↵
- ↵
- ↵
- ↵
- ↵
- ↵
- ↵
- ↵
- ↵
- ↵
- ↵
- ↵
- ↵
- ↵
- ↵
- ↵
- ↵
- ↵
- ↵
- ↵
- ↵
- ↵
- ↵
- ↵
- ↵
- ↵
- ↵
- ↵
- ↵
- ↵
- ↵
- ↵
- ↵
- ↵
- ↵
- ↵
- ↵
- ↵
- ↵
- ↵
- ↵
- ↵
- ↵
- ↵
- ↵
- ↵
- ↵
- ↵
- ↵
- ↵
- ↵
- ↵
- ↵
- ↵
- ↵
- ↵
- ↵
- ↵
- ↵
- ↵
- ↵
- ↵
- ↵
- ↵
- ↵
- ↵
- ↵
- ↵
- ↵
- ↵
- ↵
- ↵
- ↵
- ↵
- ↵
- ↵
- ↵
- ↵
- ↵
- ↵
- ↵
- ↵
- ↵
- ↵
- ↵
- ↵
- ↵
- ↵
- ↵
- ↵
- ↵
- ↵
- ↵
- ↵
- ↵
- ↵
- ↵
- ↵
- ↵
- ↵
- ↵
- ↵
- ↵
- ↵
- ↵
- ↵
- ↵
- ↵
- ↵
- ↵


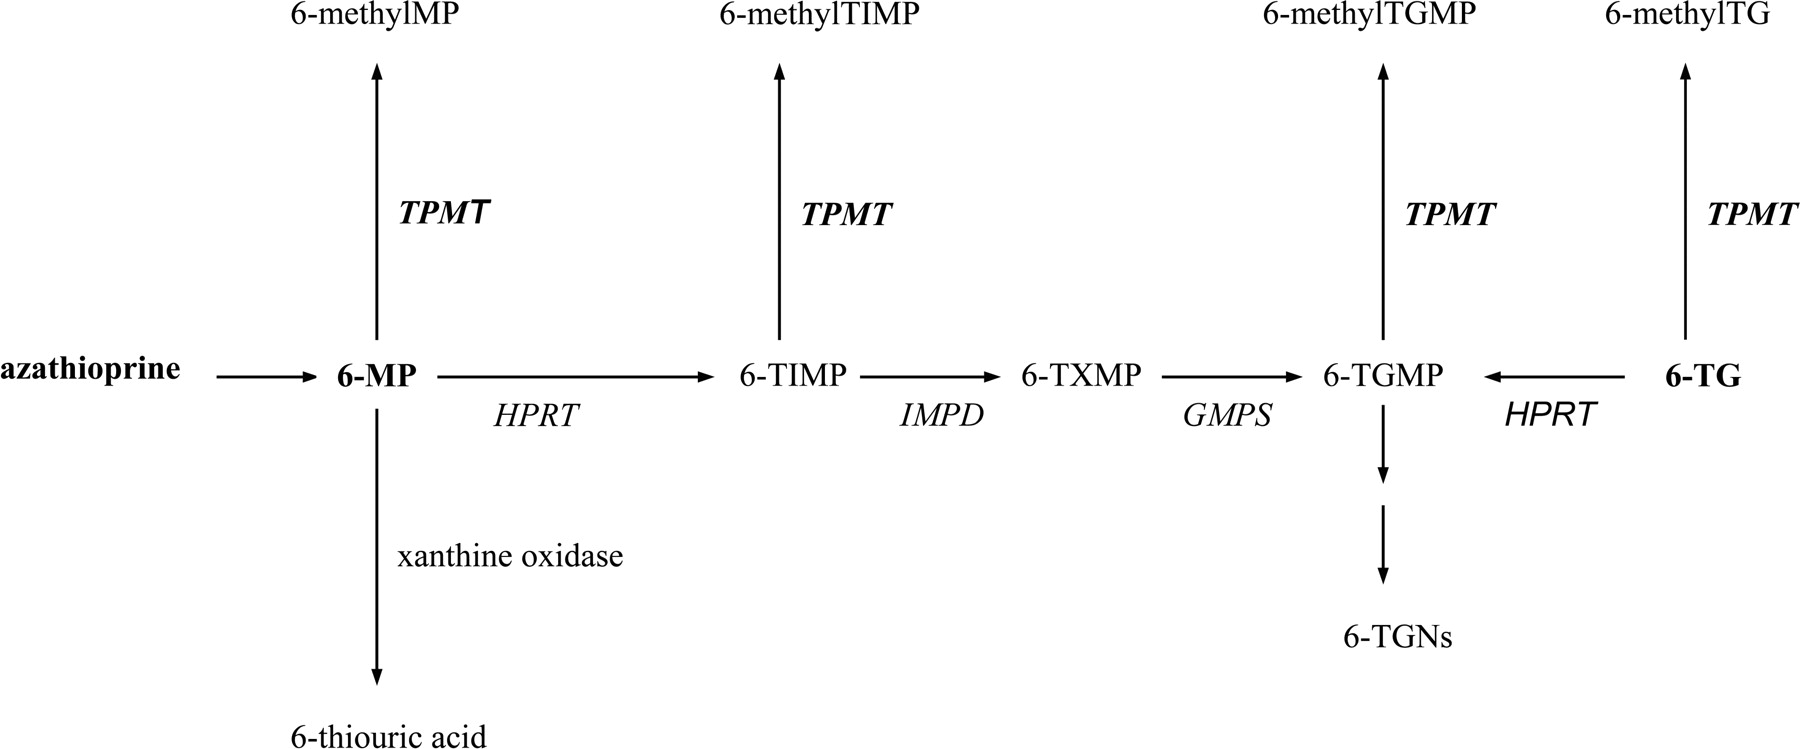