


Abstract
3,3′-Diindolylmethane (DIM) is a naturally occurring indole, which is currently under investigation as a potential chemopreventive agent. The concentrations of DIM in plasma, liver, kidney, lung, heart, and brain tissues were determined following oral administration of two different formulations to mice (250 mg/kg). Mice were sacrificed periodically from 0 to 24 h after administration of either a crystalline or an absorption-enhanced formulation (Bio-Response-DIM; Indolplex) of DIM, and plasma and tissue concentrations were determined by high-performance liquid chromatography (UV detection, 280 nm). A physiologically based pharmacokinetic (PBPK) model was developed to characterize the pharmacokinetic properties of the two different formulations. The final model included parameters reflecting linear first-order absorption, systemic clearance, and distributional clearance in the remainder compartment, which were considered independent of formulation. All pharmacokinetic profiles from the two formulations were fitted simultaneously to estimate unknown model parameters. Plasma and tissue concentration-time profiles exhibited a rapid rise to peak values at 0.5 to 1 h, followed by a polyexponential decline with an extended terminal phase. These profiles were well described by the final model and unknown parameters were estimated with relatively low coefficients of variation. Relative drug exposure and absorption parameters suggest that BioResponse-DIM exhibited approximately 50% higher bioavailability than the crystalline formulation. Clearance of DIM was estimated as 7.18 ml/h. This is the first study to characterize the pharmacokinetics of DIM in mice, and the established PBPK model should prove useful in the design and analysis of future preclinical studies aimed at evaluating the in vivo pharmacological effects of DIM.
3,3′-Diindolylmethane (DIM1) is formed from its immediate precursor indole-3-carbinol (I3C), a natural constituent derived from cruciferous vegetables such as broccoli, Brussels sprouts, and cauliflower (Fig. 1). On exposure to acidic conditions, I3C undergoes condensation to several products, including DIM (Bradfield and Bjeldanes, 1987; Grose and Bjeldanes, 1992; Anderton et al., 2003a), and studies in rodents have shown I3C to exert its activity only when given by the oral route and not by i.p. injection, which bypasses stomach acid (Bradfield and Bjeldanes, 1987; Park and Bjeldanes, 1992). After oral administration of I3C to humans, DIM can be detected in the plasma (Arneson et al., 1999) and urine (Sepkovic et al., 2001). Additionally, DIM has been detected in the plasma (Anderton et al., 2003a,b), liver (De Kruif et al., 1991; Stresser et al., 1995b; M. J. Anderton, M. M. Manson, R. D. Verschoyle, A. Gescher, J. H. Lamb, P. B. Farmer, W. P. Steward, and M. L. Williams, unpublished data), kidney, lung, heart, and brain (M. J. Anderton, M. M. Manson, R. D. Verschoyle, A. Gescher, J. H. Lamb, P. B. Farmer, W. P. Steward, and M. L. Williams, unpublished data) of rodents, and in the liver of rainbow trout (Dashwood et al., 1989), all following oral administration of I3C. I3C is reported to exert chemopreventive activity, particularly in the breast (Bradlow et al., 1991; Grubbs et al., 1995), cervix (Yuan et al., 1999; Bell et al., 2000; Chen et al., 2001), and endometrium (Leong et al., 2001), but it has been suggested that the biological effects of I3C may be attributable, at least partially, to DIM. DIM has been shown to exhibit promising cancer-protective activities in its own right, inhibiting growth of mammary tumors in rodents (Wattenberg and Loub, 1978; Chen et al., 1998). In vitro, DIM is able to cause cell cycle arrest and induce apoptosis in human breast (Ge et al., 1996; Hong et al., 2002), prostate (Nachshon-Kedmi et al., 2003), colon (Bonnesen et al., 2001), and cervical (Chen et al., 2001) cancer cells. Both I3C and DIM (to a lesser extent) have been shown to selectively induce cytochrome P450 activity (Park and Bjeldanes, 1992; Manson et al., 1998; Leibelt et al., 2003) and to up-regulate the 2-hydroxylation pathway of estradiol (Michnovicz and Bradlow, 1991; Jellinck et al., 1993; Bradlow et al., 1994), a phenomenon that is hypothesized to contribute to the chemopreventive activity of these compounds, particularly in the breast.

Molecular structures of indole-3-carbinol (A) and 3,3′-diindolylmethane (B).
Despite the fact that DIM is stable under acidic conditions (Grose and Bjeldanes, 1992), the administration of DIM to female Sprague-Dawley rats by the i.p. route resulted in greater induction of the cytochromes P450 responsible for estradiol 2-hydroxylation as compared with the oral route (Jellinck et al., 1993). Attempting to augment DIM bioavailability, a patented formulation of DIM has been developed [BioResponse-DIM (BR-DIM); Indolplex] that utilizes solubility-enhancing microencapsulation technology (Zeligs and Jacobs, 2000; Zeligs et al., 2002). BR-DIM encases small particles of DIM within a water-soluble matrix, containing α-tocopherol polyethylene glycol succinate and phosphatidyl choline. In a preliminary study in humans, this formulation appears to increase blood levels of DIM over the crystalline dosage form (Jacobs and Zeligs, 2000).
Limited information exists on the pharmacokinetics of DIM, either formulated or unformulated. A high-performance liquid chromatography method has been developed recently for the analysis of I3C and its major condensation products, including DIM (Anderton et al., 2003a). In the present study, a physiologically based pharmacokinetic (PBPK) model was developed using plasma and tissue (brain, heart, liver, kidneys, lungs) concentration data for DIM to compare the pharmacokinetic properties and biodistribution of pure crystalline and a novel formulation (BioResponse-DIM) of DIM after oral administration to mice. In contrast to traditional empirical pharmacokinetic models, PBPK models are structured based on anatomical compartments (tissue volumes) and intercompartmental blood flow, as well as the biochemical and physiochemical (partition coefficients) properties of the specific compounds of interest. This approach has been proven extremely useful for studying the pharmacokinetics of compounds and for extrapolating dose-response relationships between species, routes of administration, and various dosing regimens (Nestorov, 2003).
Materials and Methods
Drugs and Chemicals. DIM (99.5% purity) was purchased from LKT Laboratories, Inc. (St. Paul, MN). BioResponse-DIM was a gift from Dr. Michael Zeligs (BioResponse, LLC, Boulder, CO). Acetonitrile, tert-butyl methyl ether (both HPLC grade), HEPES sodium salt, and the internal standard 4-methoxy-indole were purchased from Sigma Chemical (Poole, Dorset, UK). Corn oil and all other solvents were of analytical grade from Fisher Scientific (Loughborough, Leicestershire, UK). Water used in the preparation of all reagents and mobile phase was obtained from an ultrapure water system (ELGA, Buckinghamshire, UK).
Animals. Female CD-1 mice weighing 28.5 ± 1.8 g, obtained from Harlan UK (Bicester, UK), were used in the experiment. During the acclimation period (1 week) mice were housed in Moredun Isolators (Moredun Animal Health, Edinburgh,UK) under negative pressure with a 12-h light/dark cycle; temperature range, 20–23°C; humidity, 40 to 60%. The mice were provided with pellet RM1 maintenance diet and water ad libitum before and during the experiment. The experimental protocol was approved by the University of Leicester Ethical Committee for Animal Experimentation and carried out under Home Office Project license 80/1250.
Pharmacokinetic Studies. Mice were gavaged with DIM (250 mg/kg) or 833 mg/kg BioResponse-DIM (delivering 250 mg/kg diindolylmethane; 30% diindolylmethane is contained within the formulation) as a suspension in corn oil (10 ml/kg body weight). Cohorts of four animals were sacrificed by cardiac exsanguination under halothane anesthesia at 0.25, 0.5, 0.75, 1, 2, 4, 6, and 24 h after dosing. Blood samples were collected into heparinized rinsed syringes and placed in heparinized tubes. The plasma fraction was immediately separated by centrifugation (5 min; 10,000g) and stored at -80°C until analysis. After exsanguination, liver, kidney, lung, heart, and brain were immediately removed, wrapped in aluminum foil, snap-frozen in liquid nitrogen, and stored at -80°C until analysis.
Analytical Method. Plasma samples were analyzed by a method that has been previously validated for 3,3′diindolylmethane and other acid condensation products of I3C (Anderton et al., 2003a). Briefly, internal standard (4-methoxy-indole; 2.5 μl of a 0.4 mg/ml solution) was added to 250-μl plasma samples. The samples were vortex-mixed and equilibrated at room temperature for 30 min before extraction twice with tert-butyl methyl ether (750 μl) involving 2 min of vortexing on each occasion. Subsequent to each extraction, the organic and aqueous layers were separated by centrifugation (2800g; 10 min), and the organic (top) layers were transferred to fresh 4-ml tubes. The top layers of each extraction were combined, and the tert-butyl methyl ether evaporated to dryness in the presence of 15 μl of DMSO. The extracted sample in DMSO was then diluted using acetonitrile/50 mM HEPES buffer at pH 7.4 (40:60 v/v; 135 μl) and transferred to a glass vial insert for analysis by HPLC.
Each tissue was thawed, blotted dry, weighed, and homogenized (1:1 w/v) in 50 mM HEPES buffer at pH 7.4, using an Ystral X 10/20 homogenizer (D-79282; Ystral GmBH, Ballrechten-Dottingen, Germany). Aliquots (250 μl) of the tissue homogenate mixture were transferred into clean 4-ml tubes, with the exception of heart, where 200 μl was used because of the small amount of tissue available. To the homogenate was added internal standard (4-methoxyindole, 2.5 μl of 0.4 mg/ml), and samples were equilibrated on ice for 30 min. Acetonitrile (750 μl) was added to each sample and vortex-mixed for 2 min. Samples were then stored on ice for 5 min before being vortex-mixed again for another 2 min. The tissue and solvent were separated by centrifugation (2800g; 10 min), and the supernatant was transferred to a fresh tube. The supernatant was evaporated to dryness at room temperature in the presence of 15 μl of DMSO under a stream of nitrogen gas. The residue was resuspended in acetonitrile/50 mM HEPES buffer at pH 7.4 (40:60 v/v; 135 μl) and transferred to a clean 0.5-ml Eppendorf tube. The turbidity was removed by centrifugation (5 min; 10,000g), and the supernatant was transferred to a glass vial insert before analysis by HPLC. Calibration curves were prepared for lung, heart, brain, kidney (0.1–50 μg/g), and liver (0.1–100 μg/g). All calibration curves were prepared and sample concentrations determined by the internal standard method as described previously for plasma (Anderton et al., 2003a). All curves were found to be linear (r2 > 0.99) in the range investigated and the extraction efficiency was greater than 70% for all tissues.
Liquid Chromatography Analysis of Plasma and Tissue Samples. HPLC analysis of plasma and tissue samples was performed on a Varian Prostar HPLC system (Varian Ltd., Surrey, UK). The system consisted of a 230 pump, a 410 autosampler, and a 310 UV detector. Fifty microliters of extracted plasma or tissue sample was injected into the HPLC system. Chromatography was achieved using a Waters Symmetry RP 18 (4.6 × 50 mm, 5 μm) column (Waters, Hertford, UK) in tandem with a Thermoquest BDS C18 (250 × 4.6, 5 μm) column (Thermoquest, Runcorn, UK) and a Phenomenex C18 ODS (4 mm × 3 mm) guard column (Phenomenex, Cheshire, UK). The mobile phase consisted of acetonitrile-water, and solutes were eluted using a flow rate of 1.0 ml/min and a steady gradient starting at 15% acetonitrile at 0 time, taken to 60% acetonitrile over the next 20 min, rising to 65% acetonitrile from 20 to 40 min, and reaching 85% acetonitrile at the final time of 65 min. The column was re-equilibrated at initial conditions for 5 min before the next analysis. The analyte was quantified by UV detection at 280 nm.
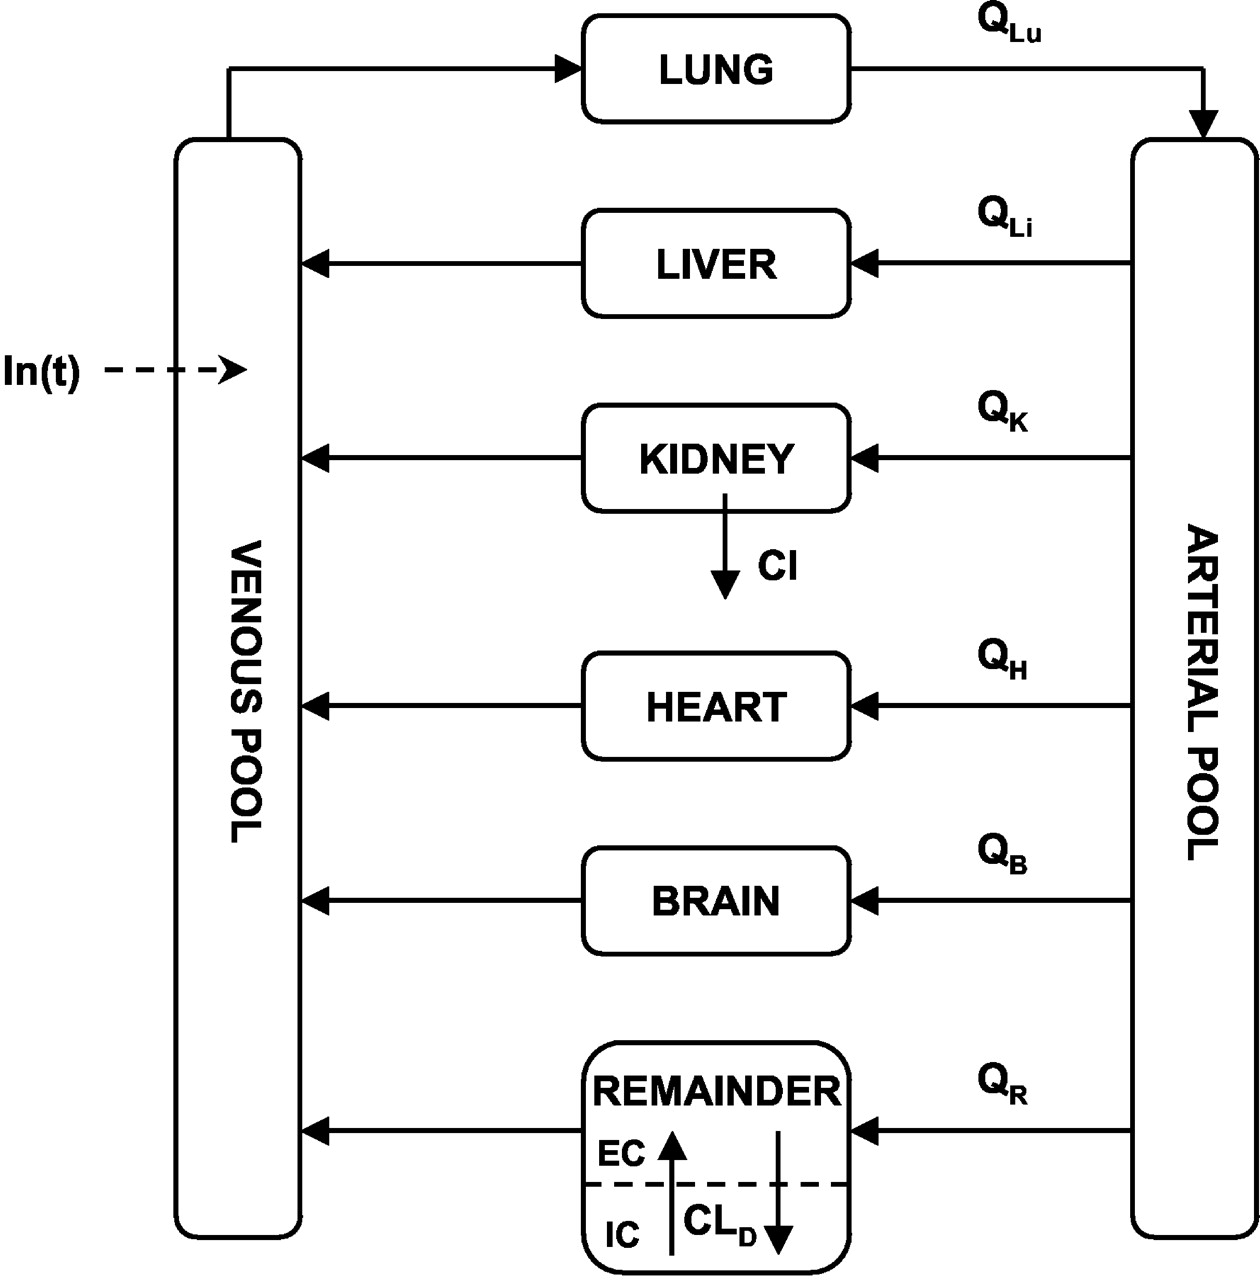
Physiologically Based Pharmacokinetic Model. A schematic of the PBPK model used to characterize the biodistribution and pharmacokinetics of DIM is shown in Fig. 2. The model diagram shows separate compartments for each assayed tissue and the arterial and venous plasma pools. These are assumed to be well mixed compartments, and drug concentration in venous plasma emerging from a tissue is considered to be in equilibrium with that in the tissue (Gibaldi and Perrier, 1982). The rate of change of drug concentration in these compartments is given by the following mass-balance differential equations: Lung (Lu):  Liver (Li):
  Kidney (K):
  Heart (H):
  Brain (B):
  Arterial Pool (Ap):
  Venous Pool (Vp):
  where Q is blood flow, V is tissue weight or volume, P is the tissue-plasma partition coefficient, In(t) represents the drug input function, Cl is systemic drug clearance, and R represents the remainder compartment (defined below). The initial conditions for eqs. 1 to 7 were all set to zero. The blood flow and tissue weights or volumes were obtained from the literature and are listed in Table 1. Ideally, the tissue-plasma partition coefficients would be obtained from the ratio of tissue and plasma concentrations at steady state. In the absence of this information, partition coefficients were estimated using two separate methods: 1) the tissue-plasma ratio of area under the concentration curves, and 2) the slope of linear plots of tissue versus plasma concentrations (based on the assumption of rapid equilibrium). These techniques resulted in very similar values, which were independent of formulation, and partition coefficients used in model fitting were fixed to values obtained from the second method (Table 1). The drug input function describing the absorption of DIM after oral administration was defined as a linear first-order process:
  where ka is a first-order absorption rate constant, t is time, and F′ represents an empirical bioavailability factor that bears no relationship to the true bioavailability of DIM. Separate ka and F′ parameters were used for each formulation, initially; however, a single ka was eventually implemented based on model-fitting criteria (see Data Analysis).

Physiologically based model for the pharmacokinetics of 3,3′-diindolylmethane in mice. Blood flows (Q) and tissue volumes are listed in Table 1, and all nonassayed tissues are combined into the remainder compartment, which is subdivided into extracellular (EC) and intracellular (IC) spaces. Symbols are defined in the text.
Fixed parameters for physiological model of DIM in mice
All nonsampled tissues were lumped together into a remainder compartment, which is common for most PBPK models (Gibaldi and Perrier, 1982). Initial attempts to describe this compartment in a manner similar to that used for tissues such as heart, liver, and brain failed to characterize the polyexponential profiles of DIM. The final model shown in Fig. 2 depicts the remainder compartment as exhibiting membrane-limited characteristics, under the hypothesis that the heterogeneity of the tissues comprising this compartment may be responsible for such polyexponential behavior. Thus, the remainder compartment was divided into apparent extracellular (EC) and intracellular (IC) spaces, and the rate of change of DIM concentrations in these subcompartments was described using the following system of equations: 
 where β represents the extracellular fraction of the remainder volume and ClD is the pseudoeffective distributional clearance. The initial conditions for these equations were set to zero, and the blood flow and volume parameters were fixed to values listed in Table 1. Several different values of β ranging from 0.01 to 0.04 were evaluated, and this parameter was fixed to 0.03 in the final analysis, which is consistent with extracellular volumes of slowly perfused tissues (Brown et al., 1997). This essentially incorporates an open two-compartment model with volumes constrained by physiological limits. Thus, the unknown model parameters to be obtained from model fitting were: ka, F′1, F′2, ClD, and Cl.
Data Analysis. The proposed model (Fig. 2) was fitted simultaneously to the mean concentration-time profiles from both formulations. Accordingly, two sets of the above nine equations were used to fit the model to the 12 pharmacokinetic profiles (6 sampled tissues × 2 formulations). The unknown model parameters were estimated using the maximum-likelihood estimator in the ADAPT II computer program (D'Argenio and Schumitzky, 1997), and the variance model was defined as:  where σi are the variance model parameters, and Y is the model-predicted concentration. The goodness-of-fit was assessed by algorithm convergence, Akaike Information Criterion and Schwarz Criterion, estimator criterion value for the maximum-likelihood method in ADAPT II, examination of residuals, and visual inspection.
Results
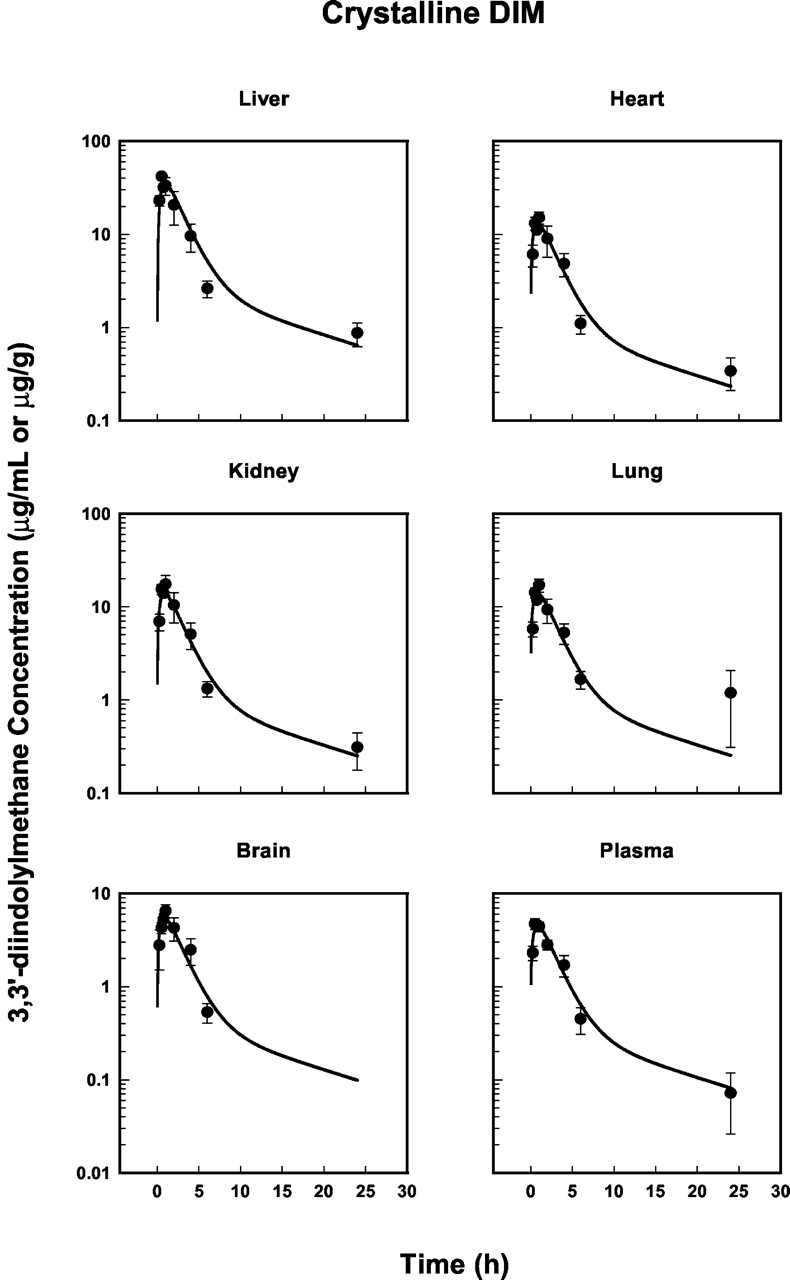
The mean DIM concentration-time profiles in the sampled tissues for the BR-DIM and crystalline formulations are shown in Figs. 3 and 4. All tissues show a rapid rise in drug concentration to a maximum value at approximately 0.5 to 1 h, followed by a polyexponential decline with a relatively long terminal phase. Drug concentrations in the liver, heart, kidney, and lung were significantly higher than those in plasma for both formulations, with the highest concentrations observed in the liver. In contrast, the pharmacokinetic profiles in brain tissue were quantitatively similar to the time course of plasma concentrations for both formulations. Despite concentrations in the brain being slightly higher than in plasma at all time points up to and including 6 h, DIM could not be detected in any of the brain samples at 24 h. It is possible that DIM is subject to efflux transport at the blood-brain barrier, having molecular properties in common with P-glycoprotein substrates, for example (Stauch and Gudmundsson, 2002), thus limiting brain tissue exposure. The absorption-enhanced formulation resulted in higher DIM concentrations in all tissues. The areas under the concentration-time curves (AUCs) shown in Figs. 3 and 4 are listed in Table 2. BR-DIM to crystalline AUC ratios reveal a 1.34- to 1.60-fold increase in the net exposure to DIM upon comparing the two formulations (Table 2).

Plasma and tissue concentration-time profiles of 3,3′-diindolylmethane following an oral dose (250 mg/kg) of crystalline DIM in mice. Solid circles represent mean concentrations (±S.E.; n = 4/time point) and the lines are model-fitted profiles resulting from the simultaneous fitting of all data in Figs. 3 and 4.

Time course of 3,3′-diindolylmethane concentrations in plasma and tissues as in Fig. 3 except for the BR-DIM formulation.
Net Exposure Following an Oral Dose (250 mg/kg) of formulated or crystalline DIM in Mice
The mean pharmacokinetic data in Figs. 3 and 4 were fitted simultaneously with the PBPK model shown in Fig. 2. The calculated tissue-plasma partition coefficients (P) were fixed during model fitting and are listed in Table 1. The coefficient for liver tissue was the highest (7.84), whereas values for lung, kidney, and heart were similar (about 3.0). The calculated P value for brain was only slightly higher than unity. The model-fitted profiles are shown also in Figs. 3 and 4, and demonstrate good agreement with the experimental data. These profiles result from the estimation of formulation-independent (ka, ClD, and Cl) and -dependent (F′) parameters, which are listed in Table 3. The relatively low CV% values are also indicative of good model fitting. The higher CV% of the ClD parameter is most likely due to sparse sampling in the terminal phase. The relative apparent bioavailability (F′2/F′1 = 1.61) is consistent with AUC ratios (Table 2) and appears responsible for the increased net exposure to DIM following BR-DIM administration, since a single formulation-independent clearance parameter was estimated reliably (low CV%).
Final estimated PBPK model parameters
Discussion
The plasma pharmacokinetics and biodistribution of DIM following oral administration of two formulations in mice have been reported and characterized using a PBPK model, with the simultaneous fitting of all pharmacokinetic profiles (Figs. 3 and 4). Initial model construction began with the basic principles of blood flow rate-limited PBPK models and the typical practice of combining nonsampled tissues into a remainder or “rest of body” compartment (Gibaldi and Perrier, 1982). However, subdividing this compartment into two distinct spaces was required to fit the data accurately and capture the poly-exponential disposition of the drug (Fig. 2; eq. 9). Although this scheme resembles a combined blood flow and membrane-limited uptake model (Blakey et al., 1997), it simply imparts biexponential properties on the remainder compartment (which is comprised of a heterogeneous group of tissues) and is not meant to imply that DIM exhibits such uptake characteristics in these nonassayed tissues. This modification to an otherwise classical PBPK model was sufficient to describe the resulting concentration-time profiles (Figs. 3 and 4) and estimate the unknown model parameters with good precision (Table 3).
Several alternative model structures were evaluated in an attempt to describe the remainder compartment in more complete or mechanistic terms. For example, separate compartments were added representing muscle and adipose tissues as shown in Fig. 5. The differential equations for these compartments and the remainder were similar to those for liver, heart, and brain (eqs. 2, 4, and 5), where the blood flows and tissue volumes for muscle and adipose tissue were obtained from the literature (Brown et al., 1997; remainder volume and flow were calculated by difference as before; see Table 1). Partition coefficients for muscle and adipose tissue were calculated using the estimated log octanol-water partition coefficient (4.15; mean of several values reported by ALOGPS2.1, http://vcclab.org) and a range of fraction unbound in plasma values (0.1–0.4) as described elsewhere (Poulin and Theil, 2002), whereas the coefficient for the remainder compartment was estimated during model fitting. Although this approach provided a degree of polyexponential behavior and tissue volumes accounted for a much larger fraction of the animal, the resulting pharmacokinetic profiles were unsatisfactory. In a separate analysis, the final model (Fig. 2) was modified to include a partition coefficient in the intracellular remainder compartment. Despite achieving a reasonable fit to the data, further examination showed that certain parameters were no longer uniquely identifiable. Interestingly, the absolute values of the F′ terms increased slightly when intracellular partitioning was allowed; however, their ratio remained constant around 1.6. Ultimately, the final model shown in Fig. 2 was determined to represent the simplest model structure with the ability to characterize DIM pharmacokinetics and biodistribution in the selected tissues observed for both formulations simultaneously.

Alternative model structure incorporating muscle and adipose compartments to the PBPK model shown in Fig. 2 , with the remainder replaced with a well stirred compartment (see text).
The drug input function to the final PBPK model reflects a first-order absorption process (ka) and additionally contains an apparent bioavailability term (F′) (eq. 8). Final estimated parameters suggest that the BioResponse-DIM (BR-DIM) formulation is absorbed to a greater extent relative to the crystalline form (F′2/F′1 = 1.61). This might result from the micron to submicron particle size of BR-DIM, which would provide a greater surface area available for drug absorption. The individual F′ parameters are considered apparent terms only, since true bioavailability can only be assessed via simultaneous pharmacokinetic modeling following both oral and intravenous drug administration. Nevertheless, crystalline DIM was found to exhibit low apparent oral bioavailability, as would be expected from its low aqueous and lipid solubility (Jacobs and Zeligs, 1999). Interestingly, the 1.6-fold increase in the apparent bioavailability of BR-DIM corresponds with the average of the formulated to crystalline AUC ratios listed in Table 2 (1.46 ± 0.10). Since all other model parameters, including the clearance of the drug, were formulation-independent, the improved relative bioavailability appears to be directly responsible for the increase in net DIM exposure. Extensive pharmacokinetic analyses have not previously been undertaken to compare the bioavailability of BR-DIM and the crystalline form in rodents or humans. However, higher concentrations of DIM were observed in the blood of humans who received the same dose of BR-DIM as the crystalline form (Jacobs and Zeligs, 2000), suggesting that an increased net exposure of DIM also occurs in humans following administration of BR-DIM compared with the crystalline form.
Systemic elimination of DIM was assumed to result from only renal mechanisms, and no metabolites of DIM were observed in the plasma or tissue samples (data not shown). It is possible that polar metabolites of DIM are formed and were either not extracted from samples or coeluted with the solvent front in the chromatogram run. The latter seems particularly unlikely since chromatograms of plasma samples were very clean and the size of the solvent fronts was consistent with those in blank plasma samples. A monohydroxylated metabolite of DIM has been tentatively identified in vitro (Stresser et al., 1995a) but, to our knowledge, has yet to be identified in vivo. Based on the retention time and the use of a similar gradient and identical solvent system and detection method, it is likely that this metabolite would have been detected in the present study had it been formed. In addition, DIM has been quantified in the urine of patients who received I3C and also in the urine of a patient who received DIM by the oral route (Sepkovic et al., 2001), supporting the notion that urinary excretion of unchanged DIM is a significant elimination pathway. Additional in vivo studies that include a suitable range of doses are required to further verify this basic assumption of the model and clarify the mechanism of elimination of DIM.
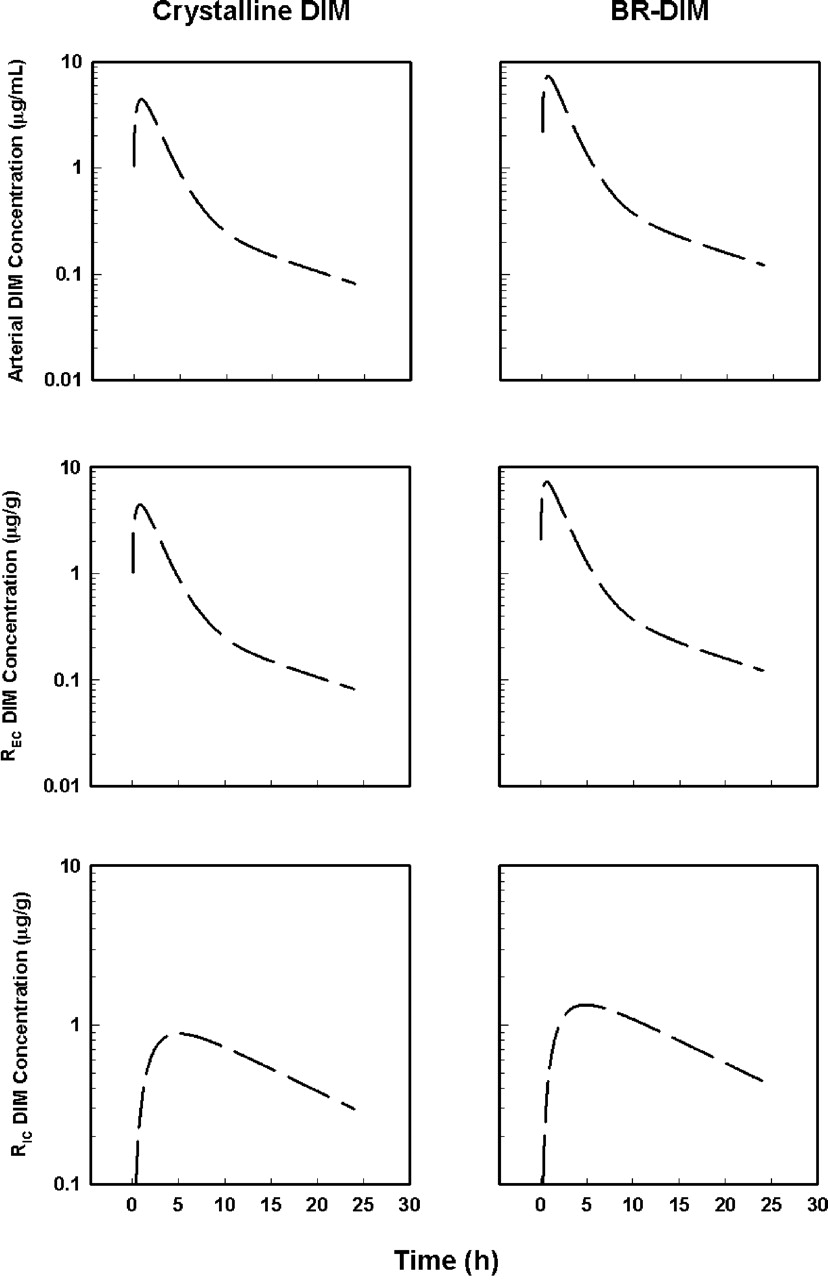
The PBPK model and the final estimated parameters were used to simulate the time course of DIM concentrations in the arterial and two remainder compartments for both formulations (Fig. 6). These pharmacokinetic profiles confirm that 1) drug concentrations in the arterial plasma pool and “shallow” remainder compartment are quantitatively similar and in rapid equilibrium with that in the venous plasma pool, and 2) DIM concentrations in the “deep” remainder compartment follow a reasonable and predictable pattern, increasing more slowly to peak values at approximately 4 to 5 h and decreasing in parallel with the terminal phase of DIM elimination in the sampled tissues. This property would be desirable, for example, in breast cancer chemoprevention and chemotherapy, where agents must reach deep compartments such as fat within breast tissue and maintain therapeutic concentrations. It remains to be determined whether DIM reaches the more slowly equilibrating tissues not sampled in this study as predicted by the PBPK model and the BR-DIM formulation results in different pharmacodynamic effects in preclinical cancer models.
In conclusion, a physiologically based pharmacokinetic model was developed to characterize the pharmacokinetic properties of a novel formulation (BR-DIM) and crystalline DIM after oral administration to mice. A classic blood flow-limited PBPK model was modified to include a subdivided remainder compartment to capture the polyexponential behavior of DIM disposition. The altered apparent absorption properties of BR-DIM appeared to be responsible for an average 1.5-fold increase in the net exposure of DIM in the sampled tissues. Future studies investigating the in vivo metabolic fate and pharmacological effects of DIM are required, and the final PBPK model developed here should aid in the design and analysis of such studies.
Acknowledgments
We thank Dr. Michael Zeligs for his kind gift of BioResponse-DIM.
Footnotes
-
↵1 Abbreviations used are: AUC, area under the concentration-time curve; BR-DIM, BioResponse (absorption enhanced) 3,3′-diindolylmethane; Cl, systemic clearance; ClD, pseudoeffective distributional clearance; DIM, 3,3′-diindolylmethane; DMSO, dimethyl sulfoxide; EC, extracellular fraction of remainder compartment; F′, apparent bioavailability; I3C, indole-3-carbinol; HPLC, high-performance liquid chromatography; IC, intracellular fraction of remainder compartment; ka, first-order absorption rate constant; PBPK, physiologically based pharmacokinetics; Q, blood flow; V, tissue volume.
-
This work was supported by the United Kingdom Medical Research Council and the Intramural Research Program of the National Institute on Aging.
- Received October 20, 2003.
- Accepted March 10, 2004.
- The American Society for Pharmacology and Experimental Therapeutics
References
DMD articles become freely available 12 months after publication, and remain freely available for 5 years.Non-open access articles that fall outside this five year window are available only to institutional subscribers and current ASPET members, or through the article purchase feature at the bottom of the page.
|


