


Abstract
Brain metastases are a major cause of mortality in patients with advanced melanoma. Adequate brain distribution of targeted agents for melanoma will be critical for treatment success. Recently, improvement in overall survival led to US Food and Drug Administration (FDA) approval of the v-raf murine sarcoma viral oncogene homolog B (BRAF) inhibitors, vemurafenib and dabrafenib, and the mitogen-activated protein kinase kinase-1 (MEK)-1/2 inhibitor, trametinib. However, brain metastases and emergence of resistance remain a significant problem. MEK-1/2 is downstream of BRAF in the mitogen-activated protein kinase (MAPK) signaling pathway, making it an attractive target to combat resistance. The recently approved combination of dabrafenib and trametinib has shown improvement in progression-free survival; however, adequate brain distribution of both compounds is required to effectively treat brain metastases. In previous studies, we found limited brain distribution of dabrafenib. The purpose of the current study was to investigate factors influencing the brain distribution of trametinib. In vitro studies indicated that trametinib is a substrate for both P-glycoprotein (P-gp) and Bcrp, efflux transporters found at the blood-brain barrier. In vivo studies in transgenic mouse models confirmed that P-gp plays an important role in restricting brain distribution of trametinib. The brain-to-plasma partition coefficient (AUCbrain/AUCplasma) was approximately 5-fold higher in Mdr1a/b(−/−) (P-gp knockout) and Mdr1a/b(−/−)Bcrp1(−/−) (triple knockout) mice when compared with wild-type and Bcrp1(−/−) (Bcrp knockout) mice. The brain distribution of trametinib was similar between the wild-type and Bcrp knockout mice. These results show that P-gp plays an important role in limiting brain distribution of trametinib and may have important implications for use of trametinib as single agent or in combination therapy for treatment of melanoma brain metastases.
Introduction
Melanoma is the deadliest skin cancer with a remarkably high propensity for brain metastasis. Approximately 94% of melanoma patients develop brain metastases within 3 years of diagnosis of primary melanoma, and more than 90% of these patients die from progressive disease (Fife et al., 2004). Patients with one to three brain metastases are often treated with surgical resection or radiosurgery, while those with multiple brain metastases typically receive whole brain irradiation (Gibney et al., 2012). Unfortunately, melanoma is resistant to radiation and chemotherapy, and patients with brain metastases have a median survival of about 4 months despite aggressive therapy (Sampson et al., 1998; Fife et al., 2004). Thus, identifying therapies specifically effective for melanoma brain metastases could provide significant benefit for these patients.
The recent discovery of activating mutations in the mitogen-activated protein kinase (MAPK) pathway in melanoma has led to significant advances in treatment options for metastatic melanoma. These activating mutations cause deregulated constitutive signaling via the MAPK pathway that stimulates nuclear translocation of phosphorylated extracellular signal-regulated kinase, subsequent gene transcription, and ultimately tumor growth and proliferation (McCubrey et al., 2008). BRAF (v-raf murine sarcoma viral oncogene homolog B) is mutated in greater than 50% of patients with metastatic melanoma (Davies et al., 2002). A majority of patients with BRAF mutations exhibit a valine to glutamic acid substitution at amino acid 600 (V600E; BRAFV600E) (Davies et al., 2002). The FDA-approved BRAF inhibitors (vemurafenib and dabrafenib) and a mitogen-activated protein kinase kinase (MEK) inhibitor, trametinib (GSK1120212; Fig. 1), have shown remarkable initial efficacy against peripheral BRAFV600E mutant tumors (Flaherty et al., 2010; Johannessen et al., 2010; Kim et al., 2010; Nazarian et al., 2010; Villanueva et al., 2010; Chapman et al., 2011; Gowrishankar et al., 2012). Vemurafenib and dabrafenib were both approved after showing a significant improvement in progression-free survival and overall survival compared with dacarbazine in phase 3 clinical trials (Chapman et al., 2011; Hauschild et al., 2012). Similarly to vemurafenib and dabrafenib, trametinib showed a 4.3-month progression-free survival compared with 1.5 months in the chemotherapy group in phase 3 clinical trials in patients with BRAFV600 mutations (Flaherty et al., 2012). Emergence of resistance to BRAF inhibitor therapy commonly occurs through hyperactivation of downstream MEK signaling, and concurrent therapy with the BRAF inhibitor dabrafenib and the MEK inhibitor trametinib significantly prolongs survival compared with single-agent therapy. Other mechanisms of BRAF-inhibitor resistance also have been defined involving hyperactivation of receptor tyrosine kinases NRAS or PI3K/mTOR and these discoveries suggest that various combinations of molecular targeted agents will become the standard of care for melanomas (Johannessen et al., 2010; Gowrishankar et al., 2012).

Chemical structure of trametinib.
The efficacy of many molecularly targeted agents in central nervous system tumors is limited by penetration across the blood-brain barrier (BBB), which is composed of a monolayer of endothelial cells connected by tight junctions that serve as a physical barrier protecting the brain. In addition, these endothelial cells express multiple efflux transporters, including P-glycoprotein (P-gp) and breast cancer resistance protein (BCRP), which are known to exclude many anticancer agents from the brain (Ohtsuki and Terasaki, 2007; Agarwal et al., 2011). We have previously demonstrated that vemurafenib and dabrafenib are restricted in brain distribution owing to their efflux by P-gp and BCRP in an intact BBB (Mittapalli et al., 2012, 2013). Microscopic subclinical brain metastases likely have a relatively intact BBB, and the limited accumulation of these BRAF inhibitors in the brain suggest that they may not be particularly effective in preventing emergence of new brain metastases. Consistent with this observation, there are clinical data suggesting an increased incidence of brain metastases in patients whose peripheral disease is effectively controlled with these BRAF inhibitors (Rochet et al., 2012). However, there are sparse data about the efficacy of trametinib in the treatment of brain metastases, and no reports on factors influencing its brain distribution.
Effective combination therapy of melanoma brain metastases with targeted agents requires the sufficient delivery of all agents in combination across the BBB to the target sites in melanoma brain metastases that may reside behind an intact BBB. The latency time from the initial seeding of undetectable micrometastatic melanoma in the brain to the first detection by MRI, and the subsequent poor survival after detection, suggests the deadly nature of occult disease and the importance of prevention of clinically detectable brain metastases. Since trametinib is a highly efficacious combination partner for treatment of melanoma, the purpose of this study was to evaluate the factors limiting the brain distribution of trametinib in mice with the goal that this information will inform development of effective combination therapies that might include trametinib for patients with melanoma brain metastases.
Materials and Methods
Chemicals
Trametinib [N-[3-[3-cyclopropyl-5-(2-fluoro-4-iodoanilino)-6,8-dimethyl-2,4,7-trioxopyrido[4,3-d]pyrimidin-1-yl]phenyl]acetamide] and dabrafenib (GSK2118436A, N-[3-[5-(2-aminopyrimidin-4-yl)-2-tert-butyl-1,3-thiazol-4-yl]-2-fluorophenyl]-2,6-difluorobenzenesulfonamide) were purchased from ChemieTek (Indianapolis, IN). [3H]-Prazosin and [3H]-digoxin were purchased from PerkinElmer Life and Analytical Sciences (Waltham, MA). [3H]-Vinblastine and [3H]-mitoxantrone were purchased from Moravek Biochemicals (Brea, CA). [14C]-dasatinib was kindly provided by Bristol-Myers Squibb Co. (Princeton, NJ) and [14C]-inulin was purchased from American Radiolabeled Chemicals, Inc. (St. Louis, MO). Ko143 [(3S,6S,12aS)-1,2,3,4,6,7,12,12a-octahydro-9-methoxy-6-(2-methylpropyl)-1,4-dioxopyrazino(1′,2′:1,6) pyrido(3,4-b)indole-3-propanoic acid 1,1-dimethylethyl ester] was purchased from Tocris Bioscience (Bristol, UK) and zosuquidar [LY335979, (R)-4-((1aR, 6R,10bS)-1,2-difluoro-1,1a,6,10b-tetrahydrodibenzo-(a,e) cyclopropa (c)cycloheptan-6-yl)-α-((5-quinoloyloxy) methyl)-1-piperazine ethanol, trihydrochloride] was kindly provided Eli Lilly and Company (Indianapolis, IN). Cell culture reagents were purchased from Invitrogen (Carlsbad, CA). All other chemicals used were of high-performance-liquid-chromatography or reagent grade and were obtained from Sigma-Aldrich (St. Louis, MO).
In Vitro Studies
In vitro studies were performed using polarized Madin-Darby canine kidney II (MDCKII) cells. MDCKII-wild type (WT) and Bcrp1-transfected (MDCKII-Bcrp1) cell lines were gifts from Dr. Alfred Schinkel (The Netherlands Cancer Institute). MDCKII-WT and MDR1-transfected (MDCKII-MDR1) cell lines were kindly provided by Dr. Piet Borst (The Netherlands Cancer Institute). Cells were cultured in Dulbecco’s modified Eagle’s medium supplemented with 10% (v/v) fetal bovine serum and antibiotics (penicillin, 100 IU/mL streptomycin, 100 μg/ml; and amphotericin B, 250 ng/ml). Cells were grown in 25 ml tissue-culture treated flasks before seeding for the experiments and were maintained at 37°C in a humidified incubator with 5% CO2. The growth media for MDCKII-MDR1 additionally contained 80 ng/ml of colchicine to maintain positive selection pressure of P-gp expression
In Vitro Accumulation Studies.
The intracellular accumulation of trametinib was performed in 12-well polystyrene plates (Corning Incorporated, Corning, NY). Briefly, cells were seeded at a density of 2 × 10⁵ cells per well and were grown until the cells were ∼80% confluent. On the day of experiment the culture media was aspirated and the cells were washed two times with cell assay buffer (122 mM NaCl, 25 mM NaHCO3, 10 mM glucose, 10 mM HEPES, 3 mM KCl, 2.5 mM MgSO4, 1.8 mM CaCl2, and 0.4 mM K2HPO4). Then the cells were preincubated with assay buffer for 30 minutes, after which the buffer was aspirated and the experiment was initiated by adding 1 ml of trametinib (2 μM) to each well and further incubated for 60 minutes. The assay plates were incubated at 37°C on an orbital shaker (60 rpm) for the entire duration of the experiment. When the inhibitor was present, it was included in both preincubation and accumulation steps. After the incubation period, the drug solution was aspirated and the cells were washed twice with ice-cold phosphate-buffered saline. Then the cells were lysed by adding 500 μl of 1% Triton X to each well. The solubilized cell fraction was sampled from each well and the concentration of trametinib was determined using liquid chromatography–tandem mass spectrometry (LC-MS/MS) and normalized to protein content (BCA protein assay).
Bcrp and P-gp Inhibition Studies.
Inhibition assays were performed using radiolabeled prototypical probe substrates [3H]-prazosin for Bcrp, [3H]-digoxin for P-gp, and [14C]-dasatinib or dabrafenib (2 μM) as dual substrates. The intracellular accumulation of these probe substrates was evaluated in the presence of varying concentrations of trametinib ranging from 0.1 to 25 μM. Briefly, the cells were preincubated with increasing concentrations of trametinib for 30 minutes. After preincubation the cells were incubated with substrate along with increasing concentrations of trametinib for 60 minutes. At the end of the incubation period, the buffer was aspirated and cells were lysed using 1% Triton-X. The radioactivity in solubilized cell fractions was determined by liquid scintillation counting (LS-6500; Beckman Coulter, Brea, CA). The concentration of dabrafenib in the solubilized cell fraction was determined using LC-MS/MS by a method previously described by Mittapalli et al. (2013). The concentration of dabrafenib and radioactivity of probe substrates in cell fractions was also normalized to protein content in each well. The increase in cellular accumulation of substrate compared with control (no treatment with trametinib) was measured and reported as a function of trametinib concentration.
Directional Transport across MDCKII Monolayers.
The bidirectional flux studies were performed using 12-well Transwell plates (polyester membrane, 0.4-μM pore size, 1.12-cm2 growth surface area; Corning Incorporated, Lowell, MA). The cells were seeded at a density of 2 × 10⁵ cells per well and the media was changed every other day until confluent monolayers were formed. On the day of experiment, the culture medium was aspirated and the cells were washed twice with cell assay buffer. After a 30-minute preincubation, the experiment was initiated by adding the trametinib solution (5 μM) in assay buffer to the donor compartment. Samples (100 μl) were collected from the receiver compartment at 0, 60, 120, and 180 minutes and replaced with drug-free assay buffer. Similarly, at the beginning of the experiment, a 100-μl sample was drawn from the donor compartment and replaced with 100 μl of drug solution. The Transwell plates were incubated at 37°C on an orbital shaker for the duration of experiment except for the brief sampling times. In the inhibition experiments, either 0.2 μM Ko143 (selective Bcrp inhibitor) or 1 μM zosuquidar (selective P-gp inhibitor) was added to both apical (A) and basolateral (B) compartments; the inhibitor was present in both compartments during the pre- and post-incubation period.
The apparent permeability (Papp) was calculated using the following equation where (dQ/dt) is the slope obtained from the initial linear range from the amount transported versus time plot, A is the area of the Transwell membrane, and C0 is the initial donor concentration. The efflux ratio and corrected flux ratio were calculated using eqs. 2 and 3, respectively.
 where A→B represents permeability in apical-to-basolateral and B→A represents permeability in basolateral-to-apical direction.
In Vivo Studies
Animals.
All of the in vivo studies were performed in Friend leukemia virus strain B (FVB) (wild-type), Mdr1a/b−/− (P-gp knockout), Bcrp1−/− (Bcrp knockout), and Mdr1a/b−/−Bcrp1−/− (triple knockout) mice of either sex from an FVB genetic background (Taconic Farms, Germantown, NY). All animals were 8- to 10-weeks-old at the time of experiment. Animals were maintained in a 12-hour light/dark cycle with unlimited access to food and water. All studies were carried out in accordance with the guidelines set by the Principles of Laboratory Animal Care (National Institutes of Health, Bethesda, MD) and approved by the Institutional Animal Care and Use Committee (IACUC) of the University of Minnesota.
Brain Distribution of Trametinib in FVB Mice.
The trametinib intravenous dosing formulation was prepared in a vehicle containing 40% dimethyl sulfoxide (DMSO), 40% propylene glycol, and 20% saline. All trametinib dosing solutions were freshly prepared on the day of the experiment. Wild-type, Mdr1a/b−/−, Bcrp1−/−, and Mdr1a/b−/−Bcrp1−/− mice received an intravenous dose of 5 mg/kg trametinib via the tail vein, and blood and brain samples were collected after 1, 4, 8, 16, and 24 hours post-dose. At the end of the desired time point, the animals were euthanized using a CO2 chamber. Blood was collected via cardiac puncture in heparinized tubes. Plasma was separated by centrifuging whole blood at 3500 rpm for 10 minutes at 4°C. The whole brain was removed from the skull and washed with ice-cold phosphate-buffered saline and superficial meninges were then removed by blotting with tissue paper. Both brain and plasma samples were stored at –80°C until further analysis.
Steady-State Brain Distribution of Trametinib and Combination of Dabrafenib-Trametinib.
To determine the steady-state brain and plasma concentrations of trametinib, Alzet osmotic minipumps (Durect Corporation, Cupertino, CA) were loaded with trametinib (2 mg/ml dissolved in DMSO) to be released for 48 hours at a rate of 1 μl/h. After initial trametinib loading, minipumps were primed overnight in sterile saline at 37°C. Pumps were implanted in the peritoneal cavity of wild-type, Mdr1a/b−/−, Bcrp1−/−, and Mdr1a/b−/−Bcrp1−/− mice as described previously (Mittapalli et al., 2012). Briefly, mice were anesthetized using isofluorane and the abdominal cavity was shaved. A small midline incision was made in the lower abdominal wall under the rib cage. Then a small incision was made directly in the peritoneal membrane and the primed pump was inserted in the cavity. The incision was sutured and the skin was closed using surgical clips. The animals were allowed to recover on a heating pad and once recovered they were moved to their original cages. The animals were sacrificed 48 hours after the implantation of the pumps, and brain and plasma samples were processed as described above.
Similarly, in another study, Alzet minipumps were loaded with trametinib and dabrafenib (2 mg/ml trametinib and 10 mg/ml dabrafenib dissolved in DMSO) to be released for 48 hours at the rate of 1 μl/h. Pumps were primed overnight and implanted in the peritoneal cavity of wild-type and Mdr1a/b−/−Bcrp1−/− mice. These animals were also sacrificed 48 hours after the implantation of the pumps, and brain and plasma samples were processed as described previously.
Analysis of Trametinib Concentrations Using Liquid Chromatography–Tandem Mass Spectrometry.
The concentrations of trametinib in cell lysates, assay buffer, plasma, and brain homogenate were determined using a sensitive and specific liquid chromatography–tandem mass spectrometry (LC-MS/MS) assay. For brains, three volumes of 5% bovine serum albumin were added and homogenized to get a uniform homogenate. For analysis of unknowns, an aliquot of cell lysate, cell assay buffer, brain homogenate, or plasma was spiked with 50 ng of vemurafenib as an internal standard. The samples were then extracted by addition of 10 volumes of ethyl acetate followed by vigorous shaking for 5 minutes and centrifuged at 7500 rpm for 5 minutes at 4°C to separate the organic layer. The organic layer was transferred to microcentrifuge tubes and dried under nitrogen. Samples were reconstituted in 100 μl of mobile phase and transferred into high-performance-liquid-chromatography glass vials. Chromatographic analysis was performed using an AQUITY UPLC system (Milford, MA). The chromatographic separation was achieved using an Agilent Technologies (Santa Clara, CA) Eclipse XDB-C18 column (4.6 × 50 mm) with 1.8-μm Zorbax Rx-SIL as the stationary phase. The mobile phase consisted of 20 mM ammonium formate with 0.1% formic acid and acetonitrile (35:65, v/v) and was delivered at a flow rate of 0.25 ml/min.
The column effluent was monitored using a Micromass Quattro Ultima mass spectrometer (Waters, Milford, MA). The instrument was equipped with an electrospray interface, and controlled by the MassLynx (Version 4.1; Waters) data system. The samples were analyzed using an electrospray probe in the negative-ionization mode operating at a spray voltage of 2.96 kV for both trametinib and vemurafenib (internal standard). Samples were introduced into the interface through a heated nebulized probe, in which the source temperature and desolvation temperature was set at 100°C and 275°C, respectively. The spectrometer was programmed to allow the [MH]– ion of trametinib at m/z 613.93 and that of internal standard at m/z 488.23 to pass through the first quadrupole (Q1) and into the collision cell (Q2). The collision energy was set at 27 V both for trametinib and vemurafenib. The product ions for trametinib (m/z 530.79) and vemurafenib (m/z 380.89) were monitored through the third quadrupole (Q3). The retention times for trametinib and the internal standard (vemurafenib) were 4.5 and 5.7 minutes, respectively. The assay was sensitive and linear over a range of 1.26 to 1500 ng/ml with the coefficient of variation less than 15% over the entire range.
Pharmacokinetic Calculations
Pharmacokinetic parameters and metrics from the concentration-time data in plasma and brain were obtained by noncompartmental analysis (NCA) performed using Phoenix WinNonlin 6.2 (Pharsight, Mountain View, CA). The area under the concentration-time profiles for plasma (AUCplasma) and brain (AUCbrain) were calculated using the linear trapezoidal method. The sparse sampling module in WinNonlin was used to estimate the standard error around the mean of the AUCs.
Statistical Analysis
Data in all experiments represent mean ± S.D. unless otherwise indicated. Comparisons between two groups were made using an unpaired t test. One-way ANOVA, followed by Bonferroni’s multiple comparisons test, were used to compare multiple groups. A significance level of P < 0.05 was used for all experiments. (GraphPad Prism 5.01 software; GraphPad, San Diego, CA).
Results
Intracellular Accumulation of Trametinib
The intracellular accumulation of trametinib was studied in MDCKII-WT and P-gp- or Bcrp-overexpressing cell lines. The cellular accumulation of [3H]-prazosin and [3H]-vinblastine were used as positive controls for Bcrp- and P-gp-mediated efflux transport, respectively. The accumulation of [3H]-prazosin (Fig. 2A) was 87% lower in Bcrp-overexpressing cells (WT: 100 ± 9.2%; Bcrp: 12.7 ± 1.7%; P < 0.0001). Similarly, the accumulation of [3H]-vinblastine (Fig. 2B) in P-gp-overexpressing cells was ∼77% lower compared with WT cells (WT: 100.0 ± 6.8%; MDR1: 22.85 ± 0.7%; P < 0.0001). Trametinib accumulation was approximately 81% lower in Bcrp-overexpressing cells compared with WT cells (WT: 100 ± 2.95%; Bcrp: 18.8 ± 1.4%; P < 0.0001). The difference in accumulation was abolished when the specific Bcrp inhibitor Ko143 was added (Bcrp: 18.8 ± 1.4%; Bcrp with Ko143: 103.6 ± 1.1%; P < 0.0001). Similarly, the accumulation of trametinib was ∼45% lower in P-gp-overexpressing line compared with its WT control (WT: 100.0 ± 3.5%; MDR1: 55.0 ± 4.2%; P < 0.0001), and the difference in accumulation was abolished (Fig. 2B) when a specific P-gp inhibitor LY335979 was added (MDR1: 55.0 ± 4.2%; MDR1 with LY: 97.0 ± 2.7%; P < 0.0001). These cellular accumulation data indicate that trametinib is a substrate for both P-gp and Bcrp in vitro.

In vitro cellular accumulation of trametinib. (A) The accumulation of prazosin (prototypical Bcrp probe substrate; positive control) and trametinib in MDCKII wild-type and Bcrp1-transfected cells with and without specific Bcrp inhibitor Ko-143 (0.2 μM). The accumulation of trametinib and vinblastine (probe substrate for P-gp) in MDR1 cells with and without specific P-gp inhibitor LY335979 (1 μM) is shown in (B). Data represent the mean ± S.D.; n = 3 for all data points. ***P < 0.0001 compared with respective wild-type controls; #P < 0.001 compared with the untreated transfected cell line.
Competition Assays Using Prototypical Probe Substrates.
The effect of increasing concentrations of trametinib on probe substrate accumulation was assessed in Bcrp-transfected and MDR1-transfected MDCKII cells. Increasing concentrations of trametinib did not significantly increase the accumulation of prazosin in the Bcrp1-transfected cells (Fig. 3A). However, increasing concentrations of trametinib significantly increased (∼3-fold at 5 μM trametinib) the accumulation of dasatinib in the Bcrp cells (Fig. 3B). The addition of increasing concentrations of trametinib resulted in an increase in the accumulation of digoxin (∼4-fold increase at 5 μM trametinib) in the MDCKII-MDR1 cells (Fig. 3C). The fold increase in digoxin accumulation in MDCKII-MDR1 cells at 5 μM of trametinib was no different than the effect seen with 1 μM LY335959. These competitive inhibition results suggest that trametinib possibly shares the same binding site on Bcrp as dasatinib and on P-gp as digoxin. Given that dabrafenib and trametinib will be administered as combination therapy, it is important to note that increasing concentrations of trametinib did not significantly increase the intracellular accumulation of dabrafenib in the range from 0.1 to 10 μM in the Bcrp1- (Fig. 4A) and MDR1- (Fig. 4B) transfected cells, suggesting no competing interaction between trametinib and dabrafenib in this concentration range.

Competition assays using prototypical probe substrate molecules. Intracellular accumulation of [3H]-prazosin (Bcrp probe substrate) (A) and [14C]-dasatinib (dual substrate) (B) in Bcrp1-transfected cells, and [3H]-digoxin (P-gp probe substrate) (C) in MDR1-transfected cells with increasing concentrations of trametinib from 0.1 μM to 25 μM. Ko143: Bcrp inhibitor; LY335979: P-gp inhibitor. Data represent the mean ± S.D.; n = 3 for all data points. ***P < 0.0001, **P = 0.003 compared with untreated transfected cells.

Intracellular accumulation of dabrafenib in the presence of increasing concentrations of trametinib. (A) Intracellular accumulation of dabrafenib in Bcrp1-transfected cells in the presence of increasing concentrations of trametinib (0.1–10 μM). The accumulation of dabrafenib in MDR1 cells with increasing concentrations of trametinib from 0.1 μM to 10 μM is shown in (B). Ko-143, Bcrp inhibitor Ko143; LY, P-gp inhibitor LY335979. Data represent the mean ± S.D.; n = 3 for all data points. ***P < 0.0001, *P = 0.0031 compared with untreated transfected cells.
Directional Transport Studies.
The directional flux of trametinib was assessed in MDCKII wild-type, Bcrp1-transfected, and MDR1-transfected monolayers grown on Transwell membranes. Confluent monolayers with intact tight junctions were formed in 3–4 days. Paracellular leakage was assessed by measuring the transport of [14C]-inulin across the cell monolayers and the percentage of inulin transported in 120 minutes was found to be less than 1% in all cell lines. The directional permeability of trametinib was similar in the apical-to-basal (A-to-B) and B-to-A directions in the wild-type cells (12.8 ± 2.5 versus 12.3 ± 4.7 × 10⁻⁶ cm/s, respectively; Table 1). However, in the Bcrp1-transfected cells, the apparent permeability of trametinib in the B-to-A direction was significantly higher than the apparent permeability in the A-to-B direction (19.3 ± 1.96 versus 5.17 ± 2.1 × 10⁻⁶ cm/s, respectively; P < 0.05; Table 1) with an efflux ratio of 3.7 (Table 1). Treatment with the Bcrp inhibitor Ko143 significantly (P < 0.05) decreased the Bcrp1-mediated efflux of trametinib in the B-to-A direction and increased the A-to-B permeability with a resulting efflux ratio of 1.04. The corrected efflux ratio was found to be 3.85 for Bcrp1-mediated bidirectional transport. Similarly, in MDR1-transfected cells, the B-to-A permeability was significantly higher compared with A-to-B permeability, with an efflux ratio of 2.55 (Table 1). The presence of LY335979 significantly abolished the difference in directional permeabilities with a resulting efflux ratio of 1.23. The corrected efflux ratio in the MDR1 cells was found to be 2.45. These data further confirm that trametinib is a substrate for Bcrp1 and MDR1 in vitro and suggests that these transporters may be an important factor in the brain distribution of trametinib.
Bidirectional flux of trametinib in MDCKII-WT, MDCKII-Bcrp1, and MDCKII-WT, and MDCKII-MDR1-transfected cells
Brain Distribution of Trametinib in Different Genotypes.
The brain distribution of trametinib was studied in FVB wild-type, Bcrp1−/−, Mdr1a/b−/−, and Mdr1a/b−/−Bcrp1−/− mice after intravenous administration of 5 mg/kg of trametinib via the tail vein. Figure 5 shows the plasma and brain concentrations of trametinib in all four genotypes at 1, 4, 8, 16, and 24 hours after a single intravenous dose. The plasma concentrations (Fig. 5A) were no different between the four genotypes at any given time point. The plasma concentrations of trametinib were 2- to 30-fold higher than the brain concentrations (Fig. 5B) in the wild-type and Bcrp1−/− mice. The brain concentrations in the Mdr1a/b−/− and Mdr1a/b−/−Bcrp1−/− were 4- to 20-fold higher than the brain concentrations in the wild-type and the Bcrp1−/− mice. The brain-to-plasma AUC ratios (Fig. 5C) in the wild-type, Bcrp1−/−, Mdr1a/b−/− and Mdr1a/b−/−Bcrp1−/− were: 0.148, 0.136, 0.733, 0.675, respectively, resulting in a drug targeting index (AUCbrain/AUCplasma) knockout/(AUCbrain/AUCplasma) wild type of ∼5 in both Mdr1a/b−/−, and Mdr1a/b−/−Bcrp1−/− mice (Table 2), but there was no significant brain targeting in the Bcrp1−/− mice. These data suggest that P-gp plays a major role, greater than Bcrp, in significantly limiting the brain distribution of trametinib.

Brain distribution of trametinib in FVB wild-type, Bcrp1−/−, Mdr1a/b−/−, and Mdr1a/b−/−Bcrp1−/− mice. Plasma (A), brain (B), and brain-to-plasma concentration ratios (C) of trametinib in wild-type, Bcrp1−/−, Mdr1a/b−/−, and Mdr1a/b−/−Bcrp1−/− mice after an intravenous dose of 5 mg/kg. Plasma and brain concentrations of trametinib at 1, 4, 8, 16, and 24 hours post-dose were determined using LC-MS/MS. Data represent mean ± S.D., n = 3–4. *P < 0.05, **P < 0.001, ***P < 0.0001 compared with wild-type.
Trametinib PK parameters in FVBn-WT, Mdr1a/b−/−, Bcrp1−/−, and Mdr1a/b−/− Bcrp1−/− (triple knockout) after 5 mg/kg i.v. dose
Steady-State Brain Distribution of Trametinib.
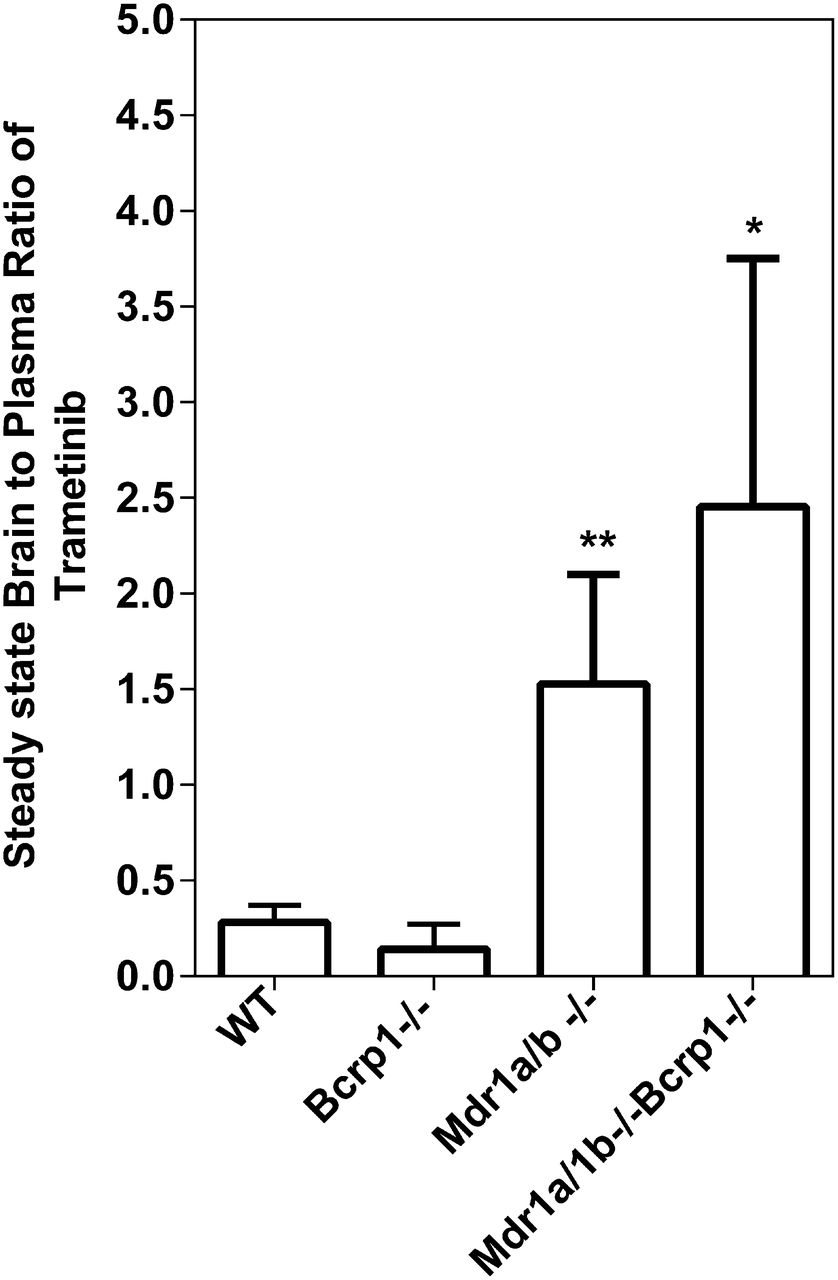
The steady-state brain distribution of trametinib was examined after a continuous intraperitoneal infusion using Alzet osmotic pumps for 48 hours at 2 μg/h. As shown in Fig. 6, the steady-state brain-to-plasma (B/P) ratios were 0.28 ± 0.09, 0.14 ± 0.13, 1.53 ± 0.57, 2.45 ± 1.3 in the FVB wild-type, Bcrp1−/−, Mdr1a/b−/−, and Mdr1a/b−/−Bcrp1−/− mice, respectively. The B/P ratios at steady state were ∼5-fold higher in the Mdr1a/b−/− and ∼9-fold higher in the Mdr1a/b−/−Bcrp1−/− mice compared with wild-type mice. These data indicate that the brain distribution of trametinib is significantly limited because of active efflux at the BBB with P-gp playing a greater role than Bcrp in the mouse, and the steady-state data correspond well with the AUC ratios following a single intravenous dose.

Steady-state distribution of trametinib at 2 μg/h for 48 hours. Steady-state brain-to-plasma ratio of trametinib in wild-type, Bcrp1−/−, Mdr1a/b−/−, and Mdr1a/b−/−Bcrp1−/− mice. Trametinib was delivered at a constant infusion rate of 2 μg/h for 48 hours using Alzet osmotic pumps. Data represent mean ± S.D., n = 4–7. **P = 0.004, *P = 0.01 compared with wild-type.
Steady-State Brain Distribution of Dabrafenib and Trametinib in Combination.
We then examined the steady-state brain distribution of dabrafenib (10 μg/h) and trametinib (2 μg/h) when dosed simultaneously as a 48-hour constant intraperitoneal infusion in wild-type and Mdr1a/b−/−Bcrp1−/−. The steady-state B/P concentration ratios of dabrafenib in the wild-type and Mdr1a/b−/−Bcrp1−/− mice were 0.019 ± 0.02 and 1.09 ± 0.85, respectively (Fig. 7). The steady-state B/P concentration ratios of trametinib in the wild-type and Mdr1a/b−/−Bcrp1−/− mice were 0.03 ± 0.01 and 0.85 ± 0.38, respectively (Fig. 7). The aggregate of these data suggests that both drugs in the combination of dabrafenib and trametinib suffer from limited brain distribution attributable to active efflux at the BBB.

Steady-state distribution of dabrafenib and trametinib after simultaneous infusion for 48 hours. Steady-state brain-to-plasma ratios of dabrafenib and trametinib in wild-type and Mdr1a/b−/−Bcrp1−/− mice. Dabrafenib and trametinib were simultaneously delivered at a constant rate of 10 μg/h and 2 μg/h, respectively, for 48 hours using Alzet osmotic pumps. Data represent mean ± S.D., n = 4–9. **P = 0.002 compared with trametinib B/P ratio in wild-type, *P = 0.05 compared with dabrafenib B/P ratio in wild-type
Discussion
Brain metastases are a significant cause of morbidity and mortality among patients with advanced melanoma (Skibber et al., 1996; Fife et al., 2004; Davies et al., 2011). The last decade has seen remarkable improvements in the treatment of metastatic melanoma. Earlier, dacarbazine and interleukin-2 were the only two systemic agents that were approved for the treatment of metastatic melanoma. The response rates with these two agents were ∼10–20% (Comis, 1976; Atkins et al., 1999; Garbe et al., 2011). The discovery of oncogenic mutations in BRAF and its high prevalence in melanoma tumors made it an excellent molecular target. The approval of BRAF inhibitors vemurafenib and dabrafenib, as well as the MEK inhibitor trametinib, has tremendously changed the landscape of treatment options for advanced melanoma. Vemurafenib and dabrafenib were approved by the FDA after they showed improved efficacy compared with dacarbazine in clinical trials (Chapman et al., 2011; Hauschild et al., 2012). Also, in a phase 1 dose-escalation clinical trial in melanoma patients with untreated brain metastases, dabrafenib showed a promising reduction in brain tumor size in 90% of the patients (Falchook et al., 2012). Despite the initial success of these two agents, most patients with metastatic melanoma relapse within a year owing to the emergence of resistance (Johannessen et al., 2010; Nazarian et al., 2010; Gowrishankar et al., 2012). The improved duration of response from the combination of BRAF and MEK inhibitors dabrafenib and trametinib provides new hope for delaying resistance and improving response. The success of combination therapies in treating brain metastases depends on all agents being effectively delivered to all metastatic sites, including micrometastases that reside behind an intact BBB with functional efflux transporters. In our previous studies, we have shown that both vemurafenib and dabrafenib are substrates for P-gp and BCRP, and their brain distribution is significantly limited because of their interaction with these two important efflux transporters (Mittapalli et al., 2012; Mittapalli et al., 2013). We also observed that dabrafenib has a greater brain distribution compared with vemurafenib, with the B/P ratio of dabrafenib being greater than that of vemurafenib in both wild-type and Mdr1a/b−/−Bcrp−/− mice. These data suggest that dabrafenib may be a better option than vemurafenib in the treatment of brain metastases. However, for the success of the dabrafenib and trametinib combination in the treatment of brain metastases, it is important to investigate the mechanisms influencing the brain distribution of trametinib, both alone and in combination with dabrafenib.
In the current study, we demonstrate that trametinib is a substrate for P-gp and BCRP in vitro. In vivo, we observe that P-gp plays a greater role than BCRP in limiting trametinib brain distribution. This is the first report of the interaction of trametinib with BCRP and P-gp.
The experiments performed in vitro in MDCKII cells that overexpress either murine Bcrp or human MDR1 revealed that trametinib is a substrate for both Bcrp and P-gp (Fig. 2; Table 1). We observed a significantly lower accumulation of trametinib in the P-gp- and Bcrp-transfected cells compared with wild-type (Fig. 2). In the presence of specific P-gp and Bcrp inhibitors (LY335979 and Ko-143, respectively) this difference in intracellular accumulation was abolished (Fig. 2). The percentage accumulation of vinblastine in the presence of LY335979 in the wild-type and MDR1-transfected cells was significantly greater than 100%; this may be attributable to the fact that vinblastine was used at a tracer concentration (positive control for functional cells). In comparison, trametinib accumulation at an incubating trametinib concentration of 2 μM was not greatly affected by LY335979, presumably because the higher trametinib concentration (substrate) may be saturating transport, leading to less influence of LY335979 (inhibitor) on the efflux transport clearance.
In P-gp-transfected cells, using a prototypical probe substrate, digoxin, for P-gp, we observed a significant increase in intracellular accumulation with increasing concentrations of trametinib starting at 5 μM (Fig. 3C). Interestingly, we did not observe a significant increase in intracellular accumulation of BCRP substrate prazosin up to a concentration of 25 μM (Fig. 3A). In Bcrp cells, we observed a significant increase in accumulation of dual substrate dasatinib, starting at 5 μM trametinib (Fig. 3B). In both, Bcrp and MDR1 cells, we did not observe a significant increase in intracellular dabrafenib with increasing concentrations of trametinib up to 10 μM (Fig. 4). It is noteworthy here that this is not a pharmacologically relevant concentration; the average peak concentration observed when patients received 2 mg of trametinib once daily was ∼0.035 μM (Kim et al., 2013). Using the specific Bcrp inhibitor Ko143 and P-gp inhibitor LY335979, we observed an increase in the intracellular accumulation of trametinib in both Bcrp1 and MDR1 cells. From accumulation studies, we conclude that trametinib is a substrate for both BCRP and P-gp. At 5 μM, trametinib inhibits the active efflux of P-gp probe substrate digoxin and dual substrate dasatinib. This suggests the possibility of trametinib sharing similar binding sites as digoxin and dasatinib on P-gp and BCRP, respectively. Trametinib, however, did not inhibit these two transporters in the case of Bcrp probe substrate prazosin and the dual substrate dabrafenib. This may suggest the interaction of trametinib on a different binding site compared with these two substrates on the efflux transporters. Importantly, the fact that trametinib (0.1–10 μM) does not inhibit Bcrp- and P-gp-mediated efflux of dabrafenib suggests that at the studied concentrations, the combination of dabrafenib and trametinib may not have any transporter-mediated drug-drug interaction in treating brain metastases. From our bidirectional flux studies of trametinib across monolayers of MDCKII wild-type, Bcrp1-transfected, and MDR1-transfected cells, we observed a corrected flux ratio of 3.85 in the Bcrp1 cells and 2.45 in the MDR1 cells (Table 1), indicating the involvement of these two efflux transporters in the active efflux of trametinib. The specific inhibitors of Bcrp and P-gp were able to restore the net bidirectional flux of trametinib. All these in vitro experimental results, put together, conclusively show that trametinib is a substrate for these two efflux transporters. Based on our current in vitro and in vivo findings, we have noted a disparity with the current findings and the trametinib product label, which states that trametinib is not a substrate for, or inhibitor of, P-gp or Bcrp. We attribute these differences to the trametinib concentration at which in vitro inhibition studies were conducted (0.04 μM). In our studies, we observe trametinib to be a substrate of P-gp and Bcrp. More importantly, we observe that the in vitro findings translate in vivo with changes in brain distribution in both the P-gp knockout and triple knockout mice.
With these results from in vitro experiments, we then investigated the brain distribution of trametinib in mice. After an intravenous dose of trametinib, we observed that the brain concentrations in the wild-type and Bcrp−/− mice were ∼1 log unit lower than the plasma concentrations at all measured time points (Fig. 5B). However, the brain distribution of trametinib was significantly improved in the Mdr1a/b−/− and Mdr1a/b−/−Bcrp−/− mice (Fig. 5B). The plasma concentrations were not different in all four genotypes at all measured time points (Fig. 5A). The AUCbrain-to-AUCplasma ratio (Kp) in the wild-type and Bcrp−/− mice were 0.148 and 0.136, respectively, while they were 0.733 and 0.675 in the Mdr1a/b−/− and Mdr1a/b−/−Bcrp−/− mice (Table 2). The remarkable increase in the targeted brain distribution led to a Kp ratio (Kp knockout/Kp wild-type) of ∼5 in the Mdr1a/b−/− and Mdr1a/b−/−Bcrp−/− mice. An important consideration here is the plasma and tissue binding of trametinib. According to the product label, trametinib is 97.4% bound to human plasma proteins. KP, uu = KP * (fraction unbound brain/fraction unbound plasma) would provide useful information regarding brain partitioning and the role of efflux transporters; however, it should be noted here that the magnitude of difference, i.e., fold increase in brain-to-plasma ratio observed between wild-type and knockout mice, would not change with correction for free fraction, since protein binding is no different between wild-type and knockout mice (Mittapalli et al., 2013). Keeping this in mind, our overall conclusions with regard to the brain penetration of trametinib remain valid.
Also, at steady state, the B/P ratios in the wild-type and Bcrp−/− mice were significantly lower (5- to 9-fold) than in the Mdr1a/b−/− and Mdr1a/b−/−Bcrp−/− mice (Fig. 6). From simultaneous infusion of dabrafenib and trametinib to steady-state, we observed a significant increase in the B/P ratio in the Mdr1a/b−/−Bcrp−/− mice compared with wild-type (Fig. 7). Also, when infused simultaneously, we observed a decrease in the B/P ratio of trametinib in the wild-type compared with single-agent infusion. A possible explanation for this could be the saturation of influx transporters during co-dosing. It is interesting to note that even though the in vitro cell accumulation and directional flux studies show that trametinib is a substrate for Bcrp-mediated transport, that fact did not translate into significant effects of Bcrp-mediated transport at the BBB in these mouse models. Here, it is important to think about species differences in the expression of efflux transporters. For example, the expression of BCRP at the human BBB is approximately three times greater compared with the expression at the mouse BBB, and the expression of P-gp is ∼2.5-fold lower at the human BBB compared with mouse BBB (Uchida et al., 2011). Also, FVB mice express four times more P-gp compared with Bcrp (Agarwal et al., 2012). However, in spite of various differences in transporter expression, rodent models have been widely used to study the brain distribution of drugs. From this study, keeping in mind known differences in transporter expression at the brain capillary endothelium, it may be possible to make correlations to predict potential human exposure related to these two transporters. Also, it should be noted that the findings from this study may be able to guide/explain future clinical results. In the current study, we have observed that active efflux by P-gp plays a major role in keeping trametinib out of the mouse brain. This interpretation of rodent data has to be kept in mind for assessing potential human exposure. In the case of trametinib, it is probable that, together, P-gp and Bcrp will affect its brain distribution in humans. This result is similar to previous findings with another molecularly targeted agent, cediranib (Wang et al., 2012). It is well understood that P-gp and Bcrp may compensate for each other at the BBB in active efflux of dual substrates, i.e., with genetic knockout of one transporter (single knockouts); another transporter can limit substrate brain distribution, while in triple knockouts, there can potentially be a greater than additive effect in the enhancement of brain distribution of dual substrates (Enokizono et al., 2008; Kodaira et al., 2010). Also, given the higher expression of P-gp at the mouse BBB, with substrates of similar affinities, it is common to observe a greater P-gp effect on brain penetration (Agarwal et al., 2011; Agarwal et al., 2012). Taken together, these data clearly indicate that the brain distribution of trametinib is limited by active efflux in an intact BBB model, primarily mediated by P-gp.
The duration of response of single-agent BRAF inhibitors is limited by the eventual development of resistance. An understanding of the underlying mechanism of resistance in patients will enable the development of rational combinations. Blocking multiple signaling mechanisms has been shown to overcome resistance to BRAF inhibitors (Villanueva et al., 2010). However, for treatment of brain metastases, combination agents have to be delivered to all metastases in the brain. With the clinical development of a combination of dabrafenib and trametinib, and the fact that both these agents individually are substrates for active efflux, we were interested in understanding the factors that affect the brain distribution of the combination in vivo. When dabrafenib and trametinib were dosed to steady state, we observed a remarkable (>10-fold) increase in the brain-to-plasma concentration ratios in the Mdr1a/b−/−Bcrp−/− compared with wild-type. These data indicate that the brain distribution of both drugs in the combination is restricted by active efflux at the BBB.
The development of BRAF inhibitors has truly been a breakthrough for the treatment of metastatic melanoma. The addition of combination agents to BRAF inhibitor therapy is a rational method for overcoming resistance. However, given the deadly nature of brain metastases, there is a critical need to address central nervous system delivery issues of these combinations in order to achieve a durable response. With the limited delivery of combination agents to the brain, the brain may become a sanctuary site with greater resistance. These findings are clinically relevant as a means to choose rational combinations to ensure the effective treatment of brain metastases.
Acknowledgments
The authors thank Jim Fisher, Clinical Pharmacology Analytical Services Laboratory, University of Minnesota, for help and support in the development of the trametinib LC-MS/MS assay.
Authorship Contributions
Participated in research design: Vaidhyanathan, Mittapalli, Sarkaria, Elmquist.
Conducted experiments: Vaidhyanathan, Mittapalli.
Performed data analysis: Vaidhyanathan, Mittapalli, Sarkaria, Elmquist.
Wrote or contributed to the writing of the manuscript: Vaidhyanathan, Mittapalli, Sarkaria, Elmquist.
Footnotes
- Received March 28, 2014.
- Accepted May 27, 2014.
This work was supported in part by the National Institutes of Health National Cancer Institute [Grants CA138437 (to W.F.E.) and NS077921 (to W.F.E and J.N.S.)]. Financial support for S.V. was provided in part by the Ronald J. Sawchuk Fellowship in Pharmacokinetics of the Department of Pharmaceutics, University of Minnesota.
Abbreviations
- A-to-B
- apical-to-basolateral
- AUC
- area under the curve
- B-to-A
- basolateral-to-apical
- B/P
- brain-to-plasma
- BBB
- blood-brain barrier
- BCRP
- breast cancer resistance protein
- Bcrp1
- gene encoding the murine breast cancer resistance protein
- BRAF
- v-raf murine sarcoma viral oncogene homolog B
- DMSO
- dimethyl sulfoxide
- FDA
- US Food and Drug Administration
- FVB
- Friend leukemia virus strain B
- Ko143
- (3S,6S,12aS)-1,2,3,4,6,7,12,12a-octahydro-9-methoxy-6-(2-methylpropyl)-1,4-dioxopyrazino(1′,2′:1,6) pyrido(3,4-b)indole-3-propanoic acid 1,1-dimethylethyl ester
- Kp
- ratio of AUCbrain to AUCplasma
- LC-MS/MS
- liquid chromatography–tandem mass spectrometry
- LY335979 (zosuquidar)
- (R)-4-((1aR,6R,10bS)-1,2-difluoro-1,1a,6,10b-tetrahydrodibenzo-(a,e)cyclopropa(c)cycloheptan-6-yl)-α-((5-quinoloyloxy) methyl)-1-piperazine ethanol, trihydrochloride
- MDCKII
- Madin-Darby canine kidney II
- MDR1
- gene encoding the human P-glycoprotein
- Mdr1
- gene encoding the murine P-glycoprotein
- MEK
- mitogen-activated protein kinase kinase
- Papp
- apparent permeability
- P-gp
- P-glycoprotein
- WT
- wild-type
- Copyright © 2014 by The American Society for Pharmacology and Experimental Therapeutics
References
DMD articles become freely available 12 months after publication, and remain freely available for 5 years.Non-open access articles that fall outside this five year window are available only to institutional subscribers and current ASPET members, or through the article purchase feature at the bottom of the page.
|


