


Article Figures & Data
Figures
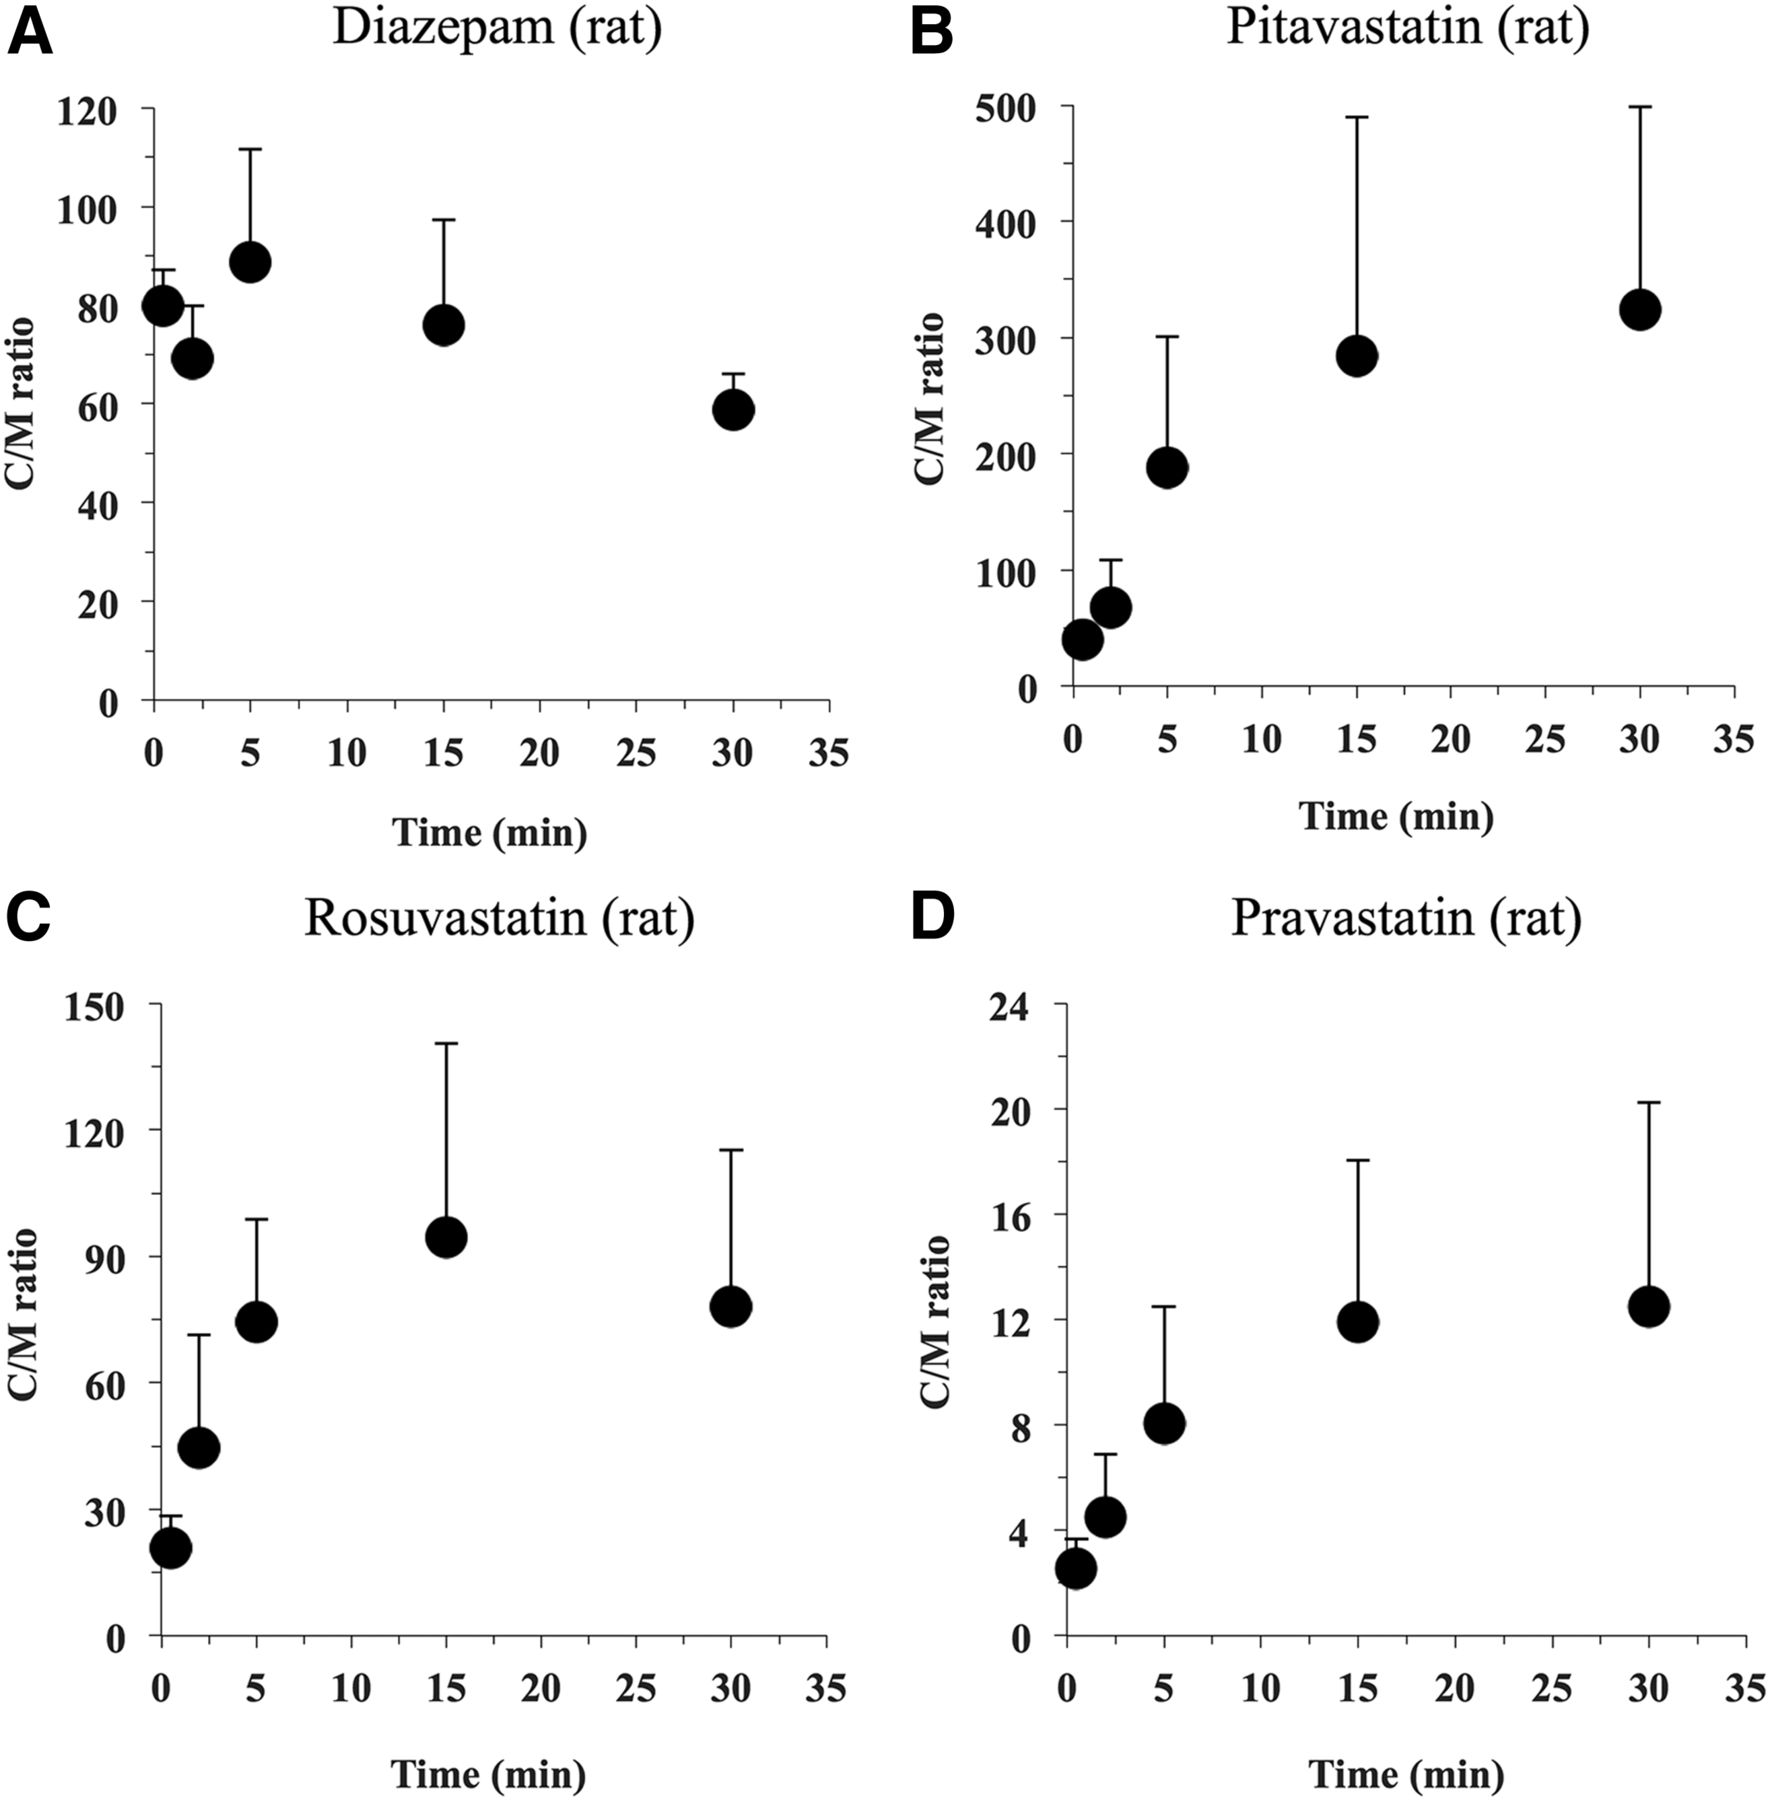
- Fig. 1.
Uptake of diazepam (1 μM; A), pitavastatin (1 μM; B), rosuvastatin (1 μM; C), and pravastatin (1 μM; D) by rat hepatocytes measured after incubation at 37°C for 0.5–30 minutes. The data are presented as mean + S.D. (n = 3).
- Fig. 2.
Uptake of diazepam (1 μM; A and E), pitavastatin (1 μM; B and F), rosuvastatin (1 μM; C and G), and pravastatin (1 μM; D and H) by human hepatocytes measured after incubation at 37°C for 0.5–60 minutes. (A–D) Cryopreserved human hepatocytes from a single donor (Lot Hu8075) were used. (E–H) Pooled cryopreserved human hepatocytes from 20 mixed-sex donors (Lot TFF) were used. The data are presented as mean + S.D. (n = 3).
- Fig. 3.
Comparison of Kp,uu and fT,cell for three statins in rat and human hepatocytes obtained by two different methods. (A and C) Kp,uu,V0 and fT,cell,V0 in rat hepatocytes derived from a previous report (Yabe et al., 2011) are plotted against Kp,uu,ss and fT,cell,ss obtained in the present study as closed symbols. Kp,uu,V0 and fT,cell,V0 obtained in the present study are plotted against Kp,uu,ss and fT,cell,ss as open symbols. (B and D) Kp,uu,V0 and fT,cell,V0 in human hepatocytes from a single donor (Lot Hu8075) are plotted against Kp,uu,ss and fT,cell,ss obtained in the present study as gray symbols. Kp,uu,V0 and fT,cell,V0 in pooled human hepatocytes from 20 gender donors (Lot TFF) are plotted against Kp,uu,ss and fT,cell,ss as open symbols. 1, pitavastatin; 2, rosuvastatin; 3, pravastatin. Solid and dashed lines denote unity and threefold boundaries, respectively. The data are presented as mean + S.D. for the x- and y-axis (n = 3).
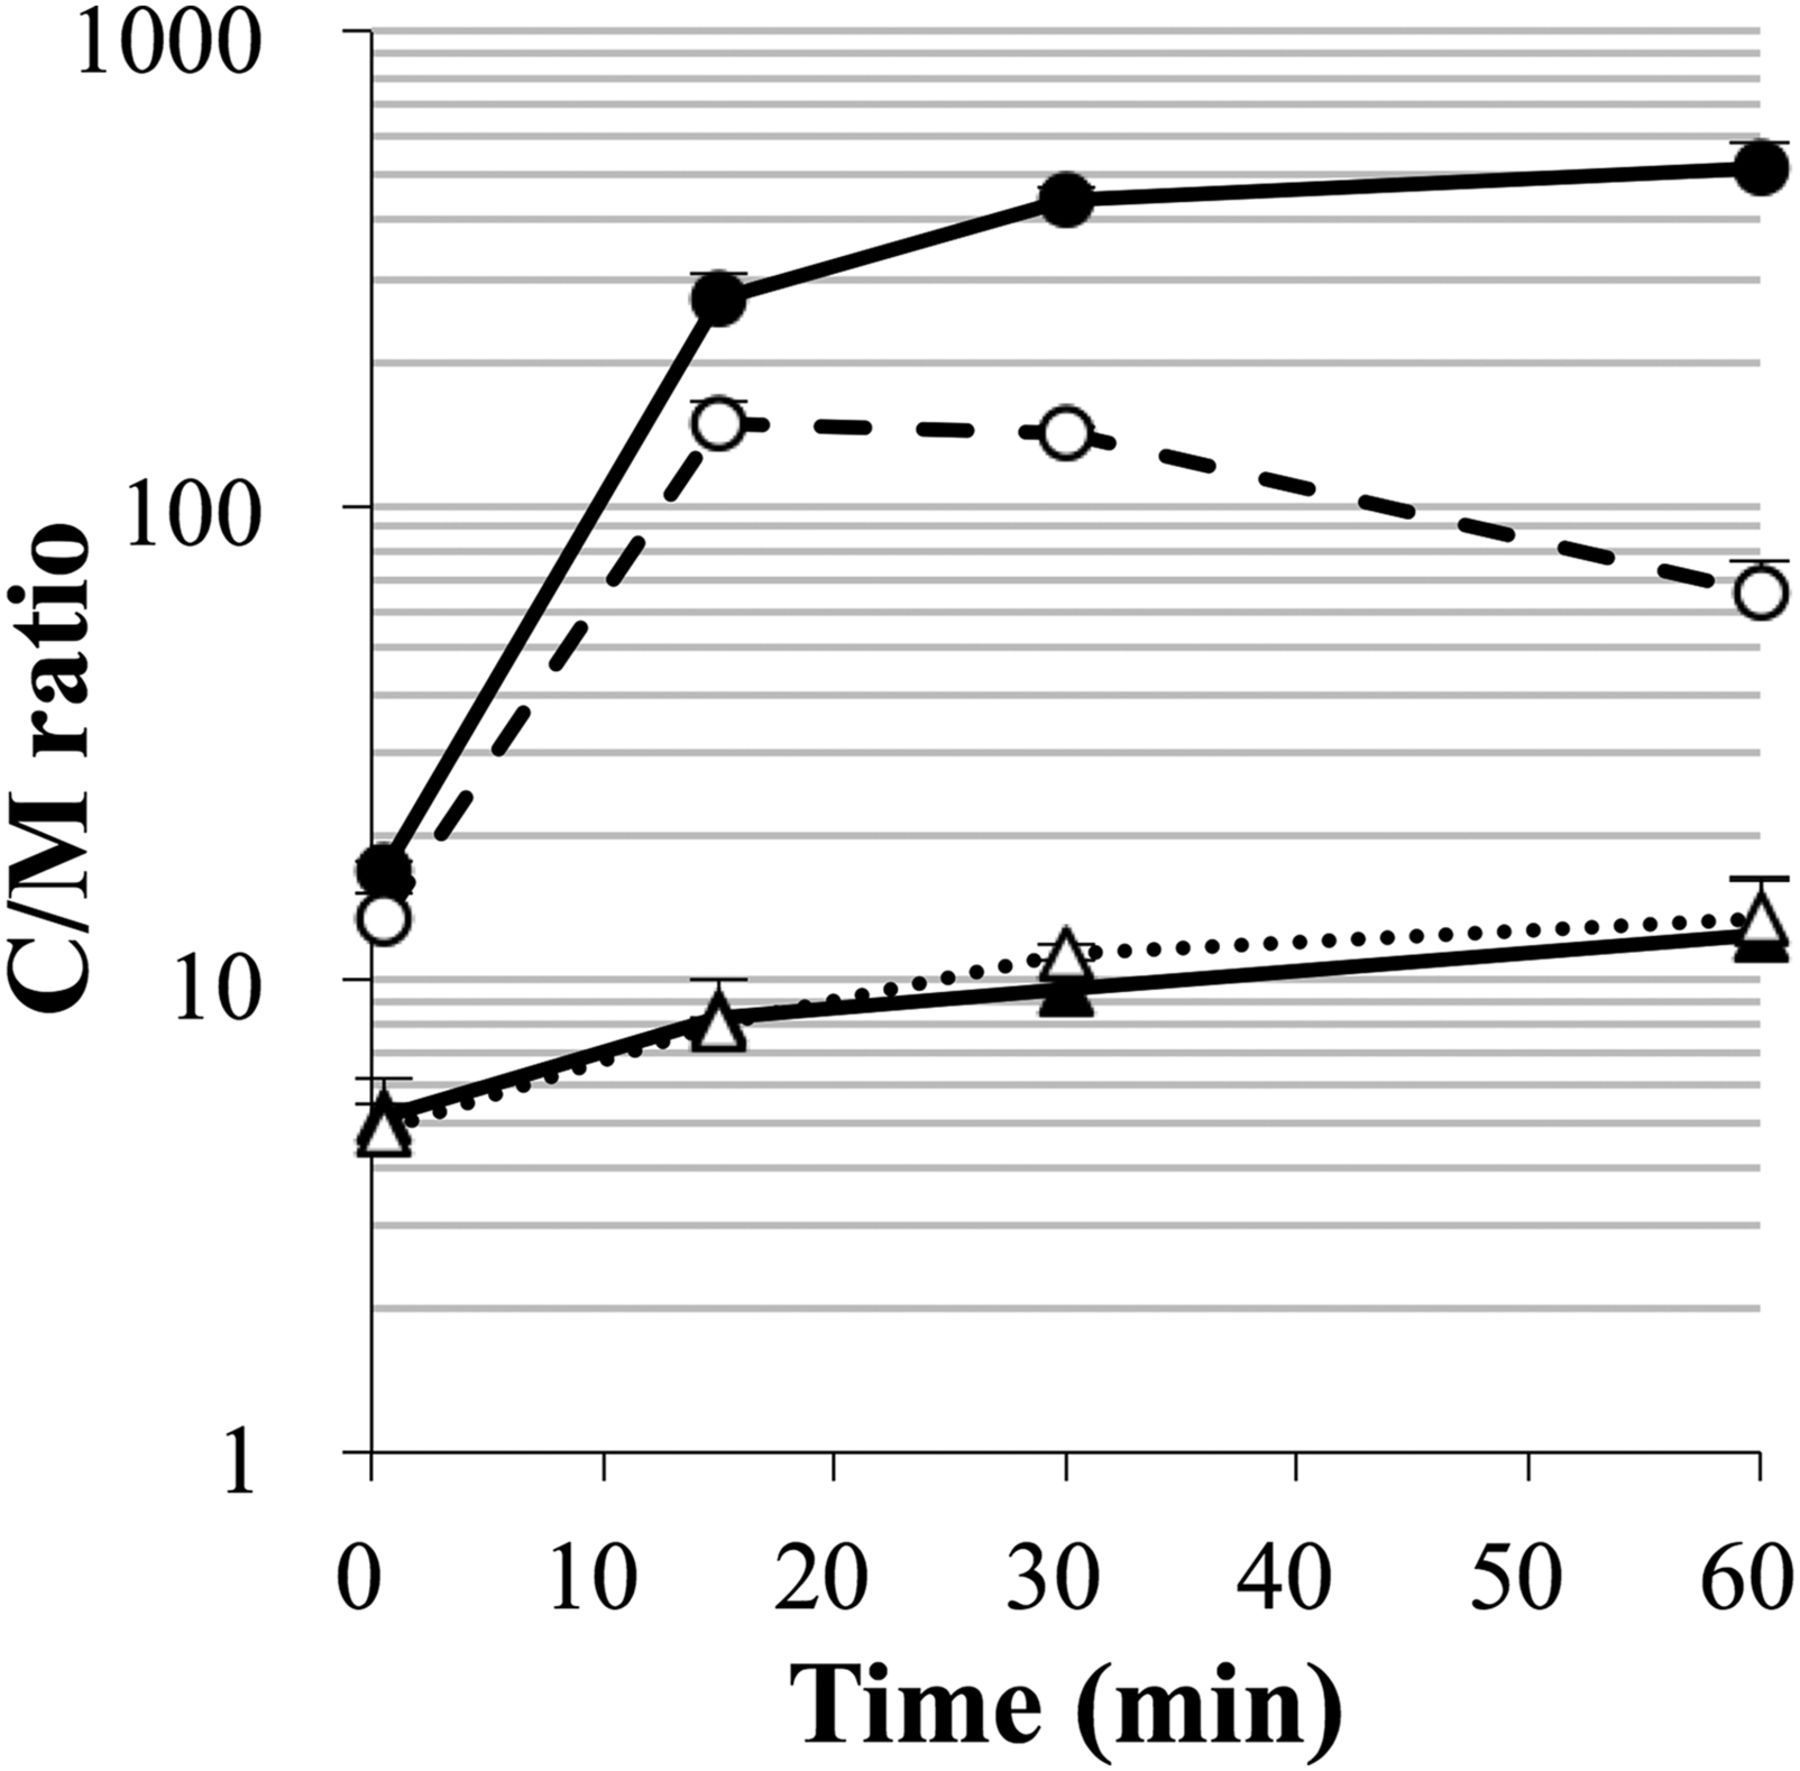
- Fig. 4.
Uptake of TPP+ by human hepatocytes measured after incubation at 37°C (circles) or on ice (triangles) for 0.5–60 minutes. Hepatocytes were incubated with 3 μM TPP+ (closed symbols) or both 3 μM TPP+ and 20 μM amphotericin B (open symbols). Pooled cryopreserved human hepatocytes from 50 mixed-sex donors (Lot HUE50C) were used. The data are presented as mean + S.D. (n = 3).
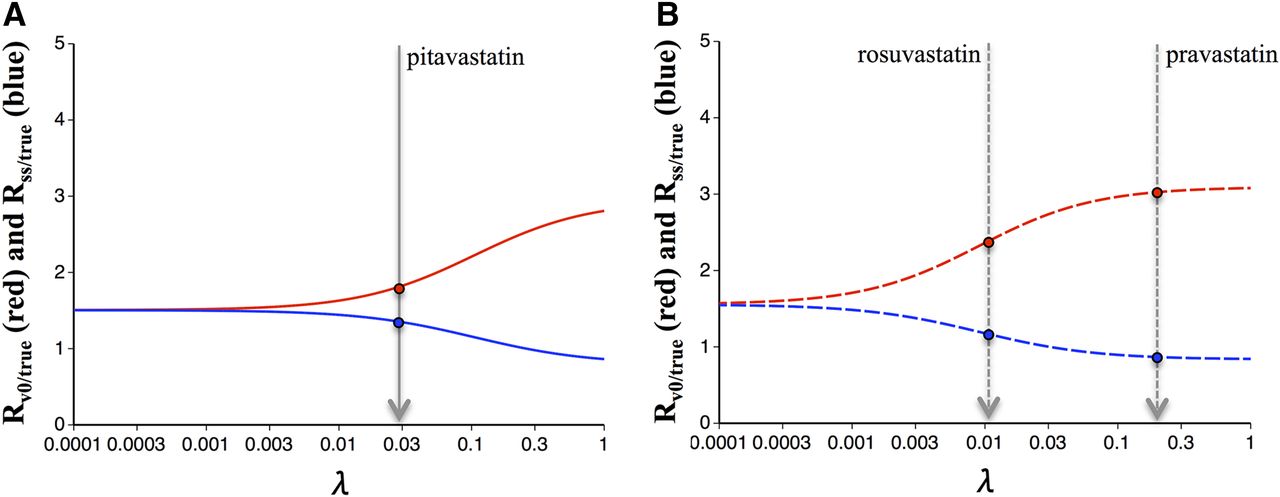
- Fig. 5.
Theoretical simulation of Kp,uu,ss/Kp,uu,true (= Rss/true: blue) and Kp,uu,V0/Kp,uu,true (= RV0/true: red) using eqs. 12 and 13. (A) The solid line represents the simulation result for pitavastatin. (B) The broken line represents simulation results for rosuvastatin and pravastatin. Arrows represent the λ for statins estimated from our experiments with Caco-2 cells.
- Fig. 6.
Comparison of Kp,uu,ss,corrected and Kp,uu,V0,corrected corrected by eqs. 14 and 15 using Rss/true and RV0/true (Table 8). (A) Closed symbols: original Kp,uu,V0 in rat hepatocytes were obtained from a previous report (Yabe et al., 2011). Open symbols: original Kp,uu,V0 values were obtained in the present study. (B) Gray symbols: original Kp,uu,V0 values were obtained in human hepatocytes from a single donor (Lot Hu8075). Open symbols: original Kp,uu,V0 values were obtained in pooled human hepatocytes from 20 mixed-sex donors (Lot. TFF). 1, pitavastatin; 2, rosuvastatin; 3, pravastatin. Solid and dashed lines denote unity and threefold boundaries, respectively. The data are presented as mean + S.D. for the x- and y-axis (n = 3).


Tables
- TABLE 1
Determination of λ based on the pH-dependent permeation data of statins observed in Caco-2 cells
Values are shown as the mean ± S.D.
Drug fi,iona fi,uiona fo,iona fo,uiona pKab PSdif,inf,uion,Caco-2c× 10−6 λc µL/min/well Pitavastatin 0.857 0.143 0.905 0.095 4.46 3487 ± 1403 0.0282 ± 0.0204 Rosuvastatin 0.986 0.014 0.991 0.009 4.6 714 ± 68 0.0112 ± 0.0035 Pravastatin 0.986 0.014 0.991 0.009 4.6 111 ± 19 0.188 ± 0.038 ↵a The fi,ion and fo,ion were calculated based on Henderson–Hasselbalch equation assuming that intracellular pH and medium pH are 7.2 and 7.4, respectively. The fi,uion and fo,uion were subtracted fi,ion and fo,ion from one, respectively.
↵b Fixed at values obtained from the manufacturer’s Interview Forms.
↵c The PSdif,inf,uion,Caco-2 and λ were determined by fitting eq. 9 to the pH-dependent permeation data of statins observed in Caco-2 cells (Supplemental Fig. 1).
- TABLE 2
Kp,uu,ss and fT,cell,ss in rat hepatocytes
Values are shown as the mean ± S.D. (n = 3).
Drug C/M Ratioa Kp,uu,ssb fT,cell,ssb 37°C On ice Diazepam 58.9 ± 7.3 69.3 ± 9.7 0.851 ± 0.024 0.0147 ± 0.0022 Pitavastatin 324 ± 174 29.6 ± 11.5 10.8 ± 4.4 0.0381 ± 0.0167 Rosuvastatin 78.1 ± 37.1 7.80 ± 4.07 13.1 ± 7.7 0.149 ± 0.060 Pravastatin 12.5 ± 7.7 1.80 ± 0.56 6.69 ± 2.76 0.600 ± 0.217 - TABLE 3
Kinetic parameters for the initial uptake rates of pitavastatin, rosuvastatin, and pravastatin in rat hepatocytes
Values are shown as the mean ± S.D.
Drug Vmaxa Kma Vmax/Km PSdifa Kp,uu,V0b fT,cell,V0b pmol/min/106 Cells μM μL/min/106 Cells μL/min/106 Cells Pitavastatin 893 ± 124 5.43 ± 1.29 164 ± 45 3.00 ± 1.41 55.8 ± 29.9 0.172 ± 0.131 Rosuvastatin 250 ± 80 2.86 ± 1.82 87.4 ± 62.3 1.76 ± 1.15 50.7 ± 48.0 0.649 ± 0.688 Pravastatin 178 ± 11 20.3 ± 1.4 8.77 ± 0.81 1.16 ± 0.08 8.56 ± 0.87 0.685 ± 0.428 ↵a The initial uptake rate in rat hepatocytes was calculated from the uptake of [3H]pitavastatin, [3H]rosuvastatin, and [3H]pravastatin for 0.5–1.5 minutes. Kinetic parameters are obtained by fitting to the data at seven concentrations (0.1, 0.3, 1, 3, 10, 30, and 100 µM for all statins; Supplemental Fig. 2) using eq. 4.
↵b The Kp,uu,V0 and fT,cell,V0 were calculated using eqs. 5 and 6, respectively. C/M ratios at 37°C (Table 2) were used for the calculation of the fT,cell,V0.
- TABLE 4
Kp,uu,ss and fT,cell,ss in human hepatocytes
Values are shown as the mean ± S.D. (n = 3).
Drug Lot C/M Ratioc Kp,uu,ssd fT,cell,ssd 37°C On ice Diazepam Hu8075a 216 ± 20 181 ± 38 1.19 ± 0.51 0.00553 ± 0.00115 TFFb 124 ± 53 303 ± 22 0.409 ± 0.247 0.00330 ± 0.00024 Pitavastatin Hu8075a 471 ± 88 35.2 ± 2.6 13.4 ± 2.7 0.0284 ± 0.0021 TFFb 150 ± 2.6 21.8 ± 3.2 6.92 ± 1.02 0.0460 ± 0.0068 Rosuvastatin Hu8075a 52.2 ± 8.6 4.51 ± 0.41 11.6 ± 2.2 0.222 ± 0.020 TFFb 27.2 ± 2.5 4.28 ± 0.53 6.36 ± 1.06 0.234 ± 0.029 Pravastatin Hu8075a 3.73 ± 0.73 1.84 ± 0.12 2.03 ± 0.54 0.545 ± 0.035 TFFb 2.65 ± 1.29 2.07 ± 0.64 1.28 ± 0.89 0.484 ± 0.151 ↵a Isolated cryopreserved human hepatocytes (Lot Hu8075) were incubated with diazepam (0.2 µM), pitavastatin (0.1 µM), rosuvastatin (0.1 µM), and pravastatin (0.2 µM).
↵b Pooled cryopreserved human hepatocytes from 20 mixed-sex donors (Lot TFF) were incubated with diazepam (1 µM), pitavastatin (0.5 µM), rosuvastatin (0.5 µM), and pravastatin (1 µM).
↵c C/M ratios at 37°C and on ice were calculated using the uptake data at 30 minutes and 60 minutes, respectively (Fig. 2).
↵d The Kp,uu,ss and fT,cell,ss were calculated from C/M ratios using eqs. 2 and 3, respectively.
- TABLE 5
Kinetic parameters for the initial uptake of pitavastatin, rosuvastatin, and pravastatin in human hepatocytes
Values are shown as the mean ± S.D.
Drug Lot Vmax Km Vmax/Km PSdif Kp,uu,V0d fT,cell,V0d pmol/min/106 Cells μM μL/min/106 Cells μL/min/106 Cells Pitavastatin Hu8075a 403 ± 84 4.77 ± 1.80 84.5 ± 36.4 0.388 ± 0.912 219 ± 521 0.465 ± 1.110 TFFb 148 ± 66.1 1.78 ± 1.04 83.1 ± 61.1 4.36 ± 0.70 20.1 ± 14.4 0.134 ± 0.096 Rosuvastatin Hu8075a 198 ± 50 21.5 ± 7.8 9.21 ± 4.07 0.0462 ± 0.1547 200 ± 673 3.83 ± 12.91 TFFb 23.0 ± 8.6 4.49 ± 1.72 5.12 ± 2.75 2.07 ± 0.279 3.47 ± 1.41 0.128 ± 0.053 Pravastatin Hu8075a 93.8 ± 56.0 127 ± 81 0.739 ± 0.645 0.0137 ± 0.0922 54.8 ± 363.7 14.7 ± 97.5 TFF Not determinedc ↵a The initial uptake rate in isolated cryopreserved human hepatocytes (Lot Hu8075) was calculated from the uptake of [3H]pitavastatin, [3H]rosuvastatin, and [3H]pravastatin for 0.5–2.0 minutes. Kinetic parameters are obtained by fitting to the data at several concentrations (0.1, 0.3, 1, 3, 10, 30, and 100 µM for pitavastatin; 0.1, 0.3, 1, 3, 10, 30, and 300 µM for rosuvastatin; 1, 3, 100, and 300 µM for pravastatin; Supplemental Fig. 3, A–C) using eq. 4.
↵b The initial uptake rate in pooled cryopreserved human hepatocytes from 20 mixed-sex donors (Lot TFF) was calculated from the uptake of [3H]pitavastatin and [3H]rosuvastatin for 0.5–1.5 minutes. Kinetic parameters are obtained by fitting to the data at several concentrations (0.1, 0.3, 1, 3, 10, 30, and 100 µM for pitavastatin; 0.1, 0.3, 1, 3, 10, 30, and 300 µM for rosuvastatin; Supplemental Fig. 3, D and E) using eq. 4.
↵c Not determined in Lot TFF because a concentration (0.5–300 µM)-dependent saturation of the uptake of pravastatin was not observed clearly.
↵d The Kp,uu,V0 and fT,cell,V0 were calculated using eqs. 5 and 6, respectively. C/M ratios at 37°C (Table 4) were used for the calculation of the fT,cell,V0.
- TABLE 6
fT,homogenate in human liver homogenate
Values are shown as the mean ± S.D. (n = 3).
Drug fT,homogenate 37°C On Ice 37°C/On Ice Ratio Diazepam 0.0259 ± 0.0018 0.0242 ± 0.0016 1.07 ± 0.10 Pitavastatin 0.0301 ± 0.0017 0.0344 ± 0.0018 0.875 ± 0.067 Rosuvastatin 0.237 ± 0.037 0.206 ± 0.025 1.15 ± 0.23 Pravastatin 0.183 ± 0.022 0.167 ± 0.020 1.10 ± 0.19 - TABLE 7
Theoretical calculation of the ΔΨ using the measured C/M ratios of TPP+
Values are shown as the mean ± S.D. (n = 4).
Temperature C/M Ratio ΔΨa Φa −AMB +AMB mV 37°C 442.7 ± 31.1 142.4 ± 4.3 −30.22 ± 2.04 3.109 ± 0.237 On ice 9.5 ± 1.4 11.3 ± 0.5 4.97 ± 4.12 0.840 ± 0.128 ↵a ΔΨ and Φ were calculated using eq. 10 and Supplemental Equation 5, respectively.
- TABLE 8
Theoretical calculation of Kp,uu,true, Kp,uu,V0, and Kp,uu,ss using the calculated ΔΨ
Drug Lot Kp,uu,truea Kp,uu,V0a Kp,uu,ssa RV0/trueb Rss/trueb Pitavastatin Hu8075 90.7 198 106 2.18 1.17 TFF 8.35 18.3 9.75 2.18 1.17 Rosuvastatin Hu8075 72.4 199 71.9 2.74 0.994 TFF 1.26 3.45 1.25 2.74 0.994 Pravastatin Hu8075 17.9 54.5 15.2 3.05 0.850 TFF Not calculatedc ↵a Theoretical values of Kp,uu,true, Kp,uu,V0, and Kp,uu,ss were calculated by Supplemental Equations 6, 8, and 11, respectively. The fi,ion, fo,ion, fi,uion, fo,uion, λ (Table 1), Vmax/Km (Table 5), and PSdif,inf,uion in each lot of human hepatocytes determined by fo,ion, fo,uion, λ, and PSdif (Table 5), according to eq. 7, were used for the calculation.
↵b RV0/true = Kp,uu,V0/ Kp,uu,true and Rss/true = Kp,uu,ss/ Kp,uu,true were calculated by eqs. 11 and 12.
↵c Not calculated for Lot TFF because kinetic parameters (Km, Vmax, and PSdif) of pravastatin were not determined (Table 5).
Data Supplement
- Supplemental Data -
Supplemental Text - Theoretical derivation of the equations for Kp,uu considering the
plasma membrane potential of cells and the fraction of drugs ionizedSupplemental Table 1 - Intracellular volumes of rat and human hepatocytes
Supplemental Figure 1 - The pH-dependent membrane permeation clearance of pitavastatin (A),
rosuvastatin (B), and pravastatin (C) across Caco-2 cell monolayers was measured in an apical-tobasal
direction with an apical pH of 5.5, 6.0, 6.5, and 7.4, and a basal pH of 7.4 in the presence of
rifamycin SV (100 mu-M), cyclosporin A (10 mu-M), and Ko143 (10 mu-M)Supplemental Figure 2 - Concentration-dependent uptake of pitavastatin (A), rosuvastatin (B), and
pravastatin (C) by rat hepatocytesSupplemental Figure 3 - Concentration-dependent uptake of pitavastatin (A, D), rosuvastatin (B, E),
and pravastatin (C) by human hepatocytes
- Supplemental Data -


