


Abstract
The liver abundantly expresses various drug-metabolizing enzymes and, thus, plays a central role in drug metabolism. In this regard, cytochrome P450 (CYP) is responsible for drug metabolism in the liver. Therefore, since CYP3A4 accounts for approximately 30% of the CYPs, the prediction of hepatic CYP3A4-mediated pharmacokinetics is essential for drug development. Human induced pluripotent stem cell-derived hepatocytes (hiHep) have become a major model of drug metabolism in drug development studies. However, drug metabolizing activities, such as those involving CYP3A4, are lower in hiHep than in human primary hepatocytes (HPHs). Recently, it was revealed that celecoxib upregulates the expression of CYPs to normal levels through the activation of signal transducer and transcriptional activation factor 5 (STAT5). Therefore, we investigated whether celecoxib treatment could normalize the low drug metabolism activities in hiHep. The mRNA expression levels of hepatic markers [asialoglycoprotein receptor 1 (ASGR1) and tyrosine aminotransferase (TAT)] and metabolic enzymes (UDP-glucuronosyltransferase 1A1 and CYP3A4) in hiHep significantly increased after celecoxib treatment. These mRNA expression levels were 7-, 1/3-, 1/2-, and 1/10-fold of the HPHs cultured for 48 hours, respectively. Furthermore, CYP3A4 activity significantly increased. To investigate the mechanism of CYP3A4 mRNA upregulation, we analyzed the phosphorylation of STAT5 after celecoxib treatment and found it to be significantly increased. Moreover, the increase in CYP3A4 mRNA expression was attenuated by cotreatment with STAT5 inhibitor. These results suggest that celecoxib promotes hepatocyte differentiation of hiHep by activating STAT5 and is useful for the generation of functional hiHep.
Introduction
The liver plays a central role in drug metabolism of pharmaceutical agents because of its abundant expression of various drug-metabolizing enzymes. Especially, cytochrome P450 (CYP) 3A4 accounts for most of the drug-metabolizing enzymes in the liver and is involved in the metabolism of various clinically used pharmaceutical agents (Guengerich et al., 1986; Shimada et al., 1994; Bu, 2006; Liu et al., 2007). Therefore, the prediction of hepatic CYP3A4-mediated pharmacokinetics is essential during drug development. Human primary hepatocytes (HPHs) and liver microsomes are widely used for drug metabolism studies because they accurately predict in vivo drug metabolism (Olsen et al., 1997; Puviani et al., 1998; Lake et al., 2009). However, the use of HPHs and liver microsomes has disadvantages, such as difficulty in obtaining fresh human tissue, the presence of remarkable lot-to-lot variations, and difficulty in maintaining a stable cell phenotype with culturing (Brandon et al., 2003; Borlak and Klutcka, 2004; Swift et al., 2010). Thus, the use of high-quality HPHs is unreliable and one of the impediments to drug development. To circumvent this issue, human induced pluripotent stem (iPS) cell-derived hepatocytes (hiHep) have become a major focus as a cell source for drug development studies.
Human iPS cells exhibit almost infinite proliferation and multilineage differentiation abilities (Takahashi et al., 2007). Differentiation methods from human iPS cells to hepatocytes, such as three-dimensional culture using special culture plates and coculture with other cells, have been reported (Nagamoto et al., 2012; Takayama et al., 2012b, 2013; Subramanian et al., 2014). Although these differentiation methods are useful for hepatocyte maturation, they require complicated manipulations and special materials. Therefore, the acquisition of a large number of iPS-derived hepatocytes is difficult, and the development of simpler methods for hepatocyte differentiation is needed. It is important to note that the method used to differentiate hiHep must lead to the development of a mature phenotype, because the gene expressions and activities of drug-metabolizing enzymes, such as CYP3A4, can be lower in hiHep than in HPHs.
Recently, several studies have reported that human iPS cells can be differentiated into hepatocytes using small-molecule compounds (Borowiak et al., 2009; Shan et al., 2013; Tahamtani et al., 2013; Kondo et al., 2014b). Generally, small-molecule compounds are inexpensive and highly stable, without lot-to-lot variations. Thus, these compounds are highly useful for hepatocyte differentiation from human iPS cells.
Celecoxib is a widely used small-molecule compound and a nonsteroidal anti-inflammatory drug (NSAID). Celecoxib shows anti-inflammatory, analgesic, and antipyretic effects by inhibiting cyclooxygenase 2 (COX-2), which is involved in the production of inflammatory mediators such as prostaglandin E2 (Grosch et al., 2006). NSAIDs have various actions, such as the activation of peroxisome proliferator-activated receptor γ (PPARγ) and inhibition of Wnt/β-catenin signaling (Deng et al., 2013; Tai et al., 2014; Gitau et al., 2015; Puhl et al., 2015). Celecoxib also exhibits anticancer effects by suppressing the phosphorylation of signal transducer and activator of transcription 3 (STAT3) (Reed et al., 2011). Recently, celecoxib has been shown to inhibit hepatocarcinogenesis in rats and to restore the expression of various CYPs to normal levels by the activation of STAT5 (Arellanes-Robledo et al., 2010). This finding suggests that STAT5 is an important transcription factor for regulating the expression of CYPs. Thus, we hypothesized that celecoxib could increase the expression of drug-metabolizing enzymes during the differentiation of human iPS cells to hepatocytes.
This study aimed to investigate the effects of celecoxib on the differentiation of human iPS cells into hepatocytes and identify the mechanism of action.
Materials and Methods
Materials.
The human iPS cell lines, Fetch (#16), Tic (#25), and Windy (#51), derived from the human embryonic lung fibroblast cell line MRC-5 were provided by Umezawa et al. of the National Center for Child Health and Development. Activin A was purchased from Shenandoah Biotechnology, Inc. (Warwick, PA). Cryopreserved HPHs [lot HPCH10/1310262; pool of 10 (5 men and women each) donors aged 20–71 years] were obtained from XenoTech (Lenexa, KS). Hepatocyte growth factor was purchased from PeproTech, Inc. (Rocky Hill, NJ). Oncostatin M, dexamethasone, valproic acid, (R)-(+)-trans-N-(4-pyridyl)-4-(1-aminoethyl)-cyclohexanecarboxamide dihydrochloride (Y-27632), nonessential amino acids, acetylsalicylic acid, meloxicam, rifampicin, human recombinant growth hormone, 1:1 mixture of Dulbecco’s modified Eagle’s medium and Ham’s nutrient mixture F-12 (DMEM/F12), and mouse monoclonal anti-human glyceraldehyde-3-phosphate dehydrogenase (GAPDH) antibody were purchased from Wako Pure Chemical Industries (Osaka, Japan). Fetal bovine serum was purchased from Biowest (Nuaillé, France). Knockout serum replacement, knockout-DMEM, RPMI plus Glutamax medium, Glutamax, and Alexa Fluor 488 goat anti-mouse IgG were purchased from Invitrogen Life Technologies Co. (Carlsbad, CA). BD Matrigel matrix growth factor reduced (Matrigel) was purchased from BD Biosciences (Bedford, MA). Accutase, dimethyl sulfoxide, and pimozide were purchased from Nacalai Tesque (Kyoto, Japan). 2-Mercaptoethanol was purchased from Sigma-Aldrich Co. (St. Louis, MO). Celecoxib, ketoprofen, nimesulide, ketoconazole, and pioglitazone were purchased from Tokyo Chemical Industry Co., Ltd. (Tokyo, Japan). Cosmedium 004 for Hepatocyte (Cosmedium) was purchased from COSMO Bio Co. (Tokyo, Japan). The potassium bisperoxo(1,10-phenanthroline)oxovanadate (V) trihydrate [bpV(phen)] was purchased from Cayman Chemical (Ann Arbor, MI). Mouse monoclonal anti-human albumin (ALB) antibody was purchased from Abcam (Cambridge, UK). Rabbit polyclonal anti-human STAT3 antibody was purchased from Proteintech (Chicago, IL). Mouse monoclonal anti-human α-fetoprotein (AFP) antibody was purchased from Santa Cruz Biotechnology, Inc. (Dallas, TX). Anti-human hepatocyte nuclear factor (HNF) 4α, anti-human STAT5, anti-human phospho-STAT3 (p-STAT3), and anti-human phospho-STAT5 (p-STAT5) rabbit monoclonal antibodies were purchased from Cell Signaling Technology, Inc. (Danvers, MA). BlockAce was purchased from DS Pharma Biomedical Co., Ltd. (Osaka, Japan). Cell counting kit-8 was purchased from Dojindo Molecular Technologies, Inc. (Kumamoto, Japan).
Cell Culture.
Undifferentiated iPS cells were cultured as reported previously (Kondo et al., 2014a). In brief, human iPS cells were cultured in DMEM/F12 containing 20% knockout serum replacement, 2 mM l-glutamine, 1% MEM nonessential amino acids, 0.1 mM 2-mercaptoethanol, and 5 ng/ml FGF2 at 37°C in 5% CO2, and the medium was changed daily. The human iPS cells were cultured on mitomycin C-treated mouse embryonic fibroblasts.
Cryopreserved HPHs were cultured according to manufacturer’s instructions. In brief, cryopreserved HPHs were thawed using thawing medium without additives (Biopredic, Rennes, France) and the cells were cultured on collagen type I-coated plates in basal hepatic cell medium (Biopredic) containing additives for hepatocyte seeding medium (Biopredic) for 12 hours. Then, the medium was changed with basal hepatic cell medium containing additives for hepatocyte culture (Biopredic), and the cells were cultured for 36 hours.
Differentiation of iPS Cells into Hepatocytes.
The three human iPS cell lines, Fetch (#16), Tic (#25), and Windy (#51), were differentiated into hepatocytes based on our previous study (Kondo et al., 2014b). Except for the result of the comparison using the iPS cell lines (Fig. 3A), we used Windy (#51) for all experiments. Briefly, the iPS cells were differentiated into endodermal cells by culturing in the presence of 100 ng/ml activin A for 5 days. The resulting endodermal cells (1 × 10⁵ cells/cm2) were passaged onto Matrigel-coated 60-mm dishes and 24- or 96-well plates. The endodermal cells were differentiated into hepatoblast-like cells by culturing in the presence of 1% dimethyl sulfoxide for 7 days, and these hepatoblast-like cells were then matured by culturing in Cosmedium containing 10 ng/ml hepatocyte growth factor, 20 ng/ml oncostatin M, and 100 nM dexamethasone for 10 days. During the 10 days, valproic acid was added only for the first 7 days. Finally, the cells were cultured in Cosmedium for 3 days. Celecoxib and other compounds (acetylsalicylic acid, ketoprofen, meloxicam, and nimesulide) were added to the culture medium at a final concentration of 25 µM, and human recombinant growth hormone was added at a final concentration 4 µg/l for 8 days from day 16. In the induction study, the differentiated cells were treated with 40 µM rifampicin for the final 48 hours of culture.
Immunofluorescence Staining.
The differentiated cells were washed twice with phosphate-buffered saline (PBS), fixed in 4% paraformaldehyde for 20 minutes at room temperature, and then permeabilized in 0.1% Triton X-100 for 10 minutes at room temperature. After washing three times with PBS, the cells were blocked with 2% bovine serum albumin for 30 minutes at room temperature. Following the blocking step, the cells were incubated with anti-ALB (dilution, 1:200), anti-AFP (dilution, 1:100), or anti-HNF4α antibody (dilution, 1:200) overnight at 4°C. The cells were washed three times with PBS and incubated with Alexa Fluor 488-labeled secondary antibody (dilution, 1:500) for 60 minutes at room temperature. Rhodamine phalloidin (dilution, 1:200) was added with the secondary antibody. After washing three times with PBS, the cells were incubated with 1 µg/ml 4,6-diamidino-2-phenylindole for 5 minutes at room temperature. After washing with PBS, the cells were observed using an ECLIPSE Ni microscope (Nikon Inc., Tokyo, Japan).
Quantitative Reverse Transcription-Polymerase Chain Reaction.
Total RNA was extracted using the Agencourt RNAdvance tissue kit (Beckman Coulter, Brea, CA) according to the manufacturer’s instructions. cDNA was synthesized from 0.5 ng total RNA using ReverTra Ace qPCR RT Master Mix (TOYOBO, Osaka, Japan). The quantitative polymerase chain reaction (qPCR) was performed using the KAPA SYBR FAST qPCR Kit (KAPA Biosystems, Wilmington, MA) and detected using the ABI 7300 real-time PCR System with SDS software version 1.4 (Thermo Fisher Scientific Inc., Waltham, MA). The primers are listed in Table 1. The gene expression values were normalized to those of hypoxanthine guanine phosphoribosyltransferase 1.
Polymerase chain reaction primer sequences
Determination of CYP3A4 Activity.
The CYP3A4 activity of differentiated cells was measured using the P450-Glo CYP3A4 assay system (Promega Corporation, Madison, WI). In brief, the differentiated cells were washed twice with PBS and then incubated in Cosmedium containing 3 µM Luciferin isopropyl acetal for 24 hours at 37°C in an atmosphere of 5% CO2. For the CYP3A4 inhibition study, 10 µM ketoconazole was added to the Cosmedium with the Luciferin isopropyl acetal. After that, 50 µl of culture supernatant was transferred to each well of a 96-well plate, and an equal volume of Luciferin detection reagent was added to each well. The plate was equilibrated for 20 minutes at room temperature. The luminescence was measured with a Synergy 2 modular multi-mode reader (BioTek, Winooski, VT). To normalize the CYP3A4 activity, total protein of the differentiated cells was measured using a Pierce BCA Protein Assay Kit (Thermo Fisher Scientific Inc.) according to the manufacturer’s protocol.
Western Blotting.
The inhibition of STAT3 and activation of STAT5 were examined using Western blotting. Cells were harvested in cell lysis buffer containing 50 mM Tris, pH 6.8, 2% SDS, 10% glycerol, and 10% 2-mercaptoethanol. The proteins were separated using 10% SDS polyacrylamide gel electrophoresis and transferred onto a polyvinylidene difluoride membrane. The membranes were blocked with BlockAce for 60 minutes at room temperature and then incubated with anti-GAPDH (dilution, 1:1000), anti-STAT3 (dilution, 1:2000), anti-p-STAT3 (dilution, 1:2000), anti-STAT5 (dilution, 1:2000), or anti-p-STAT5 (dilution, 1:2000) antibodies overnight at 4°C. The membranes were incubated with the peroxidase-conjugated secondary antibody (dilution, 1:1000 for GAPDH, 1:7000 for STAT3 and STAT5, 1:15000 for p-STAT3 and p-STAT5) for 60 minutes at room temperature. Afterward, the protein bands were detected using Pierce ECL Western blotting substrate (Thermo Fisher Scientific Inc.) for GAPDH detection, ECL Prime western blotting detection reagent (GE Healthcare, Little Chalfont, GB) for STAT3 and STAT5 detection, and SignalFire Elite ECL reagent (Cell Signaling Technology) for p-STAT3 and p-STAT5 detection. The proteins were detected and analyzed using an Amersham Imager 600 (GE Healthcare).
Statistical Analysis.
We repeated each experiment three times, and all data are expressed as mean ± S.D. Statistical significance was assessed using two-tailed Student’s t tests or one-way factorial analysis of variance with Tukey’s HSD post hoc test for multiple comparisons. Statistical analyses were performed using the SPSS Statistics software package, version 18.0 (IBM Japan, Tokyo, Japan), and P values <0.05 or <0.01 (two-tailed) indicated statistically significant differences.
Results
Differentiation of Human iPS Cells into Hepatocytes Using Celecoxib.
To investigate whether celecoxib contributes to the maturation of human iPS-derived hepatocytes, it was added to the culture medium from days 16 to 24 (Fig. 1A). Differentiated hepatocytes had flat, cobblestone morphologies and were binucleated, which are typical morphologies of mature hepatocytes (Fig. 1B); they were also positive for Periodic acid-Schiff staining (Fig. 1C). Moreover, immunofluorescence staining indicated that almost all hiHep expressed hepatocyte markers such as ALB, AFP, and HNF4α, even with the addition of celecoxib (Fig. 1D).

Hepatocyte differentiation from human iPS cells using celecoxib. (A) Schematic timeline for hepatocyte differentiation of human iPS cells. (B) Morphology of differentiated hepatocytes. Each bar indicates 100 µm. (C) Images of Periodic acid-Schiff-stained differentiated hepatocytes. Each bar indicates 100 µm. (D) Immunofluorescence staining of various hepatocyte markers in differentiated hepatocytes. Images show immunofluorescence staining for ALB (left), AFP (center), and HNF4α (green) and F-actin (red) (right). Nuclei were counterstained with. Control (Ctrl) represents celecoxib-untreated hiHep, and celecoxib (Cele) represents celecoxib-treated hiHep. AFP, α-fetoprotein; ALB, albumin; HNF4α, hepatocyte nuclear factor 4α.
Effect of Celecoxib on Differentiation of iPS Cells into Hepatocytes.
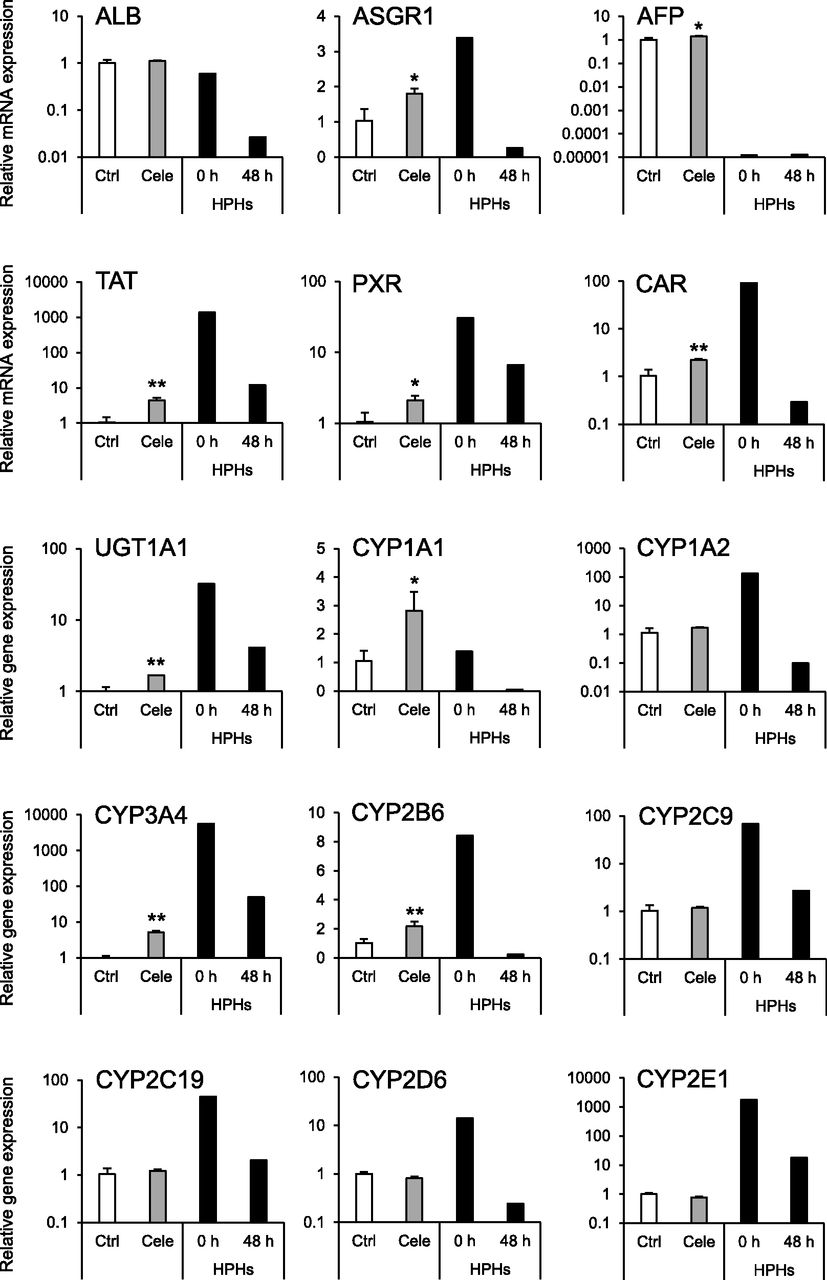
To evaluate the effect of celecoxib on hepatocyte differentiation, the expression levels of hepatocyte marker genes were analyzed. The mRNA expression levels of hepatocyte-specific genes [asialoglycoprotein receptor 1 (ASGR1), AFP, tyrosine aminotransferase (TAT)], nuclear receptor genes [pregnane X receptor (PXR) and constitutive androstane receptor (CAR)], and drug-metabolizing enzyme genes [UDP-glucuronosyltransferase 1A1 (UGT1A1), CYP1A1, CYP3A4, and CYP2B6] were significantly elevated by celecoxib treatment (Fig. 2). Moreover, the mRNA expression levels of CYPs1A2, 2C9, 2C19, 2D6, and 2E1 were not changed by celecoxib treatment. In addition, the expression level of CYP3A4 mRNA was also elevated in other iPS cell lines (Fig. 3A). Furthermore, the expression of CYP3A4 mRNA was significantly induced by treatment with rifampicin in the celecoxib-treated group (Fig. 3B). Similar to mRNA expression, CYP3A4 activity was significantly increased by celecoxib treatment, and this activity was suppressed by ketoconazole (Fig. 3C).

Effects of celecoxib on mRNA expression of hepatocyte markers. RT-qPCR analysis of hepatocyte marker genes in hiHep. Relative mRNA expression levels in celecoxib-untreated hiHep [control (Ctrl)] were set to 1, and the values were normalized to hypoxanthine guanine phosphoribosyltransferase 1 (HPRT) levels. Results are presented as means ± S.D. (n = 3). Statistical analysis was performed using Student’s t tests: *P < 0.05; **P < 0.01 vs. Ctrl. AFP, α-fetoprotein; ALB, albumin; ASGR1, asialoglycoprotein receptor 1; CAR, constitutive androstane receptor; CYP, cytochrome P450; PXR, pregnane X receptor; TAT, tyrosine aminotransferase; UGT, UDP-glucuronosyltransferase; Ctrl, control (white bars); Cele, celecoxib (gray bars); HPHs, human primary hepatocytes (black bars).
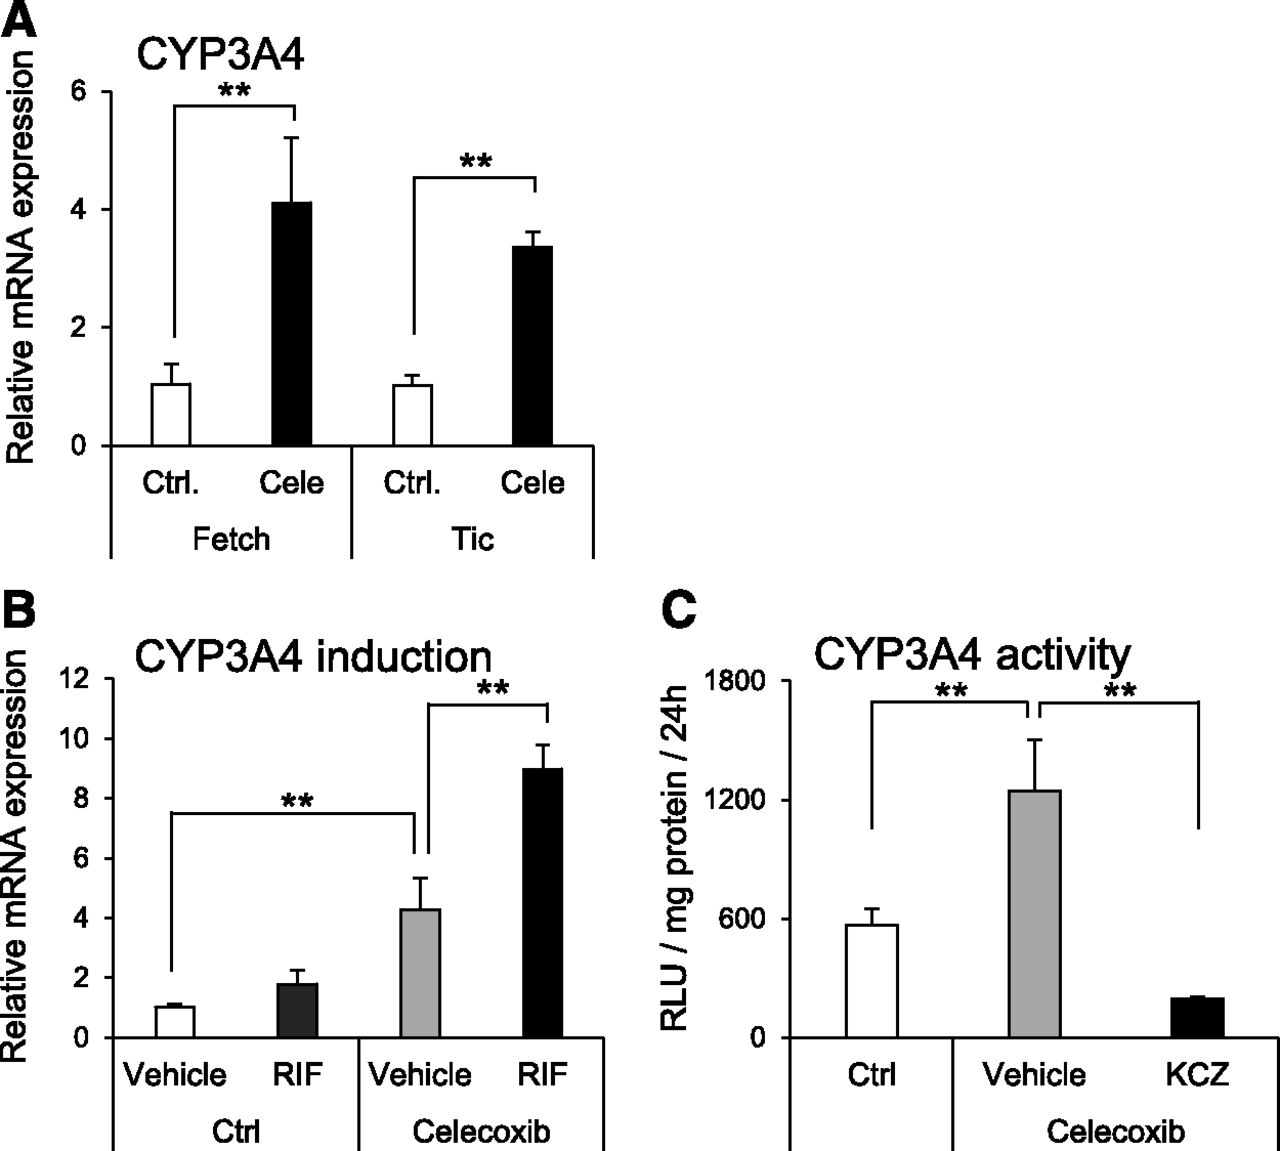
Activity and inducibility of CYP3A4 in hepatocytes differentiated from human iPS cells using celecoxib. (A) CYP3A4 mRNA expression level was analyzed in hepatocytes differentiated from two human iPS cell lines (Fetch and Tic). Relative mRNA expression levels in each celecoxib-untreated hiHep [control (Ctrl)] were set to 1, and the values were normalized to HPRT levels. Results are presented as means ± S.D. (n = 3). Statistical analysis was performed using Student’s t test: **P < 0.01. (B) Induction of CYP3A4 mRNA expression in hiHep with rifampicin. Relative mRNA expression levels in each celecoxib-untreated hiHep [control (Ctrl)] were set to 1, and the values were normalized to HPRT levels. Results are presented as means ± S.D. (n = 3). Statistical analysis was performed using Tukey’s HSD test: **P < 0.01. RIF, rifampicin. (C) Metabolic activity of CYP3A4 in hiHep. Results are presented as mean ± S.D. (n = 4). Statistical analysis was performed using Tukey’s HSD test. **P < 0.01. KCZ, ketoconazole.
COX Inhibition and PPARγ Activation Do Not Affect Hepatocyte Differentiation.
Celecoxib exhibits various effects such as the inhibition of COX and activation of PPARγ. Thus, we investigated whether these effects were involved in hepatocyte differentiation. The mRNA expression levels of CYP3A4 and TAT were not influenced by COX-1/2 inhibitors and COX-2-specific inhibitors that were distinct from celecoxib (Fig. 4).

Effect of other COX inhibitors on hepatocyte differentiation. RT-qPCR analysis of CYP3A4 and TAT mRNA expression levels in hiHep. Relative gene expression levels in [control (Ctrl)] were set to 1, and the values were normalized to HPRT levels. Results are presented as means ± S.D. (n = 3). Statistical analysis was performed using Tukey’s HSD test. **P < 0.01 vs. Ctrl. Asa, acetylsalicylic acid; Cele, celecoxib; COX, cyclooxygenase; CYP3A4, cytochrome P450 3A4; Keto, ketoprofen; Melo, meloxicam; Nime, nimesulide; TAT, tyrosine aminotransferase.
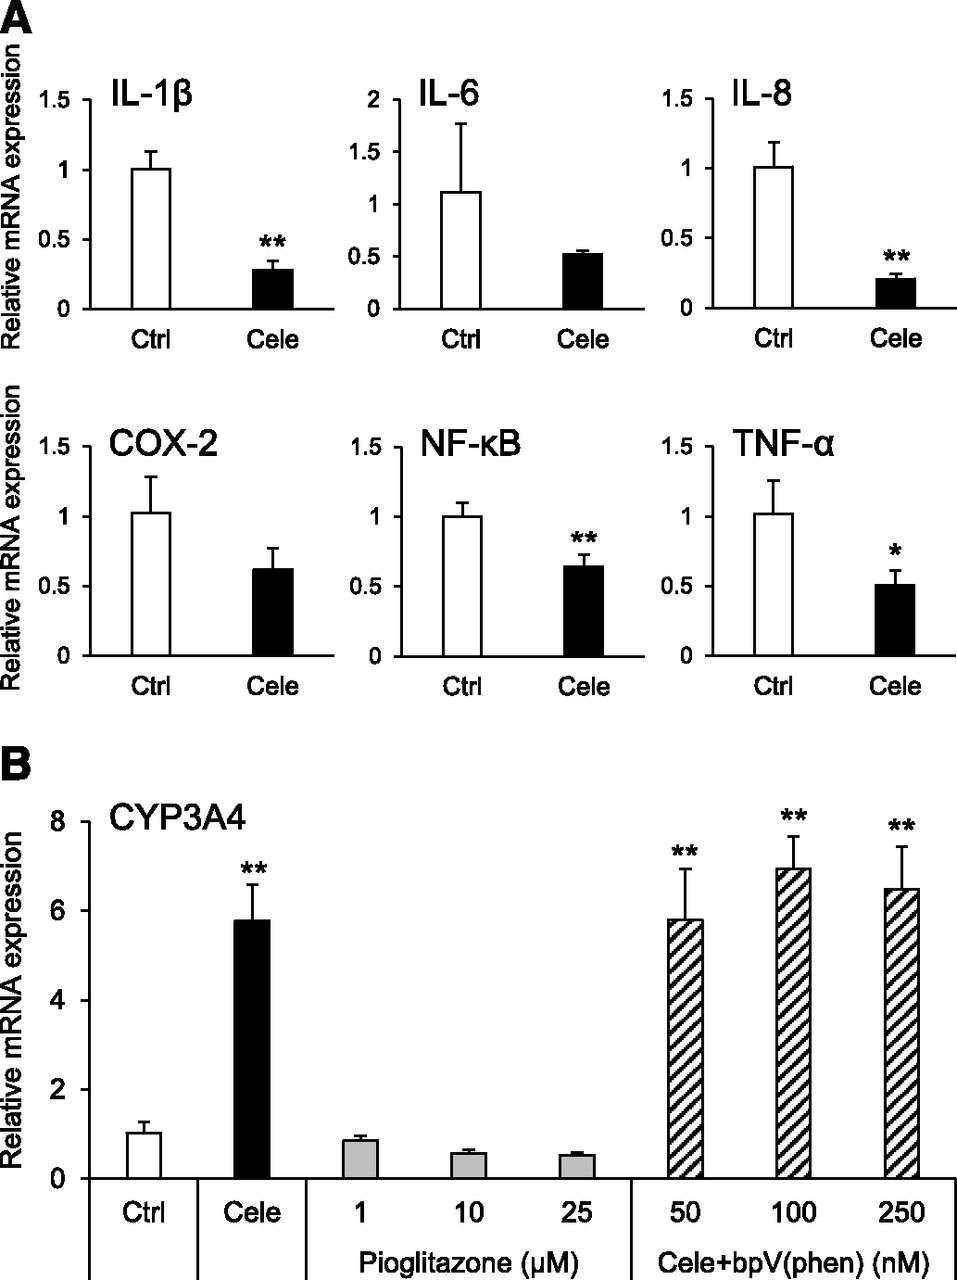
To confirm whether PPARγ was activated by celecoxib, we investigated the gene expression of PPARγ downstream signaling. It is known that PPARγ signaling inhibits inflammatory cytokine production via suppression of nuclear factor-kappa B (NF-κB). The mRNA expression level of NF-κB was decreased by celecoxib. Furthermore, the mRNA expression levels of interleukin (IL)-1β, IL-6, and tumor necrosis factor-α were reduced (Fig. 5A). However, the CYP3A4 mRNA expression level was not elevated by pioglitazone alone as an agonist of PPARγ. In addition, the increase in CYP3A4 mRNA expression was not suppressed by coincubation with bpV(phen), a phosphatase and tensin homolog (PTEN) inhibitor (Fig. 5B).

Influence of celecoxib on inflammatory cytokines and effect of PPARγ activation on hepatocyte differentiation. (A) RT-qPCR analysis of inflammatory marker mRNA expression in hiHep. Relative mRNA levels in celecoxib-untreated hiHep [control (Ctrl)] were set to 1, and the values were normalized to HPRT levels. Results are presented as mean ± S.D. (n = 3). Statistical analysis was performed using Student’s t test. *P < 0.05; **P < 0.01 vs. corresponding Ctrl. COX, cyclooxygenase; IL, interleukin; NF-κB, nuclear factor-kappa B; TNF-α, tumor necrosis factor-alpha. (B) RT-qPCR analysis of CYP3A4 mRNA levels in hiHep. Relative mRNA expression levels in celecoxib-untreated hiHep [control (Ctrl)] were set to 1, and the values were normalized to HPRT levels. Results are presented as mean ± S.D. (n = 3). Statistical analysis was performed using Tukey’s HSD test. **P < 0.01 vs. Ctrl. Cele, celecoxib; bpV(phen), potassium bisperoxo(1,10-phenanthroline)oxovanadate (V) trihydrate.
STAT5 Activation by Celecoxib Improves the Function of hiHep.
It is known that STAT3 and STAT5 are activated by phosphorylation. Therefore, we examined the amounts of each protein and its phosphorylated form to investigate the effect of celecoxib on STAT3 and STAT5. For STAT3, the amount of protein and its normalized phosphorylation did not change following celecoxib treatment. However, both the protein level of STAT5 and its normalized phosphorylation significantly increased with celecoxib treatment (Fig. 6, A and B). In addition, the increase in ASGR1 and CYP3A4 mRNA levels were suppressed by coincubation with pimozide, a STAT5 inhibitor (Fig. 6C) (Nelson et al., 2011). However, the mRNA expression level of CYP3A4 was not increased by growth hormone treatment, which is a representative STAT5 agonist (Fig. 6D).
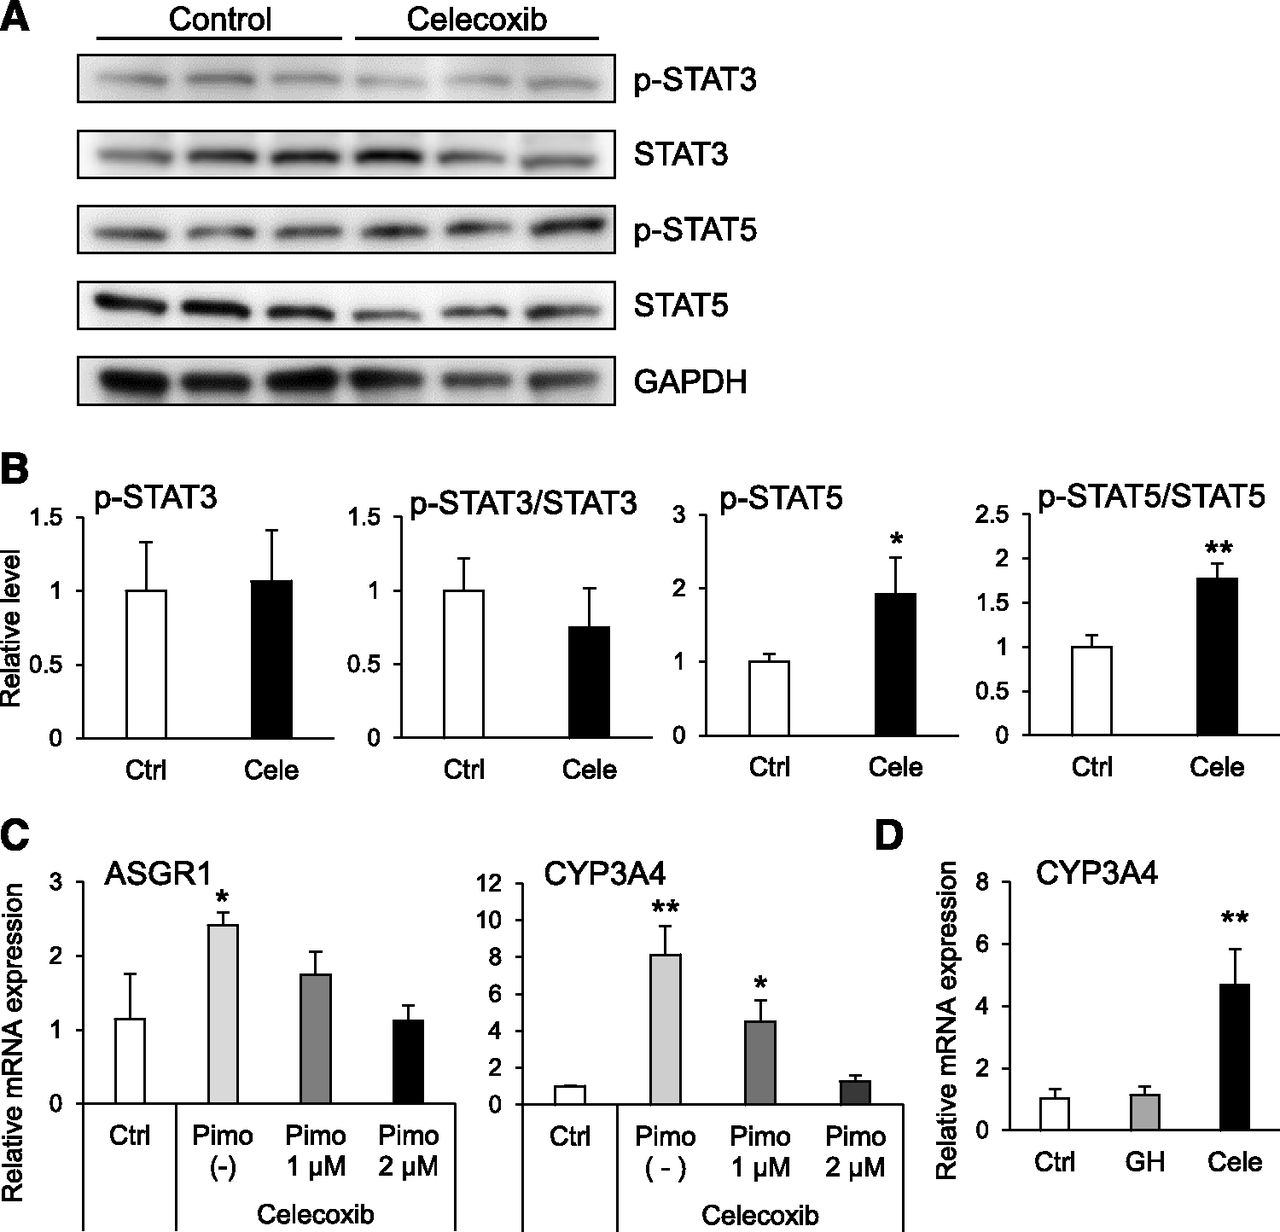
Effect of STAT5 activation on hepatocyte differentiation. (A and B) Western blot analysis of STAT3 and STAT5. Representative blots are shown in (A). Quantified results are presented as means ± S.D. (n = 3) in (B). Statistical analysis was performed using Student’s t test. *P < 0.05; **P < 0.01 vs. Ctrl. Ctrl, control; Cele, celecoxib. (C) RT-qPCR analysis of ASGR1 and CYP3A4 mRNA in hiHep co-incubated with celecoxib and pimozide (Pimo). Relative gene expression levels in [control (Ctrl)] were set to 1, and the values were normalized to HPRT levels. Results are presented as means ± S.D. (n = 3). Statistical analysis was performed using Tukey’s HSD test. *P < 0.05; **P < 0.01 vs. Ctrl. (D) RT-qPCR analysis of CYP3A4 mRNA in hiHep. Relative gene expression levels in celecoxib-untreated hiHep [control (Ctrl)] were set to 1, and the values were normalized to HPRT levels. Results are presented as means ± S.D. (n = 3). Statistical analysis was performed using Tukey’s HSD test. **P < 0.01 vs. Ctrl. Cele, celecoxib; GH, growth hormone.
Discussion
In this study, we used celecoxib to differentiate hepatocytes from iPS cells. Among the drug-metabolizing enzymes, CYP3A4 is most involved in the metabolism of pharmaceutical agents. Therefore, CYP3A4 is involved in many drug effects and interactions, such as the development of toxicity and reduction in medicinal effects (Evers et al., 2013). The differentiated hepatocytes significantly increased mRNA expression of hepatocyte maturation markers such as ASGR1, TAT, PXR, and CYP3A4 after celecoxib treatment (Fig. 2). These results indicate that celecoxib promoted hepatocyte differentiation from human iPS cells. In addition, the mRNA expression level of CYP3A4 was significantly increased by rifampicin. This result suggests that hiHep acquired the ability to upregulate CYP3A4 levels in the celecoxib treatment group (Fig. 3B). It is well known that induction of CYP3A4 by rifampicin occurs via PXR (Sinz et al., 2008). Therefore, it is possible that the acquisition of CYP3A4-inducing ability by celecoxib treatment was caused by increased expression of PXR. Furthermore, CYP3A4 activity was significantly increased by celecoxib, and this activity was suppressed by ketoconazole (Fig. 3C). These observations suggest that celecoxib-differentiated hepatocytes may be useful for detecting the development of toxicity and reduction in medicinal effects caused by CYP3A4-derived metabolites.
Celecoxib is one of the NSAIDs that acts by inhibiting COX and is widely used as an analgesic. NSAIDs exhibit not only COX inhibition but also various COX-independent effects such as on transcription factors and inhibition of Wnt/β-catenin signaling. Therefore, we investigated the effect of other NSAIDs on the iPS-hepatocyte differentiation. No increase in the mRNA expression levels of CYP3A4 and TAT was observed by the addition of acetylsalicylic acid, ketoprofen, meloxicam, or nimesulide, which are all NSAIDs (Fig. 4). These findings imply that increased mRNA expression levels of CYP3A4 and TAT by celecoxib were not due to COX inhibition or the COX-independent activity found in other NSAIDs.
Celecoxib activates PPARγ and inhibits Akt signaling via activation of PTEN (Chu et al., 2014). The mRNA expression levels of IL-1β, IL-8, tumor necrosis factor-α, and NF-κB, which are target genes of Akt signaling, were decreased by celecoxib (Fig. 5A). These results suggest that celecoxib activates PPARγ during hepatocyte differentiation from iPS cells. However, CYP3A4 mRNA expression did not increase with pioglitazone, which is an agonist of PPARγ. Moreover, the increase in CYP3A4 gene expression level was not attenuated by coincubation with bpV(phen), a PTEN inhibitor (Fig. 5B). These findings imply that celecoxib activates PPARγ; however, this activation is not involved in the upregulation of CYP3A4 mRNA expression.
It has been reported that celecoxib suppresses STAT3 and activates STAT5. The STAT3 protein levels and its phosphorylation were not affected by celecoxib, suggesting it did not suppress STAT3 activity n hiHep. A previous study has shown that high concentrations of celecoxib (over 50 µM) competitively inhibited the peptide binding necessary for the phosphorylation of STAT3 by binding to its SH2 domain (Reed et al., 2011). In the present study, we believe that STAT3 was not suppressed by celecoxib because the latter was used at a lower concentration (25 μM). With STAT5, both the protein levels and its phosphorylation were significantly increased by celecoxib. Therefore, it is likely that STAT5 was activated by celecoxib during hepatocyte differentiation from human iPS cells (Fig. 6, A and B). Furthermore, coincubation with pimozide, which is an inhibitor of STAT5, suppressed the upregulation of CYP3A4 and ASGR1 mRNA by celecoxib in a concentration-dependent manner (Fig. 6C). From the above, we concluded that the enhancement of hepatocyte function by celecoxib was caused by the activation of STAT5. However, the mRNA expression level of CYP3A4 did not increase with growth hormone treatment, which is known to activate STAT5 at physiologic concentrations (Fig. 6D) (Baik et al., 2011; Martinez et al., 2013). The growth hormone is known to be secreted in pulses from the pituitary gland (Jaffe et al., 1993; Robinson, 2000). Moreover, it has been reported that activation of STAT5 by growth hormone is due to concentration fluctuations and this activation does not persist (Gebert et al., 1997). In the present study, we added growth hormone at the same concentration for 8 days from day 16 during hepatocyte differentiation. Therefore, STAT5 activation by growth hormone concentration fluctuation did not occur, and insufficient STAT5 activation by growth hormone is the most likely explanation for the lack of increased CYP3A4 mRNA expression. These findings suggest that sustained activation of STAT5 is important for hepatocyte maturation.
A previous study showed that HNF4α plays a central role in hepatocyte differentiation (Parviz et al., 2003). In addition, it has been reported that more functional hepatocytes can be produced from human iPS cells by overexpression of HNF4α and HNF6 (Takayama et al., 2012a; Sasaki et al., 2013). Furthermore, growth hormone was shown to stimulate the transcription of the HNF4α and HNF6 genes via a mechanism involving STAT5 (Lahuna et al., 2000). From these reports, it is possible that the regulation of other transcription factors by celecoxib, such as HNF4α and HNF6, which are associated with the activation of STAT5, are involved in the differentiation of iPS cells to hiHep (Fig. 7). However, STAT5 is implicated in a wide variety of signaling events. Therefore, more detailed investigations would be necessary in the future to determine the downstream signaling of STAT5 that is involved in hepatocyte differentiation.
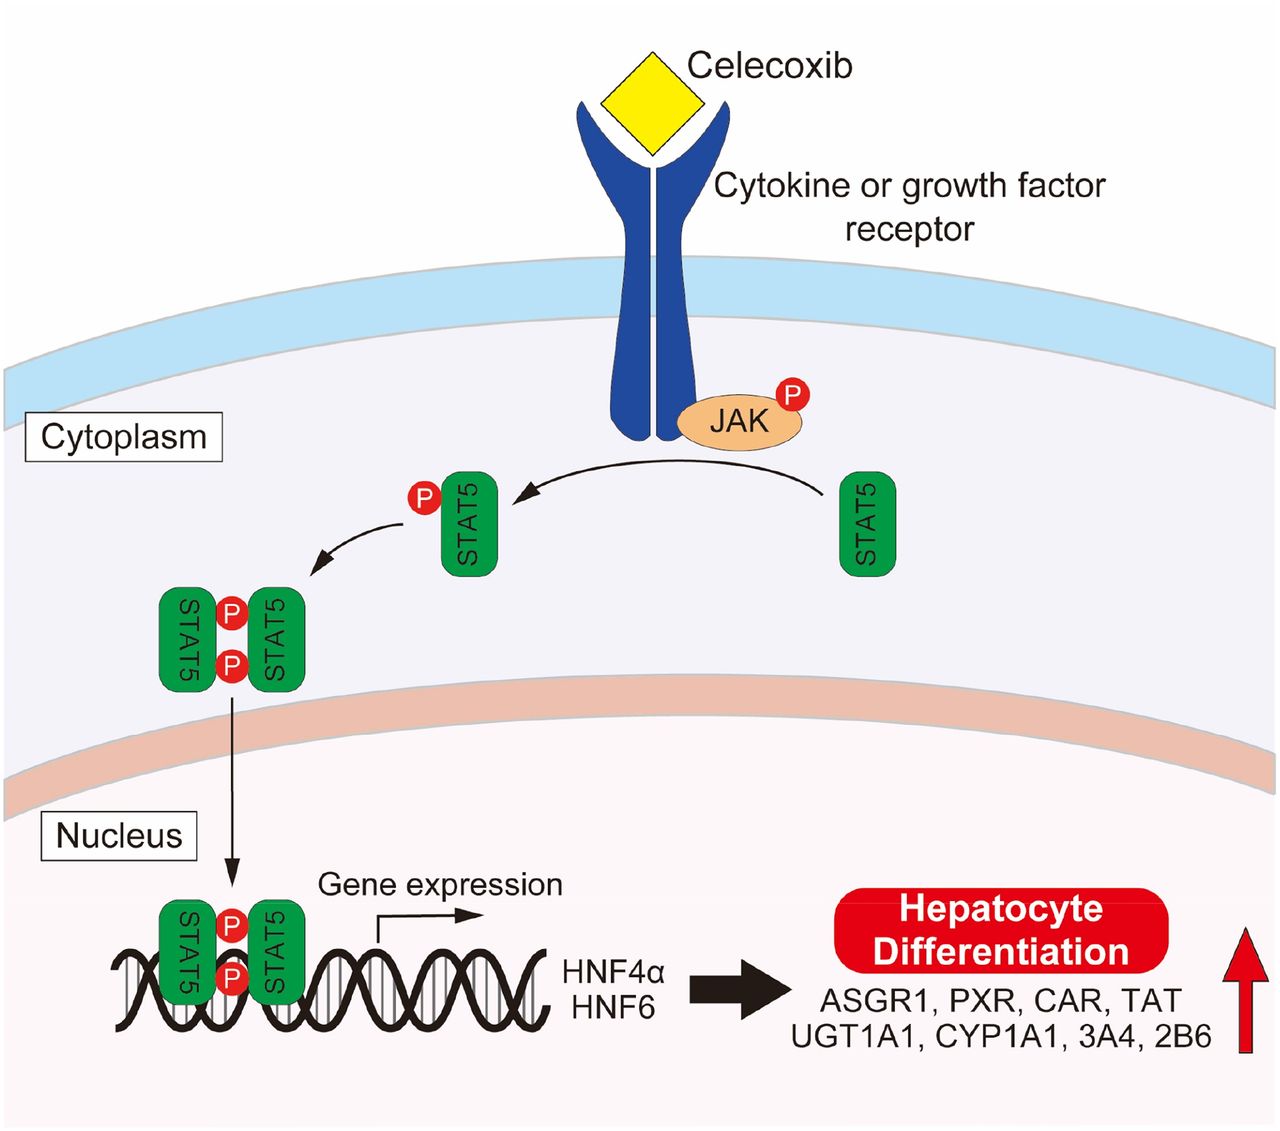
Presumed mechanism of hepatocyte differentiation by celecoxib.
In this study, we succeeded in inducing more functional hepatocytes from iPS cells using a very simple method with small-molecule compounds. However, CYP3A4 expression in these cells was still lower than that in HPHs. Therefore, further investigation is required to optimize the induction of more functional hepatocytes. In addition, in this study, it was not possible to identify the direct mechanism of STAT5 activation by celecoxib and clarify the differences in STAT5 activation between celecoxib and growth hormone. In the future, more detailed investigations would be necessary to elucidate the mechanism of STAT5 activation and these mechanistic differences.
This study demonstrated that celecoxib promoted hepatocyte differentiation from human iPS cells by activation of STAT5. The CYP gene expression levels in hiHep differentiated by celecoxib were comparable to those of HPHs cultured for 48 hours. Celecoxib is a small-molecule compound that is inexpensive and contains no heterologous components. Therefore, we concluded that celecoxib could be useful as a differentiation factor for the mass production of hiHep in drug development studies and regenerative medicine.
Acknowledgments
We thank Dr. Akihiro Umezawa for providing human iPS cells.
Authorship Contributions
Participated in research design: Okumura, Hashita, Iwao, Matsunaga.
Conducted experiments: Okumura, Nakanishi.
Performed data analysis: Okumura, Nakanishi.
Wrote or contributed to the writing of the manuscript: Okumura, Hashita, Iwao, Matsunaga.
Footnotes
- Received June 11, 2018.
- Accepted August 23, 2018.
This work was supported by the Japan Society for the Promotion of Science [Grant 23390036] and the Agency for Medical Research and Development (AMED) [Grants 17be0304203h0001, 17bk0104075h0201].
The authors have declared no conflicts of interest.
Abbreviations
- AFP
- α-fetoprotein
- ALB
- albumin
- ASGR1
- asialoglycoprotein receptor 1
- bpV(phen)
- potassium bisperoxo(1,10-phenanthroline)oxovanadate (V) trihydrate
- CAR
- constitutive androstane receptor
- Cosmedium
- Cosmedium 004 for hepatocyte
- COX
- cyclooxygenase
- CYP
- cytochrome P450
- DMEM/F12
- 1:1 mixture of Dulbecco’s modified Eagle’s medium and Ham’s nutrient mixture F-12
- GAPDH
- glyceraldehyde-3-phosphate dehydrogenase
- hiHep
- human induced pluripotent stem cell-derived hepatocytes
- HNF
- hepatocyte nuclear factor
- HPHs
- human primary hepatocytes
- IL
- interleukin
- iPS cells
- induced pluripotent stem cells
- NF-κB
- nuclear factor-kappa B
- NSAIDs
- non-steroidal anti-inflammatory drugs
- PBS
- phosphate-buffered saline
- PPARγ
- peroxisome proliferator activated receptor γ
- p-STAT
- phospho-signal transducer and activator of transcription
- PXR
- pregnane X receptor
- qPCR
- quantitative polymerase chain reaction
- STAT
- signal transducer and activator of transcription
- TAT
- tyrosine aminotransferase
- Copyright © 2018 by The American Society for Pharmacology and Experimental Therapeutics


