


Abstract
Mass balance and biotransformation of finerenone, a nonsteroidal mineralocorticoid receptor antagonist, were investigated in four healthy male volunteers following a single oral administration of 10 mg (78 μCi) of [14C]finerenone and compared with data from studies in dogs and rats. The total recovery of the administered radioactivity was 101% in humans, 94.7% in dogs, and 95.2% in rats. In humans, radioactivity was mainly excreted renally (80%); in rats, it was primarily the biliary/fecal route (76%); and in dogs, excretion was more balanced. Finerenone was extensively metabolized in all species by oxidative biotransformation, with minor amounts of unchanged drug in excreta (humans: 1%; dogs, rats: <9%). In vitro studies suggested cytochrome P450 3A4 was the predominant enzyme involved in finerenone metabolism in humans. Primary metabolic transformation involved aromatization of the dihydronaphthyridine moiety of metabolite M1 as a major clearance pathway with a second oxidative pathway leading to M4. These were both prone to further oxidative biotransformation reactions. Naphthyridine metabolites (M1–M3) were the dominant metabolites identified in human plasma, with no on-target pharmacological activity. In dog plasma, finerenone and metabolite M2 constituted the major components; finerenone accounted almost exclusively for drug-related material in rat plasma. For metabolites M1–M3, axial chirality was observed, represented by two atropisomers (e.g., M1a and M1b). Analysis of plasma and excreta showed one atropisomer (a-series, >79%) of each metabolite predominated in all three species. In summary, the present study demonstrates that finerenone is cleared by oxidative biotransformation, mainly via naphthyridine derivatives.
Introduction
Blockade of the mineralocorticoid receptor has proven efficacious in patients with heart failure and arterial hypertension (Bauersachs et al., 2015; Schwenk et al., 2015). However, the available steroidal mineralocorticoid receptor antagonists (MRAs), spironolactone and eplerenone, are underutilized, mainly owing to the risk of inducing severe adverse events, such as hyperkalemia and worsening of kidney function; indeed, patients with chronic kidney disease taking inhibitors of the renin-angiotensin system, such as angiotensin-converting enzyme inhibitors or angiotensin receptor blockers, are at particular risk. Accordingly, drug-discovery studies were initiated with the goal of identifying novel nonsteroidal MRAs that probably would not induce hyperkalemia (Kolkhof and Bärfacker, 2017). Finerenone (also known as BAY 94-8862) is a novel MRA with high potency (half-maximal inhibitory concentration [IC50] of 18 nM), having greater selectivity versus all other steroidal hormone receptors (IC50 > 10 μM) with different physicochemical, pharmacokinetic, and pharmacological properties (Kolkhof et al., 2015, 2017). Data from phase II trials with finerenone in more than 2000 patients with heart failure and comorbid chronic kidney disease and/or diabetes mellitus, as well as in patients with diabetic kidney disease, demonstrated that neither hyperkalemia nor reduced kidney function were factors that should limit its use (Pitt et al., 2012; Bakris et al., 2015; Filippatos et al., 2016).
The clinical pharmacology of finerenone was initially studied in healthy volunteers, who received an oral solution containing polyethylene glycol (PEG) 400, polysorbate, and menthol (Lentini et al., 2016). Interestingly, this PEG-containing solution exhibited a significantly lower oral bioavailability compared with the immediate-release (IR) tablet subsequently developed for clinical studies. The ratios of area under concentration-time curve (AUC) and maximum concentration (Cmax) for finerenone in tablet form compared with the PEG solution in the fasting state were both 187%. PEG may reduce small-intestinal transit time, which may be the underlying mechanism; the basis of this hypothesis are similar findings with ranitidine formulated as a solution in PEG 400 (Basit et al., 2001): diminished absorption from the gastrointestinal tract. Therefore, the available PEG solution of finerenone was not adequate for the human mass balance study described here, which led to the development of a new PEG-free aqueous oral formulation. The relative bioavailability of this new liquid formulation with reference to the clinical formulation, a film-coated IR tablet, was characterized prior to its use in the mass balance study.
The aim of this study was to provide an overview of the biotransformation of finerenone and its excretion pathways in vivo in preclinical (dogs and rats), and clinical research. We also performed complementary in vitro investigations of the human enzymes involved in the biotransformation of finerenone and in depth preclinical characterization of several metabolites.
Materials and Methods
Reagents and Reference Compounds
Radiolabeled [14C]finerenone [(4S)-4-[4-[14C]cyano-2-methoxyphenyl]-5-ethoxy-2,8-dimethyl-1,4-dihydro-1,6-naphthyridine-3-carboxamide] with a radiochemical purity of 99.6% and a specific radioactivity of 0.31 MBq/mg; nonlabeled finerenone; metabolites M1, M2, M3; and pure atropisomers M1a, M1b, M2a, M2b, M3a, and M3b were synthesized in-house at Bayer AG (Wuppertal, Germany). The structures of finerenone and metabolites were confirmed by high-resolution tandem mass spectrometry (HRMS/MS) as described in the Supplemental Material and nuclear-magnetic resonance spectroscopy (data not shown). Primary male and female fresh human hepatocytes were obtained from Hepacult (batch number 22285-8426 and 22582-7831; Unterföhring, Germany). Microsomes and hepatocytes from rat and dog were prepared in-house at Bayer AG according to standard procedures (Kern et al., 1997; Nelson et al., 2001). Human recombinant cytochrome isoforms were obtained from Corning (Woburn, MA) and human liver microsomes from Cytonet (Weinheim, Germany) or XenoTech (Kansas City, KS).
Human Mass Balance: Study Conduct and Sample Collection
A single-center, open-label, nonrandomized study in healthy male volunteers was performed to study pharmacokinetics, mass balance, excretion patterns, and safety and tolerability after single oral administration of 10 mg of finerenone blended with [14C]finerenone. The study was conducted at Covance Clinical Research Unit Basel (Allschwil, Switzerland) in accordance with Good Clinical Practice as defined by the International Council for Harmonization and the Declaration of Helsinki and approved by an accredited institutional ethics committee. The radioactive dose was calculated to comply with the International Commission on Radiologic Protection category 2A guideline (https://ec.europa.eu/energy/sites/ener/files/documents/099_en.pdf); this meant human radioactive exposure in the study could not exceed 1 millisievert (mSv). The mass balance study in humans was conducted in two stages: part A and part B. In part A, the relative bioavailability of the new PEG-free aqueous oral formulation of finerenone was investigated. Owing to the effects of PEG in the formulation of finerenone used in early human pharmacokinetic studies of its oral absorption (Lentini et al., 2016), a citrate-based aqueous solution of finerenone was developed and pharmacokinetic properties characterized for part A in eight healthy male volunteers compared with the 10-mg IR tablet used in clinical trials of finerenone. In an open-label, randomized 2-fold crossover study, a dose of 10 mg of finerenone (5 ml of 2 mg/ml solution or a single 10-mg tablet) was administered after overnight fasting (from 22:00 on the day prior to day of administration, until 4 hours postdose) with 240 ml of water. In part B, four healthy volunteers received finerenone blended with 14C-labeled compound. After an assessment of its bioavailability had indicated its suitability, the novel aqueous liquid formulation used in part A was also used to study the mass balance in part B. The nominal dose in part B was 10 mg of finerenone. Individual doses (9.27–9.36 mg, 2.87–2.90 MBq, ∼78 μCi) were determined by subtracting the measured radioactivity remaining in the application device after administration. Volunteers stayed in-house for 10 days, as safety parameters were monitored that included blood pressure and heart rate (predose and 4, 12, 24, 72, 168, and 240 hours after administration), ECG (predose and 24 and 240 hours after administration), clinical chemistry and hematology (predose and 24, 72, 120, 168, and 240 hours after administration), and adverse events (administration to discharge). Also, as part of this monitoring, physical examinations were taken.
For determination of finerenone pharmacokinetics in the relative bioavailability study (part A), plasma samples were obtained predose and 0.25, 0.5, 0.75, 1, 1.5, 2, 2.5, 3, 4, 6, 8, 12, 15, and 24 hours postdose with at least a 72-hour washout period. Safety and adverse events were adequately monitored and included standard cardiovascular and physical examinations.
For analysis of part B, blood samples were collected at predose, and 0.25, 0.5, 0.75, 1, 1.5, 2, 2.5, 3, 4, 6, 8, 12, 15, 24, 48, 72, 96, 120, 144, 168, 192, 216, and 240 hours postdose. Urine and feces samples were collected in 12-hour intervals on day 1 and in 24-hour intervals up to day 10 postdosing, respectively.
Total radioactivity in plasma, blood, urine, and feces was determined at Harlan Laboratories Ltd. (Itingen, Switzerland) by liquid scintillation counting (LSC) employing Irgasafe Plus or Solvable scintillation cocktail (Perkin Elmer, Waltham, MA) on a liquid scintillation spectrometer Tri-Carb 2500 TR, 2550TR/LL, or 2900 TR (Canberra Packard Instrument Comp., Groningen, The Netherlands).
Animal Mass Balance Studies
Animal studies were conducted at Bayer AG in accordance with Directive 2010/63/EU of the European Parliament and of the Council of 22 September 2010 on the protection of animals used for scientific purposes and the German Animal Protection Act of July 4, 2013 (Deutsches Tierschutzgesetz). All animal procedures were approved by the local animal care and use committee and by governmental authorities.
Four female Beagle dogs (HSD BOR:BEAG) were obtained from Bomholt Benedikt (Castrop-Rauxel, Germany). The animals were aged between 2 and 3 years and the body weight ranged between 12.4 and 18.6 kg. Before study initiation, all animals were examined for clinical signs of disease. In addition, blood samples were collected to check blood parameters, plasma protein content, and liver and kidney function, to confirm each animal’s suitability for the study. The animals were housed in individual metabolism cages throughout the study period.
Male Wistar rats (HSD CPB:WU) were obtained from Harlan Nederland (Horst, The Netherlands). The age of the animals was approximately 8 weeks and the body weight approximately 220 g. As the metabolism of finerenone in vitro proceeds exclusively via an oxidative process, mass balance studies were conducted in male Wistar rats, since female rats generally demonstrate reduced metabolic turnover of cytochrome P450 substrates compared with male rats (Mugford and Kedderis, 1998). The animals were housed in individual metabolism cages during the whole study period. The rats were fed with daily 15–17 g of pelleted standard feed before noon.
In female Beagle dogs and male Wistar rats, the pharmacokinetics and mass balance were studied after oral administration of [14C]finerenone (3.09 MBq/mg in rat studies; 1.545 MBq/mg in the dog study) dissolved in a mixture of 10% ethanol, 40% PEG 400, 50% demineralized water (dogs: 3 mg/kg, 1 ml/kg; rats: 1 mg/kg, 5 ml/kg). For both dogs and rats, any remaining food was withdrawn approximately 16 hours before administration of [14C]finerenone. On the day of administration, the food was given approximately 4 hours after administration of the test substance. Pooled plasma samples were obtained up to day 14 (dogs, n = 4) or day 7 (rats, n = 3 per time point) postdose. Furthermore, urine (0–8, 8–24 hours, after that, daily) and feces samples were collected daily up to day 14 (dogs, n = 4) or day 7 (rats, n = 5). Metabolite profiling in excreta was performed up to day 5 postdose (dogs, constituting >92% of administered dose excreted) or up to 48 hours postdose (rats, constituting >90% of administered dose excreted) owing to low amounts of excreted radioactivity at later time points. Metabolite profiling in plasma was performed up to day 11 (dogs) or day 3 postdose (rats). Owing to detection limits for the analysis of the atropisomer ratio at the 1 mg/kg dose in rats, the mass balance of [14C]finerenone was additionally investigated at a dose level of 10 mg/kg to investigate the atropisomer ratio in urine and feces up to 72 hours postdose (n = 3).
After workup, total radioactivity in plasma, feces, and urine was determined by LSC, employing Ultima Gold, high-flashpoint scintillation cocktail (Packard Instrument BV, Groningen, The Netherlands) on a liquid scintillation spectrometer Tri-Carb 2500 A (Canberra Packard Instrument Comp.).
Preparation of Samples for Radioactive Metabolite Profiling by High-Performance Liquid Chromatography–Liquid Scintillation Counting
Metabolite patterns were obtained by high-performance liquid chromatography (HPLC) followed by off-line radiodetection by means of LSC. In general, extracts or urine samples were analyzed by HPLC-LSC employing an Agilent HP 1100 liquid chromatograph (Agilent Technologies, Waldbronn, Germany) using a Synergi Hydro RP column (Phenomenex, Aschaffenburg, Germany) and potassium dihydrogenphosphate buffer/acetonitrile (humans and dogs) or 0.1% trifluoroacetic acid/acetonitrile (rats) gradient. The effluent was collected in intervals of 10 seconds followed by off-line radioactivity detection by means of Ultima Flo, AP high-flashpoint scintillation cocktail (Packard Instrument BV), and the Wallac 1450 Microbeta2 Plus liquid scintillation counter (Wallac, Turku, Finland) as a detector. Determination of radioactivity concentration of each component in the respective species and matrices was performed by multiplying the total radioactivity present in plasma, urine, or feces. The percentage peak area was obtained after HPLC separation, fractionation, and off-line radioactivity detection by LSC.
Humans.
Aliquots from individual plasma samples of each time point (1000 μl) were treated with 0.1% formic acid (100 μl) and acetonitrile (4 ml). The precipitated proteins were removed by centrifugation (∼16,000 g for 10 minutes). The supernatants were separated and evaporated to a volume of ∼500–700 μl. From the concentrated extract, 100 μl each were subjected to HPLC with off-line radioactivity detection. The extraction recoveries of radiolabeled finerenone-associated analytes from human plasma samples obtained over the first 12 hours postdosing (>95% of total AUC for finerenone in plasma) were between 84.3% and 113.0%. Aliquots of individual urine samples were analyzed without sample preparation and directly subjected to HPLC with off-line radioactivity detection. Homogenized feces samples were separately extracted twice with acetonitrile/formic acid (99:1 [v/v], 3 and 1 ml). The suspensions obtained were centrifuged (∼1000 g for 5 minutes) and the supernatants combined. Each sample was concentrated and subjected directly to HPLC with off-line radioactivity detection. Extraction recoveries of radiolabeled finerenone-associated analytes after workup of individual samples were 83.6%–110.0%.
Dogs and Rats.
Aliquots of pooled plasma samples (300 μl) were treated twice (1.0 ml, 0.5 ml) with ice-cold acetonitrile containing 2% trifluoroacetic acid. The supernatants were combined and homogenized and the proteins precipitated by centrifugation (∼1000 g for 5 minutes). The extract of each time point was concentrated to approximately 50 μl and diluted with potassium dihydrogenphosphate buffer (pH 2, 50 μl) for analysis of dog plasma or with 0.1% trifluoroacetic acid (50 μl) for the analysis of rat plasma. Samples were subjected to HPLC with off-line radioactivity detection. Extraction recoveries of radiolabeled finerenone-associated analytes from dog and rat plasma samples ranged from 83.0% to129.0% and 78.8% to120.0%, respectively. Aliquots of individual dog urine samples (50 μl) were analyzed after dilution with potassium dihydrogen phosphate buffer (pH 2, 50 μl) and directly subjected to HPLC with off-line radioactivity detection. Aliquots of individual rat urine samples were analyzed without sample preparation. Approximately 0.4–1.0 g of homogenized wet dog or rat feces samples were used for investigations. The samples were extracted twice (1.5 and 1.0 ml) by treatment of 10 minutes in an ultrasonic bath with a mixture of acetonitrile containing 2% trifluoroacetic acid. The suspensions obtained were centrifuged (∼1000 g for 5 minutes), and the supernatants were concentrated and combined before being subjected to HPLC with off-line radioactivity detection. Extraction recoveries of radiolabeled finerenone-associated analytes after workup of individual dog and rat feces samples ranged from 88.7%–102.0% and 87.3%–106.0%, respectively.
Quantification of Finerenone in Human Plasma
All samples were stored below −15°C and analyzed within 60 days of collection. Stability of finerenone and metabolites had been established under these storage conditions. Liquid chromatography with tandem mass spectrometry detection (LC-MS/MS) was employed for determination of finerenone in plasma. A quadrupole API 4000 mass spectrometer (Applied Biosystems/MDS Sciex, Ontario, Canada) equipped with an electrospray ionization interface (TurboIonSpray interface) used to generate [M+H]+ ions, an Agilent HP 1200 liquid chromatograph (Agilent Technologies) equipped with a C18-phase column, Mercury Luna 3-μm, 20 × 2.0-mm (Phenomenex Ltd.), and an HTC PAL autosampler (CTC, Zwingen, Switzerland) were used. The method had been fully validated according to current scientific and regulatory recommendations (https://www.fda.gov/downloads/Drugs/Guidance/ucm070107.pdf; http://www.ema.europa.eu/docs/en_GB/document_library/Scientific_guideline/2011/08/WC500109686.pdf). The calibration range of the method for finerenone was 0.100 to 200 μg/l. Accuracy and precision at the lowest calibrator (lower limit of quantification) were equal to 98.7% and 11.8%, respectively. Quality-control samples in the concentration range from 0.300 to 160 μg/l were determined with an accuracy of 95.7%–103.0% and a precision of 3.1%–7.2%.
Quantification of Atropisomers
Human plasma samples up to 48 hours postdose obtained from all time points were pooled per volunteer to provide an average AUC from 0 to 48 hours postdose (Hop et al., 1998). The interval 0–48 hours covered 88%–99% of the AUC of M1, M2, and M3 and was therefore representative for each metabolite analyzed. The LC-MS/MS system for quantification of atropisomers of M1a, M1b, M2a, M2b, M3a, and M3b consisted of an QTRAP 6500 (Applied Biosystems/MDS Sciex, Ontario, Canada) equipped with an electrospray ionization interface (TurboIonSpray interface) used to generate [M+H]+ ions, an Agilent HP 1290 liquid chromatograph (Agilent Technologies), and an HTC PAL autosampler (CTC) using a (S,S) Whelk-01, 5-μm, 150 × 2.1-mm column (Regis Technologies, Grove, IL). The calibration range of the method for the metabolites was 0.100 to 500 μg/l. Quality-control samples in the concentration range from 0.300 to 400 μg/l were determined with an accuracy of 81.4%–116.3% and a precision of 0.4%–9.4%.
Plasma samples from dogs and rats up to 48 hours postdose from all time points were pooled to provide average AUC(0–48) as described for human plasma. The AUC(0–48) of the pooled sample from dogs for each of M1, M2, and M3 represented 86%–99% of total AUC of the metabolites. Concentrations of atropisomers M1a, M1b, M2a, M2b, M3a, and M3b were determined by liquid chromatography with high-resolution mass spectrometry (LC-HRMS) analytics; the identical LC system and column as for human plasma was employed and data were analyzed on a Q Exactive (Thermo Fisher Scientific, Bremen, Germany).
Pooled human feces samples from each volunteer up to 96 hours postdose (constituting 86.2%–99.5% of the excreted radioactivity via feces), pooled dog feces up to 72 hours postdose (constituting 94.7% of the excreted radioactivity via feces), and pooled rat feces up to 72 hours postdose (10 mg/kg) were analyzed after a work-up analogous to that for human plasma samples. The identical LC-MS/MS system was used. Pooled human urine samples from each volunteer up to 48 hours postdose (representing 95.2%–99.0% of the excreted radioactivity via urine) were analyzed by LC-HRMS analytics analogously to dog plasma. Pooled urine samples from dogs up to 72 hours postdose (constituting 94.0% of the excreted radioactivity via urine) and from rats up to 72 hours postdose (10 mg/kg) were analyzed after isolation of the respective metabolites M1, M2, and M3 via preparative HPLC. Analysis of the atropisomers M1a, M1b, M2a, M2b, M3a, and M3b was performed by HPLC-LSC employing an Agilent HP 1100 liquid chromatograph using a Chiralpak AS-H column, 5-μm, 250 × 4.6-mm (M1a, M1b; Daicel Chemical Industries, LTD, Chiral Technologies Europe, Illkirch, France) or Chiralpak AD-H column, 5-μm, 250 × 4.6-mm (M2a, M2b, M3a, M3b) with 10-second sampling time followed by off-line radiodetection (LSC analytics) with a Wallac 1450 Microbeta2 Plus liquid scintillation counter as a detector.
Structure Elucidation
Metabolites were investigated using HPLC-HRMS and the off-line radioactivity detection methods as described above. Confirmation of chemical identity of finerenone and its metabolites was generally performed employing reference compounds (finerenone and metabolites M1a, M1b, M2a, M2b, M3a, M3b), by comparison of HPLC retention times and by liquid chromatography with high-resolution tandem mass spectrometry (LC-HRMS/MS) fragmentation data (Supplemental Fig. S1). The circular dichroism spectra of metabolites M1b, M2b, and M3b were analyzed in methanol and recorded on JASCO J 715 (Easton, MD) (Supplemental Fig. S2). The crystal structure of metabolite M1b was determined using a diffractometer (Xcalibur series; Rigaku Oxford Diffraction, Abingdon, UK) equipped with a charge-coupled device area detector (model Ruby), a sealed tube with CuKα radiation, osmic mirrors as monochromator, and a Cryojet low-temperature device (T = 100 K). Full-sphere data collection was performed using omega and phi scans. Data collection and reduction were conducted by CrysAlis (2007; Rigaku Oxford Diffraction). Crystal structure solution was achieved using direct methods as implemented in SHELXTL, version 6.10 (Bruker Analytical X-ray Systems, Madison, WI) and visualized employing the XP program. Missing atoms were subsequently located from Bijvoet-difference Fourier synthesis and added to the atom list. Least-squares refinement on F2 using all measured intensities was carried out using the program SHELXTL, version 6.10. All nonhydrogen atoms were refined, including anisotropic displacement parameters (Supplemental Fig. S3).
Pharmacokinetic Analysis
Pharmacokinetic parameters for finerenone in plasma were calculated using LC-MS/MS data. Measurement by LSC served for blood/plasma ratio determination, total radioactivity in urine and feces, and analysis of HPLC fractions. The amount of radioactivity recovered in the excreta (AE) was related to the radioactive dose administered to calculate the mass balance (= recovery of radioactivity). Arithmetic means and coefficients of variation were calculated for these percentages. The concentration/amount for each analyte of each sample/time point was calculated by multiplying the total radioactivity concentration/amount of each sample with the percentage area of each analyte obtained after off-line HPLC separation.
Noncompartmental analysis of finerenone (LC-MS/MS data in parts A and B) and total radioactivity data (blood, plasma, urine, feces) was performed employing WinNonlin software (version 5.3; Pharsight Certara, Princeton, NJ) in the clinical study. Pharmacokinetic parameters for analytes obtained from radioactive metabolite profiling by means of HPLC-LSC were determined employing Toxkin software (Entimo, Berlin, Germany).
Statistical Evaluation
Pharmacokinetic parameters were evaluated by descriptive data analysis without formal hypothesis testing by calculating geometric means, coefficients of variation, arithmetic means (AE parameters), and medians [time to maximum concentration (tmax)].
In Vitro Studies
Biotransformation in Hepatocytes.
Primary fresh hepatocytes from rats, dogs, and humans were incubated with 1 μM [14C]finerenone in Williams’ E medium at 37°C in suspension cultures. Aliquots of the incubation mixture were removed at the beginning (0 hours) and after incubation times of 1, 2, and 4 hours.
Biotransformation in Microsomes.
Microsomes from rats, dogs, and humans (0.5 mg/ml microsomal protein) were incubated with 1 μM finerenone (rat, human) or 2 μM finerenone (dog) with NADPH at 37°C in 50 mM potassium phosphate at pH 7.4 with 1 mM EDTA and an NADPH-generating system (NADP, glucose 6-phosphate and glucose 6-phosphate dehydrogenase) for 1 hour.
Cytochrome P450 Phenotyping.
To identify the human cytochrome P450 (CYP) isoforms involved in the biotransformation of finerenone, incubations of [14C]finerenone (1 μM) in 50 mM phosphate buffer, pH 7.4, with an NADPH-regenerating system were conducted at 37°C employing recombinant CYP1A1, 1A2, 2A6, 2B6, 2C8, 2C9, 2C18, 2C19, 2D6, 2E1, 2J2, 3A5, 3A7, 4A11, 4F2, 4F3A, 4F3B, and 4F12 at a final concentration of 100 pmol/ml, and for CYP3A4 at 50 pmol/ml.
Clearance of M1 Atropisomers.
M1a or M1b (50 nM) was incubated with human liver microsomes (0.5 mg/ml) in a 50 mM phosphate buffer of pH 7.4 with an NADPH-regenerating system at 37°C.
Analysis of In Vitro Samples.
Incubations were stopped with acetonitrile reaching a final concentration of approximately 30% (v/v), and samples were analyzed immediately or stored at –20°C until they could be analyzed. After centrifugation at 15,000 g to precipitate proteins, the supernatants underwent HPLC analysis with radiodetection and/or MS/MS detection by LC-System 1200 (Agilent) and LTQ Orbitrap XL (Thermo Fisher Scientific) and off-line radioactivity detection, as in the analysis of the in vivo samples. The extraction recoveries of radiolabeled finerenone-associated analytes of all samples ranged between 80% and 110%. Atropisomers of metabolites M1, M2, and M3 were quantified analogously to human plasma samples and employing the identical LC-MS/MS system.
Incubation with Human Feces.
A suspension of fresh human feces (∼0.5 g) in degassed water (final volume: 5 ml) was incubated with [14C]finerenone (final concentration: 10 μM) under anaerobic conditions. After incubation for 24 hours at 37°C, acetonitrile (2 ml) was added to terminate the incubation. After centrifugation (∼1000 g for 5 minutes), the supernatant (25 μl) was directly analyzed by HPLC-LSC as described for radioactive metabolite profiling or by LC-HRMS analytics as described for structure elucidation for the metabolites (Supplemental Fig. S4). As positive controls for microbial activity of the used feces specimen, phenolphthalein glucuronide (Parker et al., 1980) and the N-oxide of regorafenib (Gerisch et al., 2018) were incubated using the conditions described above. Incubations of phenolphthalein glucuronide and the N-oxide of regorafenib without feces served as negative controls (Supplemental Fig. S4).
Pharmacological Activity of Metabolites.
The in vitro activity of metabolites M1a, M1b, M2a, M2b, M3a, and M3b was investigated in a functional cell-based assay system using the ligand-binding domains of human mineralocorticoid receptor as described earlier (Fagart et al., 2010).
Stability Studies of Atropisomers.
For stability studies, three aliquots of metabolite M1a (5 mg) dissolved in 1-butanol (1 ml) were warmed to 78, 90, and 105°C, respectively. Samples were taken after 0.5, 1, 2, 6, and 21 hours and then cooled and stored in the freezer at −21°C until enantiomeric excess was determined by chiral stationary phase HPLC (Supplemental Fig. S5; Supplemental Table S1).
Results
Pharmacokinetics of Relative Bioavailability Study
In part A, a 2-fold crossover design was used to assess the bioavailability of a novel aqueous solution (10 mg) of finerenone compared with an IR tablet (10 mg) of finerenone administered to eight healthy male volunteers (mean age: 51.9 years, range: 45–65 years). Each volunteer received each formulation once. The pharmacokinetic parameters for finerenone in plasma for part A are shown in Table 1. Finerenone was rapidly absorbed from both formulations, with the aqueous solution demonstrating slightly faster absorption than the tablet (tmax of 0.5 vs. 0.75 hours). Finerenone was eliminated from plasma with a half-life of 2.0 hours, and both formulations had similar systemic exposure of finerenone. The estimated treatment ratios (aqueous solution/IR tablet) for AUC and Cmax in plasma were 103% and 99%, respectively. The observed relative bioavailability of the aqueous solution compared with the IR tablet was 103%. Because the aqueous solution represented the systemic exposure of the tablet formulation, it was decided to use this formulation in part B of the study.
Pharmacokinetic parameters (geometric mean, % CV) and geometric mean of ratios obtained in healthy male volunteers for 10 mg of finerenone as an aqueous oral solution or tablet formulation (n = 8)
Excretion and Mass Balances
In humans (n = 4; mean age: 51 years; range: 50–52 years), the mean excreted total radioactivity in urine and feces was 101% (range: 88%–106%) within 10 days postdose (Fig. 1; Table 2). The total excreted finerenone-associated radioactivity was 79.6% via urine (range: 76.2%–83.3%) and 21.2% via feces (range: 9.6%–26.9%). The intervolunteer variability was higher for excretion in feces than in urine. Overall, in three of the four volunteers, the radioactivity administered was completely excreted in urine and feces (>100% in both excreta). The total recovery was lower (88.0%) in one volunteer owing to reduced excretion via feces. In dogs, within the collection interval (up to 14 days), the mean excreted total radioactivity was 94.7% (range: 93.6%–95.5%, Table 2). Excretion via urine amounted to 52.7% (range: 49.2%–55.7%), whereas via feces, 42.0% (range: 38.2%–46.7%) of the radioactivity was excreted. In rats, mean excreted total radioactivity in urine and feces was 95.2% (range: 93.5%–97.0%, Table 2) within 7 days postdose. Excretion was 19.5% via urine (range: 14.5%–21.1%) and 75.7% via feces (range: 72.7%–79.3%). Following oral administration of 10 mg/kg body weight of [14C]finerenone, 22.2% of dose was excreted via urine and 75.7% via feces in the 0–72-hour collection interval. In all species, most of the administered dose was excreted within 4 days.

Excretion (mean ± S.D.) of total radioactivity into urine and feces as well as total excretion after single oral administration of 10 mg of finerenone containing 3.3 MBq [14C]finerenone in four healthy male volunteers. SD, standard deviation.
Plasma percentage of total radioactivity AUCs, total excretion, and excretion into urine and feces for finerenone and its metabolites as observed in rat, dog, and human mass balance studies following oral administration
Data are presented as geometric means (human plasma), arithmetic means (human excreta), or as values from pooled samples for rats and dogs.
Pharmacokinetics of Human Mass Balance Study
The concentration-time profiles and pharmacokinetic parameters of unchanged finerenone and total radioactivity in healthy male volunteers are presented in Fig. 2 and Table 3. The peak concentration of finerenone was reached between 15 and 30 minutes after dosing, and the mean Cmax was 88 μg/l. Total radioactivity in whole blood paralleled those in plasma (concentration-time profile not shown) with tmax between 0.5 and 2.0 hours and mean Cmax values of 351 μg equivalents (Eq)/l in plasma and 226 μg Eq/l in blood. The blood-to-plasma ratio calculated from the geometric mean values for total radioactivity was 0.65 for AUC, indicating finerenone and its metabolites were mostly present in plasma and did not preferentially bind to blood cells. The AUC of finerenone accounted for 6.8% of the AUC of total radioactivity, indicating the presence of circulating metabolites in plasma. As the total radioactivity included the metabolites, which all demonstrated increased half-lives compared with their parent compound, the elimination of total radioactivity in plasma was prolonged [apparent terminal half-life (t1/2) ∼17 hours] compared with the elimination of finerenone (t1/2 2 hours). No radioactivity was detectable in plasma and blood after 2 and 3 days, respectively, indicating finerenone and all metabolites were mostly eliminated within this period.

Individual and geometric mean plasma concentration-time profiles for finerenone and total radioactivity (insert: up to 8 hours) after single oral administration of 10 mg of finerenone containing 3.3 MBq of [14C]finerenone in four healthy male volunteers (semilogarithmic).
Pharmacokinetic parameters (geometric mean, % CV) of finerenone in plasma and total radioactivity in plasma and whole blood after oral administration of a single dose of 10 mg of [14C]finerenone solution in healthy male volunteers (n = 4)
Metabolite Profiles in Plasma, Excreta, and In Vitro
An overview of all identified structural metabolites of finerenone from in vivo and in vitro is shown in Fig. 3. Representative chromatograms obtained by HPLC coupled with off-line radiodetection from in vivo and in vitro samples are given in Fig. 4 (humans in vivo) or are presented in Supplemental Fig. S6 (hepatocytes), Supplemental Fig. S7 (dogs in vivo), Supplemental Fig. S8 (rats in vivo), and Supplemental Fig. S9 (recombinant human P450 isoforms, Supplemental Material). Two major biotransformation pathways were identified: 1) oxidation of the dihydronaphthyridine moiety of finerenone via aromatization to the naphthyridine metabolite M1, followed by hydroxylation leading to the hydroxymethyl metabolite M2, and subsequent oxidation leading to the carboxylic acid M3 and 2) initial epoxidation, presumably, with subsequent hydrolysis leading to the dihydrodiol metabolite M4 and further hydroxylation, giving metabolite M5, and subsequent oxidation leading to the carboxylic acid M8. Further minor metabolites resulted from direct hydroxylation of finerenone, leading to metabolite M7, which was further oxidized to metabolite M9. Demethylation, oxidation followed by ring opening, and further steps yielded metabolite M10. No significant species differences were observed. The de-ethylated metabolite M13 formed by CYP1A1 and metabolite M14 resulting from several biotransformation steps formed by CYP2C8 and 3A4 were identified only in in vitro incubations. Radiolabeled finerenone-associated analytes were completely recovered (extracted) from plasma and feces. Plasma percentage of total radioactivity AUCs obtained for finerenone and the relevant metabolites as well as the excretion/metabolite profiles (percentage of dose excreted) into urine and feces for humans, dogs, and rats are given in Table 2.
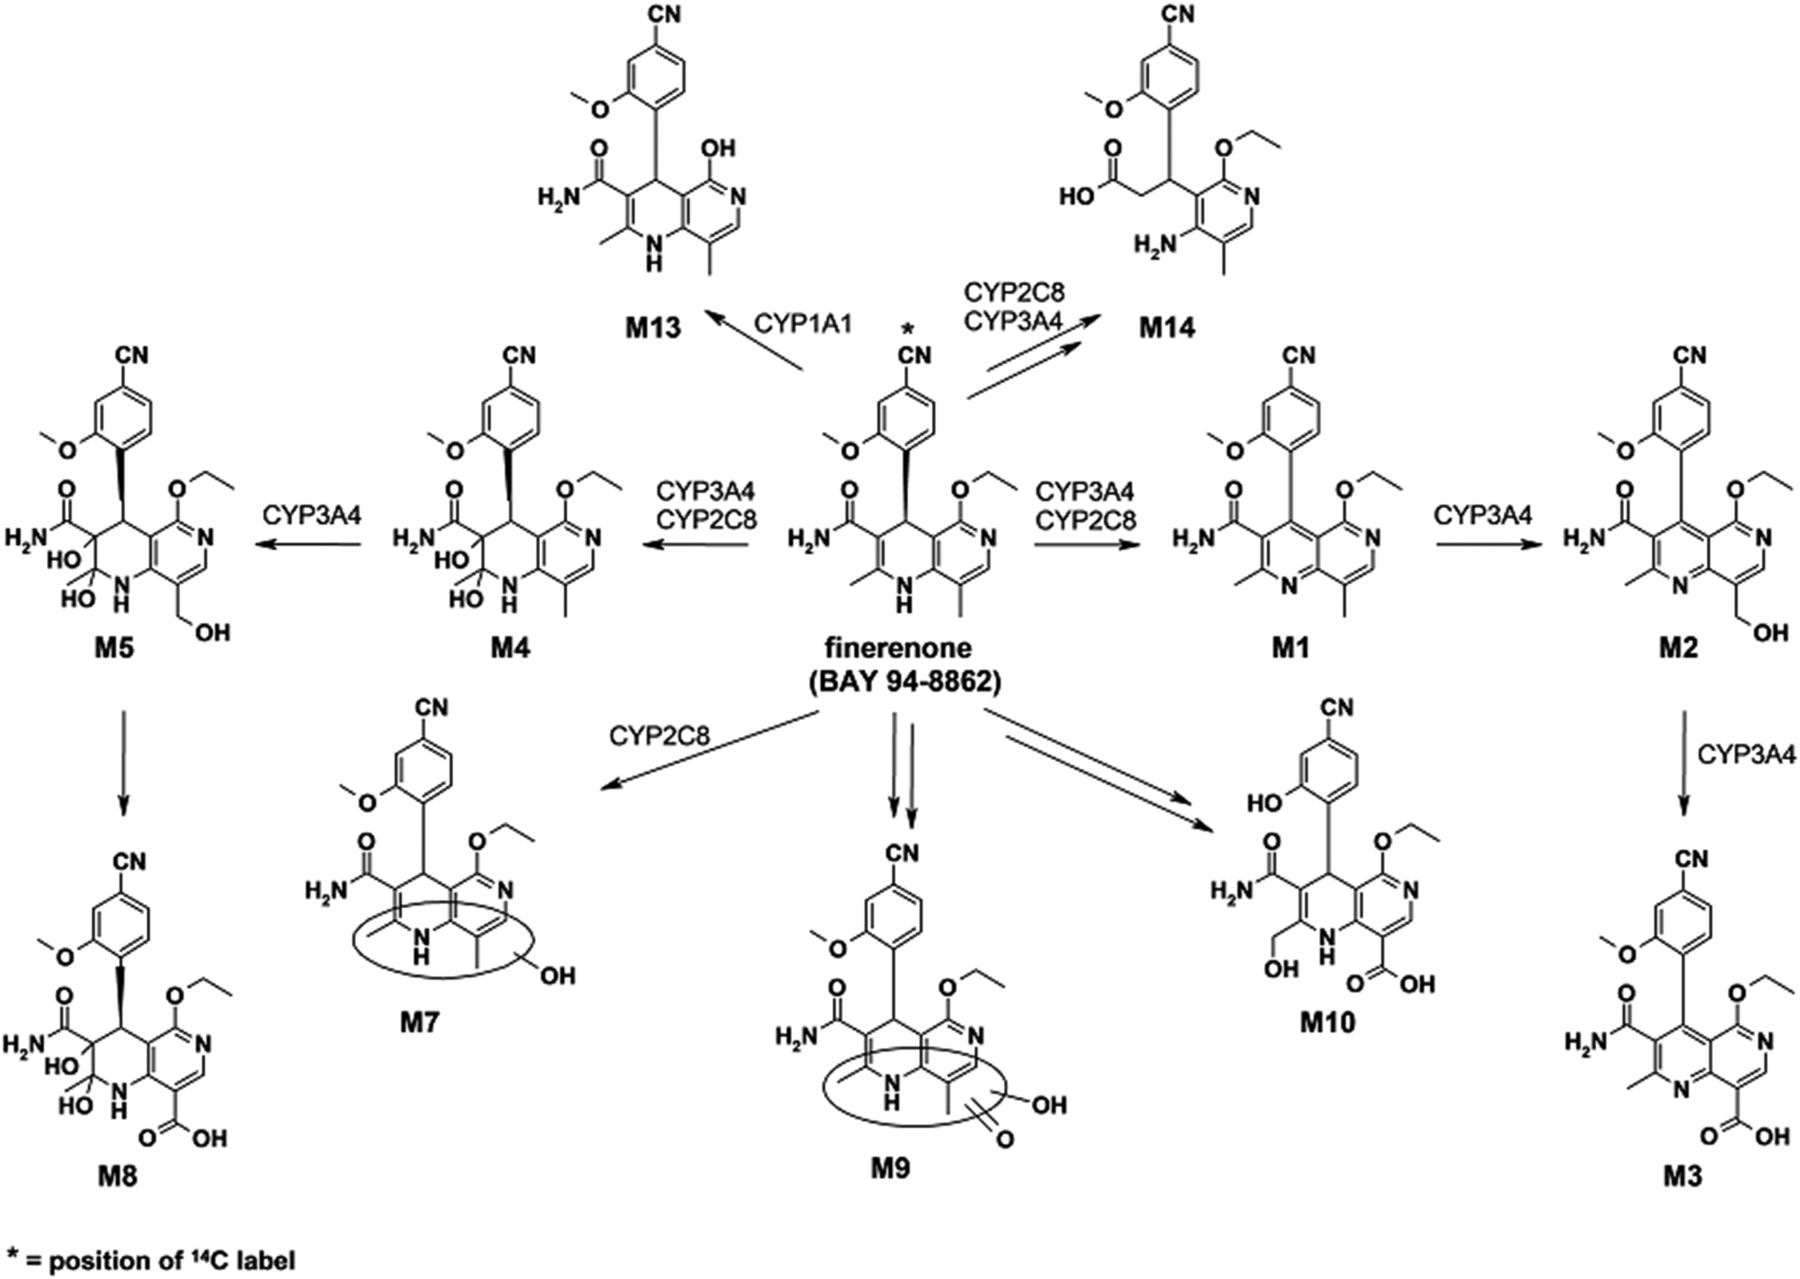
Chemical structures of finerenone (BAY 94-8862) and metabolites identified in vitro and in vivo as well as involved human P450 isoforms.

Representative HPLC profiles of human plasma (A), urine (B), and feces (C) following a single oral dose of [14C]finerenone.
Plasma.
In human plasma, on the basis of HPLC-LSC analytics, finerenone constituted 7.1% of total radioactivity AUC, which aligned with the data obtained by LC-MS/MS (6.8%). The predominant plasma metabolites were M1, M2, and M3, constituting 48.9%, 21.5%, and 9.0% of total radioactivity AUC, respectively. Dihydrodiol M4 and M5 were only present in plasma in minor amounts (<3%). In dog plasma, finerenone, metabolite M2, metabolites M4/M7, and metabolite M1 were the most prominent components, constituting 28.2%, 36.0%, 11.1%, and 8.1% of total radioactivity AUC, respectively; metabolites M3 and M5 were less important (<2%). In contrast to humans and dogs, finerenone was, by far, the major component in rat plasma (>96% of AUC of total radioactivity) with three primary metabolites (M1, M4, M7) present only in trace amounts.
Excreta.
Small amounts of finerenone were excreted into urine in all species (<1.3% of dose). In feces, finerenone accounted for ∼7.9% (rats), 2.9% (dogs), and 0.2% (humans) of the administered dose. In all species, metabolites M2, M3, M4, and M5 constituted the majority of the excreted radioactivity, with no predominant route of excretion in rats and dogs. In humans, metabolites M2, M3, and M4 were preferentially excreted via urine and M5 via feces. Naphthyridine carboxylic acid metabolite M3 was the component mainly excreted in rats and humans (26.8% and 47.8% of dose, respectively); in dogs, the naphthyridine alcohol M2 represented most of the excreted dose (42.5%). Metabolite M1 was excreted in negligible amounts (<1.5%) in all species. Following administration of 10 mg/kg body weight of [14C]finerenone in rats, the analysis of urine revealed virtually the same amount of excreted radioactivity (22.2% of administered dose within 72 hours) and metabolite pattern as observed after administration of 1 mg/kg body weight. LC-HRMS/MS investigations of further oxidative biotransformation reactions found that several other metabolites constituted the remaining radioactivity present in urine and feces.
The stability of finerenone in the microbial environment of the gastrointestinal tract was investigated by means of anaerobic incubations of [14C]finerenone with human feces for 24 hours at 37°C and using phenolphthalein glucuronide (Parker et al., 1980) and regorafenib N-oxide (Gerisch et al., 2018) as positive controls. After incubation of feces, no degradation of finerenone was observed (Supplemental Fig. S4).
Hepatocytes.
After 2 hours of incubation time, metabolic turnover was more than 50% in all species (Supplemental Fig. S6). The naphthyridine metabolites M1, M2, and M3 were the dominant metabolites formed, whereas the formation of dihydrodiol metabolites M4, M5, and M8 was less pronounced. In liver microsomes from humans, dogs, and rats, the metabolic turnover of [14C]finerenone (1 μM) was high (data not shown), corresponding with the results obtained in hepatocytes.
P450 Phenotyping.
Incubations of [14C]finerenone (1 μM) with a panel of 19 recombinant human P450 isoforms revealed CYP3A4, 2C8, and 1A1 were capable of forming several metabolites, including the primary oxidative pathways yielding M1 and M4 (Supplemental Fig. S9). The metabolite profile obtained from CYP3A4 incubations was similar to that of human hepatocytes. In addition, CYP3A4 was found to be the only isoform capable of generating secondary metabolites M2 and M5 from M1 and M4, respectively. In addition to M1 and M4, CYP2C8 formed several other oxidized metabolites, including M7, present in minor amounts in human urine and feces. The de-ethylated metabolite M13 was the most prominent one formed in incubations with CYP1A1. Neither this metabolite nor further biotransformation products of M13 were observed in human plasma or excreta, indicating negligible involvement of CYP1A1 in the biotransformation of finerenone.
Atropisomers
In-depth analytical characterization of the naphthyridine metabolites M1, M2, and M3 showed that free rotation of the 4-cyano-2-methoxyphenyl moiety is sterically hindered. Owing to the present axial chirality, two distinct atropisomers existed for each of these metabolites. An a- and b-series nomenclature was introduced to differentiate these atropisomers. The a-series represented the isomer with the methoxyphenyl group located to the front of the naphthyridine molecule plane, and for the b-series, this structural moiety was fixed behind the planarity (Fig. 5). The absolute configuration of these atropisomers was determined by X-ray crystallography for one atropisomer (Supplemental Fig. S3) and by analysis of their circular dichroism spectrum (Supplemental Fig. S2). These atropisomers were shown to be configurationally stable at ambient temperatures, and the racemic mixture of the individual species was separated by preparative HPLC in a chiral stationary phase. In addition, no racemization of the atropisomers was observed in in vitro incubations in plasma or liver microsomes at 37°C with NADPH. The configurational stability of these atropisomers has been further investigated at temperatures up to 105°C (Supplemental Fig. S5; Supplemental Table S1). Studies were performed with the M1a atropisomer in 1-butanol starting from 99.4% enantiomeric excess. On incubation at 78°C, it took approximately 12 hours to reach 50% enantiomeric excess, at 90°C about 2 hours, and at 105°C less than 1 hour; after 2 hours at 105°C, the compound was completely racemized.

Atropisomers of metabolites M1, M2, and M3 with methoxy group fixed in front (a-series) or behind (b-series) the molecular plane.
Analysis of in vitro (i.e., liver microsomes) and in vivo samples (i.e., plasma, urine, feces) of all species showed the a-series of each of the atropisomers clearly dominates (>79%) and only minor amounts are found for the b-series (Table 4). In rat plasma, no atropisomer ratio could be calculated because all atropisomers of the b series were below the lower limit of quantification at the investigated dosages. Moreover, the predominant formation of the a-isomer over the respective b-isomer of M1 was demonstrated in in vitro experiments with recombinant human CYP3A4 (M1a: M1b = 95.7% vs. 4.3%); in recombinant human CYP2C8, the predominant formation of the a-isomer was less pronounced (M1a: M1b = 70.7% vs. 29.3%). Because M1, M2, and M3 are the dominant human plasma metabolites, all six atropisomers were investigated in vitro for their pharmacological activity. For the atropisomers M1a, M1b, M2a, M2b, M3a, and M3b, there was no detectable pharmacological activity on the human mineralocorticoid receptor up to a concentration of 9 μM (the maximum concentration tested).
Atropisomer ratios in plasma and excretion (total balance) in humans, dogs, and rats following single-dose administration of [14C]finerenone, and from incubates in liver microsomes and recombinant CYP3A4 and CYP2C8
Discussion
The preclinical and clinical data presented above provide in-depth insight into the metabolic fate and excretion patterns of finerenone. Additionally, our in vitro experiments identified the enzymes involved in the biotransformation of finerenone in humans.
Pharmacokinetic parameters obtained using the oral suspension developed for the human mass balance study reported here align with those obtained in larger trials employing the 10 mg tablet formulation developed for further clinical evaluation (Lentini et al., 2016). The terminal half-life of finerenone was consistent (∼2 hours), and Cmax was 77 μg/l for the 10 mg tablet reported earlier compared with 85–87 μg/l in this study using either the 10 mg tablet or the PEG-free acidic solution. Furthermore, tmax for the oral PEG solution or 10 mg tablet was similar at 0.5 and 0.75 hours, respectively, compared with 0.25–1.0 hours observed in this clinical study using an acidic solution. Comparable results were reported from the study on pharmacokinetics in renal impairment for finerenone in the control group with normal renal function (n = 8) (Heinig et al., 2016). The observed relative bioavailability (103%) of the aqueous solution compared with the IR tablet was a marked improvement over the PEG solution, which in an earlier study had demonstrated a bioavailability of 53% relative to the tablet formulation (Lentini et al., 2016), so the aqueous solution was therefore used in the mass balance study. In contrast to the PEG-containing solution used previously in humans, the PEG-containing formulation used in dogs and rats in these studies demonstrated a high degree of absorption; a comparison of both PEG-containing formulations in preclinical species was not investigated.
HPLC-LSC analysis of the metabolite profile showed naphthyridine metabolites M1, M2, and M3 exhibited higher exposure than finerenone in human plasma; in dogs, M2 and finerenone were predominating components, followed by M1 and M4, and M3 was of minor importance. In rats, however, finerenone was the dominating component, with M1 and M4 being minor metabolites. Overall, no plasma metabolites specific to humans were detected and the major human plasma metabolites were observed in the animal test species used, thereby facilitating a thorough toxicological assessment. M1, M2, and M3 were not found to be pharmacologically active with regard to the human mineralocorticoid receptor.
Following oral administration of [14C]finerenone in humans, radioactivity was mainly excreted renally (80%); in dogs, a more balanced excretion of [14C]finerenone-related radioactivity via the biliary/fecal (42%) and renal (53%) routes was observed. In rats, however, administered radioactivity was predominantly excreted via the biliary/fecal route (76%). Although some gradual differences were observed regarding the preferred metabolic clearance pathways of finerenone, the results showed high congruence for the species studied, as the same metabolic reactions were observed in humans, dogs, and rats. Only minor amounts of finerenone were observed in excreta. The identity of the metabolites showed finerenone is almost solely cleared, prior to excretion, via oxidative biotransformation reactions in vivo, mainly via naphthyridine metabolites (M1, M2, M3), and to lesser extent via dihydrodiol metabolites (M4, M5, M8), in all species. Of note, in all three species, extraction recoveries of radiolabeled finerenone-associated analytes after workup of individual samples in plasma as well as in hepatocytes and liver microsomes are complete, with values around 100% and in line with the essentially complete recovery of the administered radioactive dose observed in excreta (humans: 101%, dogs: 94.7%, rats: 95.2%).
The in vivo data obtained with the naphthyridine pathway (sum of M1, M2, M3: rats, 41%; dogs, 48%; humans, 63% of the excreted dose) favored over the dihydrodiol pathway (sum of M4, M5, M8: rats, 17%; dogs, 17%; humans, 22% of the excreted dose) reflect the in vitro data obtained in hepatocytes (sum of M1, M2, M3 > sum of M4, M5, M8) in all species (Supplemental Fig. S6; Table 2). In humans and rats, the carboxylic acid M3 is the predominant metabolite in excreta. In dogs, metabolite M2 represented the major metabolite in excreta, indicating lower enzymatic activity for formation of the carboxylic acid M3. Overall, the naphthyridine metabolites in rats were predominantly excreted in feces, whereas urinary excretion dominated in humans and dogs. These metabolites have molecular weights of 376–406 g/mol, which can explain the higher fraction of biliary excretion observed in rats compared with dogs and humans. The interspecies differences in the threshold for (predominant) biliary excretion of anionic compounds (such as M3) are well known. The lowest threshold was observed in rats, with molecular weight threshold values reported between 325 and 400 g/mol, and higher thresholds have been observed in other rodents, dogs, and humans (e.g., 475–500 g/mol) (Hirom et al., 1972; Yang et al., 2009).
Data regarding renal excretion for the naphthyridine metabolites obtained in this human mass balance study (M1: < limit of detection; M2: ∼13%; M3: ∼46%; analysis by HPLC-LSC) were well in line with results reported earlier (M1: 0.3% of dose; M2: ∼11%; M3: ∼44%; analysis by LC-MS/MS) (Heinig et al., 2016). Renal excretion of unchanged finerenone was <1%. The small degree of renal excretion of the parent compound was considered reassuring for its use in patients. Renal impairment has limited influence on finerenone pharmacokinetics, as already confirmed (Heinig et al., 2016), whereas the evaluation of clinical efficacy in patients with diabetic kidney disease is ongoing (ClinicalTrials.gov: NCT02540993 and NCT02545049).
In vitro phenotyping experiments revealed CYP3A4 to be the dominating P450 isoform involved in the oxidative biotransformation of finerenone, with CYP2C8 of minor importance. Recombinant CYP1A1 was also found to be capable of metabolizing finerenone. However, as CYP1A1-specific metabolite M13 was not observed in human plasma or excreta, involvement of CYP1A1 in finerenone biotransformation was excluded. The quantitative contribution of CYP3A4 and CYP2C8 to finerenone clearance was investigated in detail in vitro with human hepatocytes supplemented with isoform-specific inhibitors, as well as in dedicated clinical drug-drug interaction studies with the moderate CYP3A4 inhibitors erythromycin and verapamil and the strong CYP2C8 inhibitor gemfibrozil (Heinig et al., 2018). In line with the in vitro phenotyping data, the dominant role of CYP3A4 in finerenone biotransformation was demonstrated by a calculated fraction metabolized of 0.88/0.89 for CYP3A4 from the clinical drug-drug interaction studies, and a minor contribution of CYP2C8 (fraction metabolized ∼0.1).
Detailed investigations revealed the predominant human plasma metabolites M1, M2, and M3 exhibited axial chirality as pairs of atropisomers, each consisting of an a- and a b-series metabolite. Atropisomers are an established phenomenon in drug discovery (LaPlante et al., 2011). Investigations regarding the configurational stability indicated temperatures far higher than 37°C are required to convert one atropisomer to the other, demonstrating that the formed atropisomers are configurationally stable and that the observed pharmacokinetics of the atropisomers are not influenced by thermal configurational instability. Experimental findings, in which a temperature of 90°C for full racemization after 6 hours is required, support the high rotational stability of atropisomers of M1, M2, and M3. Analysis of plasma, urine, and feces after administration of [14C]finerenone revealed the predominant appearance of the atropisomers of the a-series for the metabolites M1, M2, and M3 across all investigated species (a: b = > 79% vs. <21%, Table 4). The atropisomer ratios observed in mass balances are well reflected by data obtained in liver microsomes of humans, dogs, and rats (Table 4). Metabolite M1a is preferentially formed by recombinant CYP3A4 (M1a: M1b = 95.7% vs. 4.3%) compared with recombinant CYP2C8 (M1a: M1b = 70.7% vs. 29.3%). These data were in line with the data obtained in human liver microsomes (M1a: M1b = 94.6% vs. 5.4%) with CYP3A4 as the predominant metabolizing enzyme of finerenone. In humans, an increased proportion of the “a” over “b” atropisomers is observed in plasma and excreta for the metabolites M1 (M1a: M1b = 79.3% vs. 20.7% in plasma, 86.0% vs. 14.0% in excreta), M2 (M2a: M2b = 94.6% vs. 5.4% in plasma, 93.6% vs. 6.4% in excreta), and M3 (M3a: M3b = 99.1% vs. 0.9% in plasma, 97.3% vs. 2.7% in excreta), in that order. This can be explained partly by the observation that the biotransformation of M1 to M2 is 2-fold more efficient for the a-isomer (Supplemental Fig. S10). Furthermore, CYP2C8 contributed to M1 formation, thus yielding higher amounts of M1b, whereas M2 formation was driven solely by the preference of CYP3A4 for the a-isomer.
In summary, the excretion pattern in urine and feces of humans, dogs, and rats revealed that finerenone is cleared by oxidative biotransformation, mostly via naphthyridine derivatives and to a lesser extent via dihydrodiol derivatives. Oxidative metabolism of finerenone in humans was predominantly catalyzed by CYP3A4, with a minor contribution from CYP2C8. Dominant human plasma metabolites were identified and characterized as configurationally stable atropisomers exhibiting no pharmacological activity.
Acknowledgments
We thank Torsten Löffler for technical support in analyzing the mass balance studies, and Karin Nowak and Dirk Gäfke for technical support with the in vitro incubations and structure elucidation.
Authorship Contributions
Participated in research design: Engelen, Schwarz, Lang, Platzek, Kolkhof, Gerisch, Heinig, Radtke, Rohde, Lovis.
Conducted experiments: Engelen, Lang, Kolkhof, Schwarz, Rohde, Lovis, Platzek, Gerisch.
Contributed new reagents or analytic tools: Lang, Kolkhof, Engelen, Rohde, Platzek, Lovis, Gerisch.
Performed data analysis: Heinig, Lang, Engelen, Gerisch, Rohde, Kolkhof, Platzek, Lovis, Schwarz, Radtke.
Wrote or contributed to the writing of the manuscript: Gerisch, Engelen, Heinig, Lovis, Kolkhof, Radtke, Lang, Platzek, Rohde, Schwarz.
Footnotes
- Received June 26, 2018.
- Accepted August 29, 2018.
This work was supported by Bayer AG, Wuppertal, Germany. Christine Cyrus provided editorial assistance. Oxford PharmaGenesis, Oxford, UK, edited the manuscript; this support was funded by Bayer AG, Berlin, Germany. Primary laboratory of origin: Bayer AG, Wuppertal, Germany.
↵
 This article has supplemental material available at dmd.aspetjournals.org.

Abbreviations
- AUC
- area under concentration-time curve
- Cmax
- maximum concentration
- HPLC
- high-performance liquid chromatography
- HRMS
- high-resolution mass spectrometry
- IR
- immediate-release
- LC-HRMS
- liquid chromatography with high-resolution mass spectrometry
- LC-HRMS/MS
- liquid chromatography with high-resolution tandem mass spectrometry
- LC-MS/MS
- liquid chromatography with tandem mass spectrometry detection
- LSC
- liquid scintillation counting
- MRA
- mineralocorticoid receptor antagonist
- P450
- cytochrome P450
- PEG
- polyethylene glycol
- tmax
- time to maximum concentration
- Copyright © 2018 by The Author(s)
This is an open access article distributed under the CC BY-NC Attribution 4.0 International license.


