


Article Figures & Data
Figures
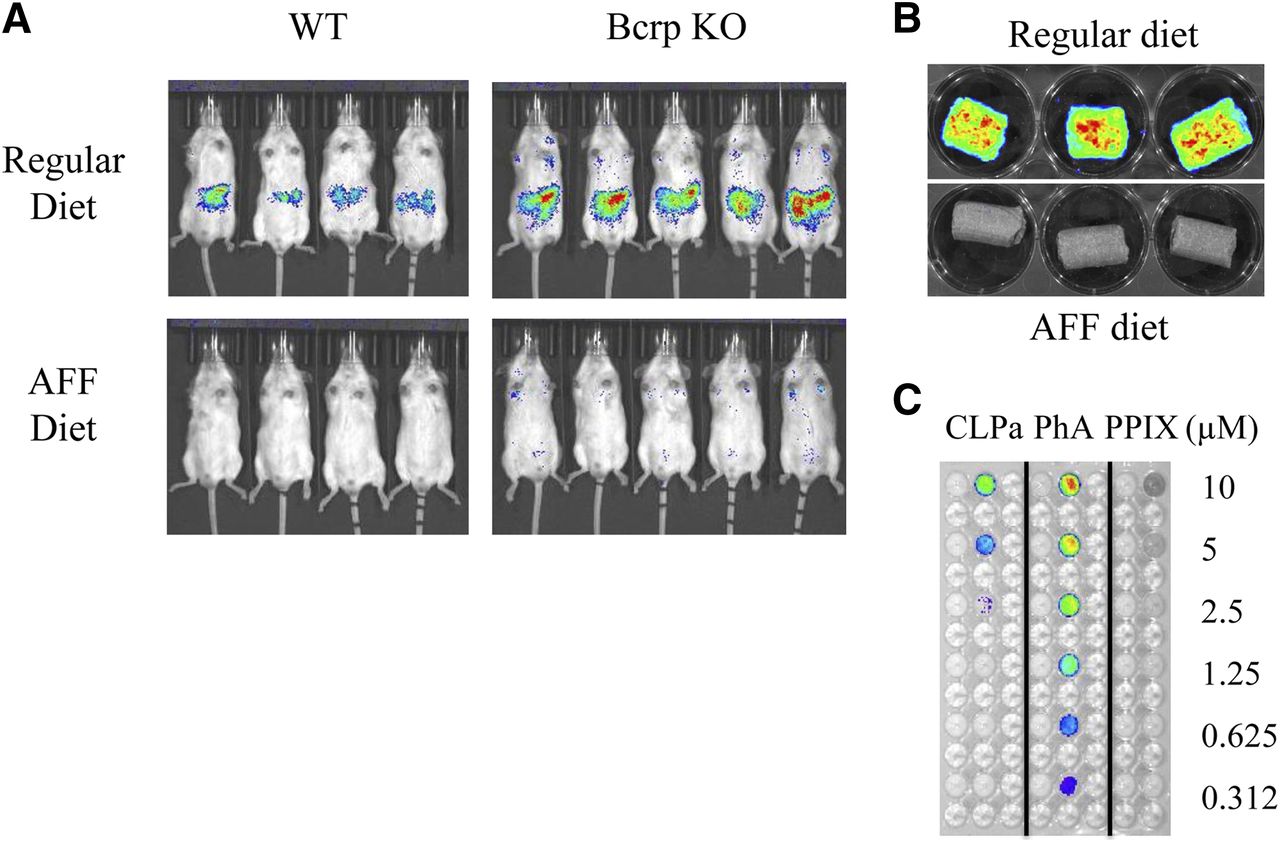
- Fig. 1.
Autofluorescence derived from dietary PhA is higher in the Bcrp KO compared with WT mice. (A) Comparison of fluorescence (Ex, 675 nm; Em, 840 nm) in WT and Bcrp KO mice fed a regular diet or an AFF diet at least for 3 days. (B) Comparison of fluorescence (Ex, 675 nm; Em, 840 nm) in a regular and AFF diet. (C) Fluorescence comparison of the known concentrations of CLPa, PhA, and a prototypical Bcrp substrate PPIX fluorescence with filter setting (Ex, 675 nm; Em, 840 nm).
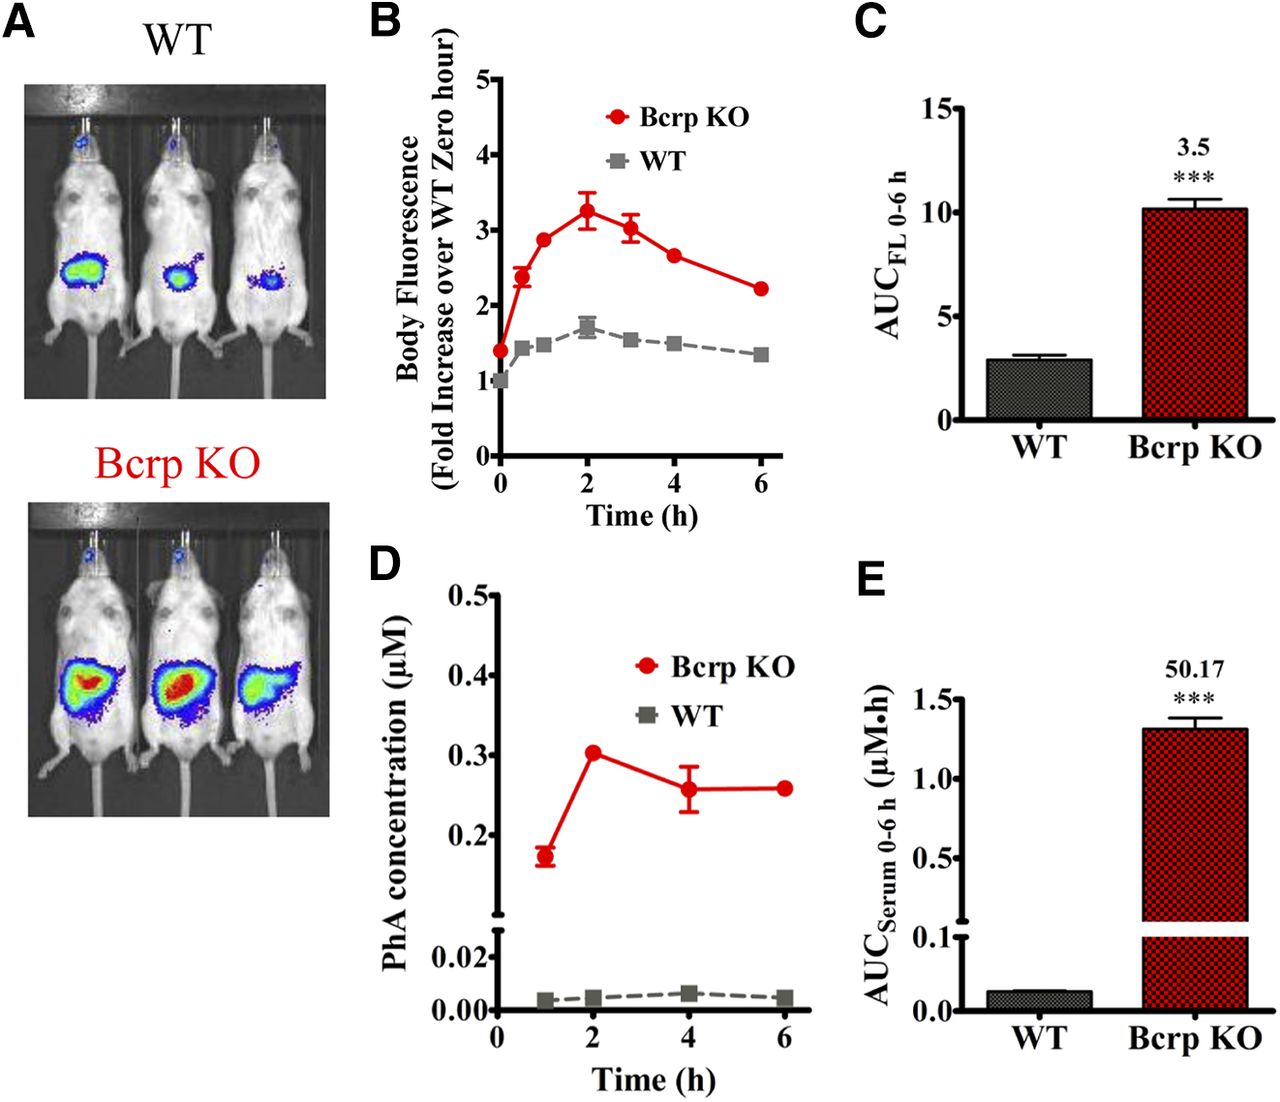
- Fig. 2.
Absence of Bcrp leads to higher absorption of PhA in enterocytes. Ex vivo image comparison of intestinal segments of WT and Bcrp KO mice on a regular diet, after flushing out the gut contents with saline. Microscopic examination of cross-sectional images of upper intestine from WT and Bcrp KO mice on regular diet: blue is 4′,6-diamidino-2-phenylindole dihydrochloride stain for nuclear localization); red is PhA using the Cyanine5 Ex/Em wavelengths; A signifies apical and B signifies basolateral side of the intestinal section.
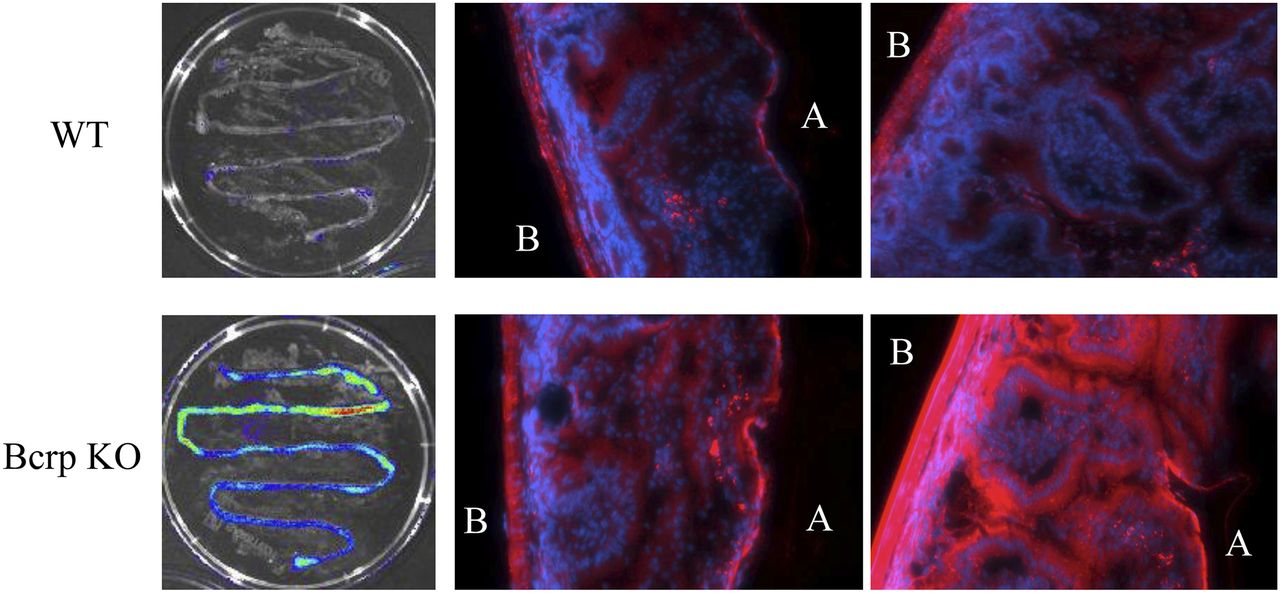
- Fig. 3.
PhA oral absorption is significantly higher in the Bcrp KO mice. (A) Representative image comparing PhA fluorescence (Ex 675 nm; Em, 840 nm) in WT and Bcrp KO mice, 2 hours after oral administration of 10 mg/kg PhA. (B) Fluorescence intensity over 0-hour WT fluorescence-time profile up to 6 hours after 10 mg/kg PhA oral administration in Bcrp WT and KO mice (n = 3). Comparison of the AUCFL 0–6 h in (B) calculated using GraphPad Prism version 5.02 (C). Comparison of PhA serum concentration at 1, 2, 4, and 6 hours from the WT and Bcrp KO mice dosed with 10 mg/kg PhA (D) and the associated AUCSerum 0–6 h value (E). Results are presented as the mean ± S.E.M.; and significance is calculated at P < 0.05 by comparing the means with an unpaired t test. ***P < 0.001.
- Fig. 4.
Determination of the IC50 for selected Bcrp inhibitors using PhA as a probe substrate. The mean percentage increase in PhA accumulation ± S.E.M. in the MDCKII cells overexpressing BCRP in the presence of selected Bcrp inhibitors was plotted against the log transformed inhibitor concentration (Conc). IC50 was determined using GraphPad Prism version 5.02.
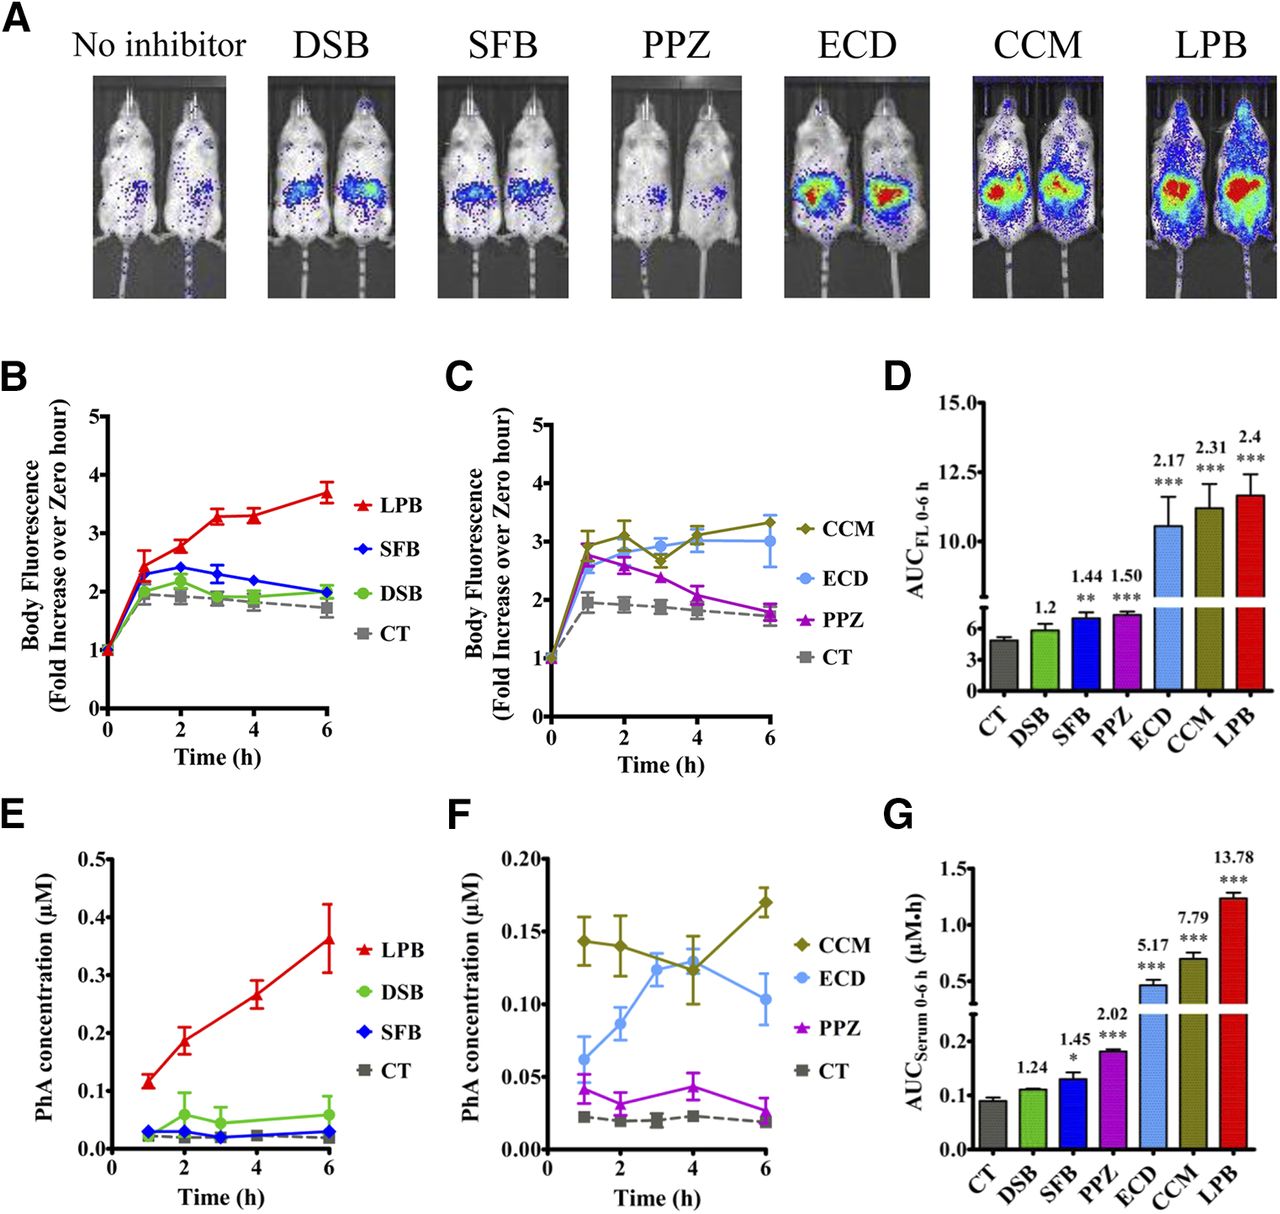
- Fig. 5.
Inhibition of BCRP increased whole-body fluorescence as well as the serum concentration of PhA in control FVB mice. Six-hour representative image comparing fluorescence (Ex, 675 nm; Em, 840 nm) in control mice orally administered 10 mg/kg PhA with or without Bcrp inhibitors 1 hour prior to PhA administration, as indicated in the Materials and Methods (A). Whole-body fluorescence (flux/s) was normalized to the 0-hour fluorescence of the same mice, and the data were plotted as the mean fluorescence ratio ± S.E.M. vs. time (hours) for the tyrosine kinase inhibitors (B) and other inhibitors (C). (D) AUCFL 0–6 h calculated for each mouse and plotted as the mean ± S.E.M. PhA serum concentration-time plot for the control and tyrosine kinase inhibitors (E) and other inhibitors (F) plotted as the mean ± S.E.M. and the associated AUCSerum 0–6 h calculated using GraphPad Prism version 5.02 (G). Significance is calculated by comparing the mean AUC after inhibitor treatment with that of control AUC by unpaired t test. Significance is calculated at P < 0.05. *P < 0.05; **P < 0.01; ***P < 0.001.


Tables
- TABLE 1
Literature reported properties of selected inhibitors and final outcome of the experiment
DSB SFB PPZ ECD CCM LPB Known parameters from literature and database Molecular weight (g/mol) 488.01 464.83 383.37 563.65 368.38 581.06 Predicted solubility (µM) (DrugBank database) 26.23 3.68 1291.18 4.99 15.61 38.38 Predicted logP (DrugBank database) 2.77 4.12 2.11 6.81 3.62 5.18 Reported IC50 (µM) 3.1a 5.5b 0.31c 1.6d 0.025e Clinical information Dose 100 mg once dailyf 400 mg twice a day 40 mg Once dailyg 400 mg twice a dayg 2 g Once dailyg 1250 mg dailyg Cmax (µM) 0.46f 6.45h 6.5g 0.327g 4.2g Igut/IC50 1110 67g 9200g 14,000g 21,0000g Cmax/IC50 2.08 1.2g 1.1g 170g Possible DDI No Yes Yes Yes Yes Yes PK information from mice Dose (mg/kg) 10 40 40 100 300 90 Cmax (µM) ∼0.7i 21a 0.78j ∼0.06k ∼10l Tmax (h) 0.25–2 1m 8 1.5 0.5–1 t1/2 (h) 20 12 3 Prediction of possible outcome in mouse based on selected dose and observed IC50 Observed IC50 (µM) 22.76 2.18 11.19 0.21 2.52 0.04 Cmax/IC50 0.03 9.63 3.71 0.02 250 Oral dose for mice study (mg/kg) 10 40 40 100 300 90 Cgut (µM) 639 2689 3260 5544 25,449 4840 Cgut/IC50 28 1233 291 26,400 10,098 121,000 Cgut_soluble/IC50 1.2 1.7 115.4 23.7 6.2 959.5 Expected oral DDI Yes Yes Yes Yes Yes Yes In vivo serum concentration result AUCSerum 0–6 h (µM/h) 0.11 ± 0.002 0.13 ± 0.02 0.18 ± 0.01 0.46 ± 0.08 0.70 ± 0.1 1.24 ± 0.09 Fold change over control 1.24 1.45 2.02 5.17 7.79 13.78 Observed DDI? No No Yes Yes Yes Yes Live animal fluorescence result AUCFL 0–6 h 5.82 ± 1.27 6.98 ± 1.15 7.30 ± 0.74 10.55 ± 2.12 11.2 ± 1.75 11.66 ± 1.54 Fold change over control 1.2 1.44 1.50 2.17 2.31 2.4 Observed DDI? No No Yes Yes Yes Yes t1/2, half-life; Tmax, time for maximal plasma concentration; Cgut_soluble is soluble fraction of the drug in the gut, assumed to be equal to predicted solubility.
↵a Hu et al. (2009).
↵b Suzuki et al. (2009).
↵c Ahmed-Belkacem et al. (2005).
↵d Kusuhara et al. (2012).
↵e Polli et al. (2008).
↵f Di Gion et al. (2011).
↵g Lee et al. (2015).
↵h Strumberg et al. (2007).
↵i Kamath et al. (2008).
↵j Sane et al. (2012).
↵k Zhongfa et al. (2012).
↵l Hudachek and Gustafson (2013).
↵m Lagas et al. (2010).
Data Supplement
- Supplemental Data -
Supplemental Figure 1 - PhA is present in the regular alfalfa containing mouse diet but not in the AFF diet
Supplemental Figure 2 - Fluorescence spectra showing identity of the PhA peak used for determination of PhA concentration in serum
Supplemental Figure 3 - Effect of oral Elacridar on PhA whole body fluorescence and serum concentration in Bcrp KO vs. WT mice
Supplemental Figure 4 - For this series of inhibitors, the Bcrp inhibitor natural log transformed gut concentration (Cgut) over IC50 vs. fold change by inhibitor in AUC of PhA whole body fluorescence (A), and serum fluorescence (B) each show a linear relationship
- Supplemental Data -


