


Article Figures & Data
Figures
- Fig. 1.
Radiochromatographic metabolite profile of [14C]-AZD7325 in male rat plasma acquired with a pooled 0- to 12-hour sample collected after a 2 mg/kg oral dose to animals (A). LC-MS accurate-mass extracted ion chromatograms showing nonconjugate metabolites (B) and conjugate metabolites (C), with y-axis normalized to the same MS intensity scale. The letters S and G in parentheses denote O-sulfate and O-glucuronide respectively.
- Fig. 2.
The initial metabolic sites of AZD7325 (marked in red) and subsequent pathways.
- Fig. 3.
LC-MS/MS CID spectra of protonated molecular ions of AZD7325 (A), M4 metabolite (B), M5 and M6 metabolites (C and D), M11 and M12 metabolites (E and F) acquired from the same pooled mouse plasma sample. Also provided are spectral interpretations on fragmentations.
- Fig. 4.
LC-MS metabolite profiles of AZD7325 in human plasma samples collected from a Phase I multiple ascending dose clinical study conducted in clinic: pooled 0- to 24-hour sample after the first dose on day 1 (A), pooled 0- to 24-hour sample after the seven repeated once-a-day doses (B) and at 48 hours after the final of the seven repeated once-a-day doses (C), displayed by accurate-mass extracted ion chromatograms with nonconjugate and conjugate metabolites in left and right columns, respectively, and y-axis normalized to the same MS intensity scale for each sample.
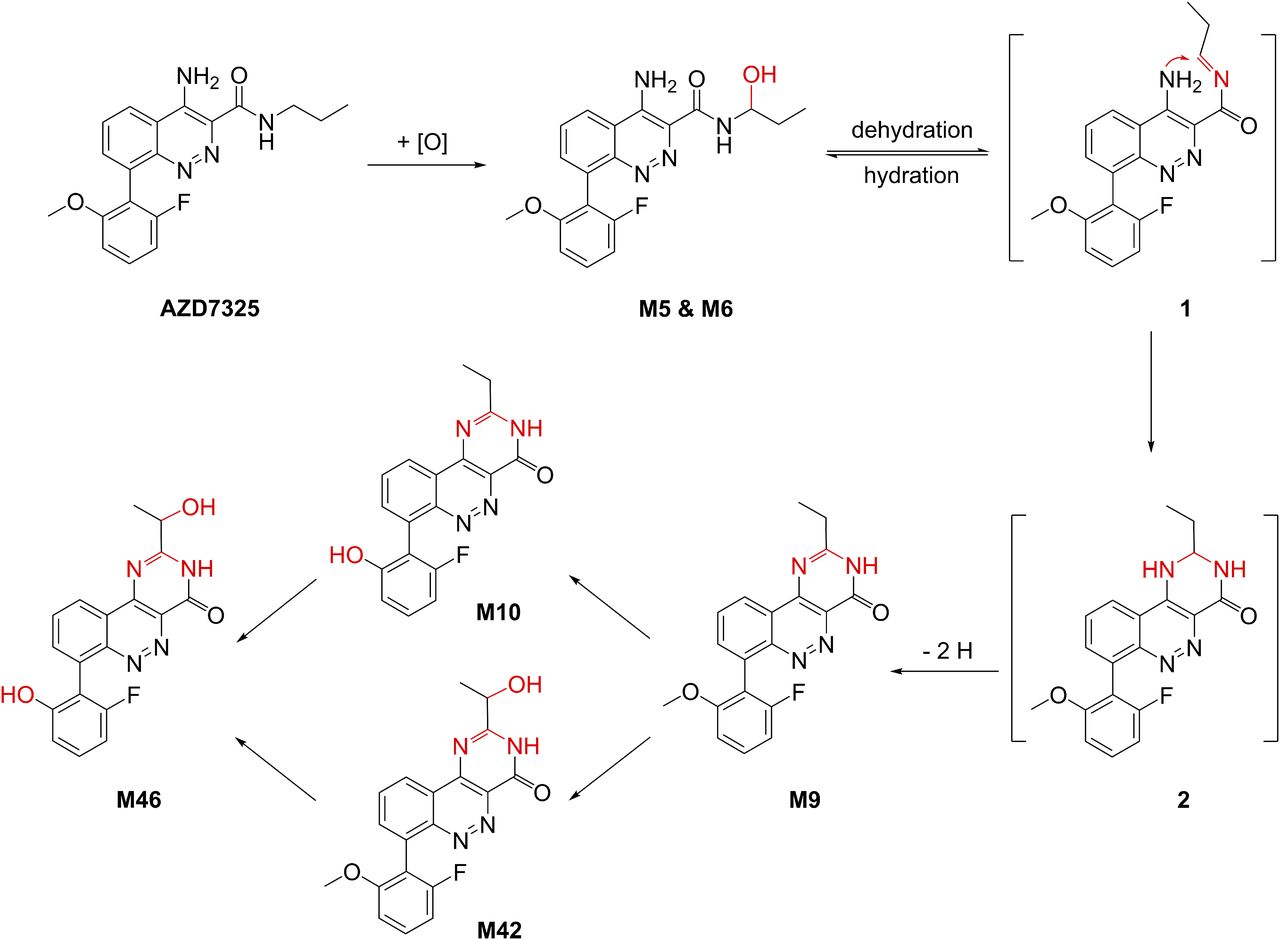
- Scheme 1.
Proposed formation mechanism for metabolites M9 and its subsequent metabolites M10, M42, and M46.
- Fig. 5.
Metabolite profiles of AZD7325 in plasma sample of three different patients collected on Day 21 during a Phase IIb clinical trial (i.e., Patients Z, R and U in Table 2), showing a full metabolite profile in Patient Z (A), only long-circulating metabolites in Patient R (B), and no metabolites in Patient U (C). Data are displayed in LC-MS extracted ion chromatogram, with non-conjugate and conjugate metabolites in left and right columns respectively. The same internal standard (IS) was added to all samples.
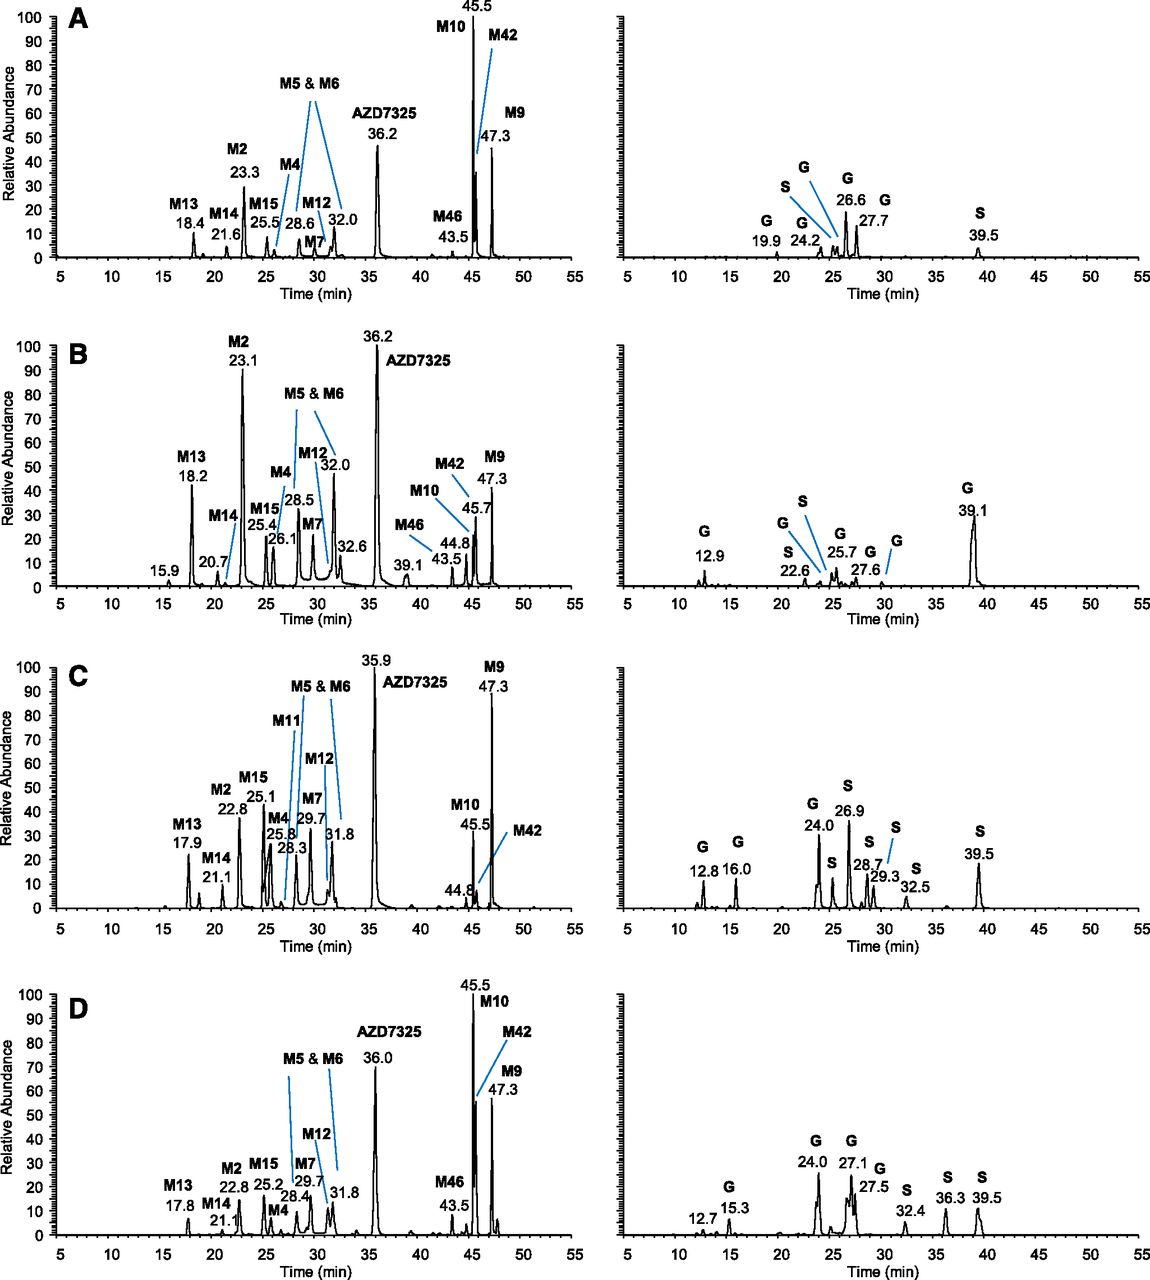
- Fig. 6.
LC-MS metabolite profiles of AZD7325 in pooled human plasma collected over 24 hours after seven repeated daily doses of 50 mg/kg (A) and pooled dog plasma of 45 mg/kg per day dose group (B), rat plasma of 100 mg/kg per day dose group (C), and mouse plasma of 400 mg/kg per day dose group (D) collected over 24 hours on day 91 from the 3-month safety study in respective animal species. Nonconjugate and conjugate metabolites are displayed in left and right columns, respectively, with y-axis normalized to the same MS intensity scale for each species. The letters S and G denote O-sulfate and O-glucuronide, respectively.
- Scheme 2.
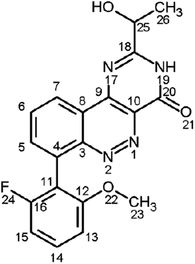
Nonconjugate metabolites of AZD7325 in plasma of humans and preclinical animal species. Calculated exact mass of the protonated molecular ion is provided in m/z for every metabolite. Blue fonts in the metabolite numbering indicate metabolites with an estimated level at approximately 10% or greater than 10% of parent drug AZD7325 in the pooled human plasma.


Tables
- TABLE 1
NMR data extracted from proton and COSY pdf spectra for the M42 metabolite isolated from a pooled dog plasma sample
Two diastereomers of M42 were recorded due to hindered rotation around C4-C11.

M42 Atropisomer 1 M42 Atropisomer 2 Proton Shift Proton Shift ppm 5 7.77 (d, J = 7.0 Hz) 7.96 (d, J = 7.0 Hz) 6 7.87 (t, J = 7.5 Hz) 8.04 (t, J = 7.5 Hz) 7 8.81 (d, J = 8.0 Hz) 8.83 (d, J = 8.0 Hz) 13 7.05 (d, J = 8.0 Hz) 7.11 (d, J = 8.0 Hz) 14 7.49 (q, J = 8.0 Hz) 7.55 (q, J = 8.0 Hz) 15 6.97 (t, J = 8.8 Hz) 7.03 (t, J = 8.8 Hz) 23 3.65 (s) 3.57 (s) 25 4.48 (q, J = 6.5 Hz) 4.81 (q, J = 6.5 Hz) 26 1.44 (d, J = 6.5 Hz) 1.48 (d, J = 6.5 Hz) - TABLE 2
Metabolite profiling results for 36 plasma samples collected from nine representative patients of the 15 mg twice daily dose group in a Phase IIb clinical trial
Patients were designated with arbitrary letters to keep anonymous.
Representative Category Patient Center Day AZD7325 Concentration (ng/ml) Metabolites No sample below LOQ X 03 7 68.5 Full profile X 03 14 64.5 Full profile X 03 21 83.3 Full profile X 03 28 91.1 Full profile Y 05 7 24.1 Full profile Y 05 14 31.8 Full profile Y 05 21 21.0 Full profile Y 05 28 93.1 Full profile Z 56 7 80.4 Full profile Z 56 14 35.0 Full profile Z 56 21 36.0 Full profile (see Fig. 5A) Z 56 28 46.0 Full profile Some samples below LOQ R 14 7 53.9 Full profile R 14 14 3.0 Full profile R 14 21 Below LOQ Only M9, M10 and M42 (see Fig. 5B) R 14 28 Below LOQ Only M9, M10 and M42 S 49 7 24.3 Full profile S 49 14 22.0 Full profile S 49 21 Below LOQ Only M9, M10 and M42 S 49 28 Below LOQ Only M10 and M42 T 20 7 17.8 Full profile T 20 14 Below LOQ Only M9, M10, M42, and M46 T 20 21 Below LOQ Only M9, M10, M42, and M46 T 20 28 Below LOQ Only M10, M42, and M46 All samples below LOQ U 16 7 Below LOQ None U 16 14 Below LOQ None U 16 21 Below LOQ None (see Fig. 5C) U 16 28 Below LOQ None V 40 7 Below LOQ None V 40 14 Below LOQ None V 40 21 Below LOQ None V 40 28 Below LOQ None W 45 7 Below LOQ None W 45 14 Below LOQ None W 45 21 Below LOQ None W 45 28 Below LOQ None LOQ, limit of quantitation (i.e., 0.5 ng/ml).
Data Supplement
- Supplemental Figures -
Supplemental Figure 1 - Synthesis scheme and 15N HMBC spectrum of the M9 synthetic standard
Supplemental Figure 2 - LC-MS/MS CID spectra of human liver microsomal metabolite M9 vs. the synthetic M9 vs. human and preclinical animal plasma metabolites M9.
Supplemental Figure 3 - PDA UV spectra of AZD7325, the M9 metabolite and synthetic standard
Supplemental Figure 4 - LC-MS/MS chromatogram showing the formation of M10 and M42 by human liver microsomal incubation of the M9 synthetic standard
Supplemental Figure 5 - Confirmation of the human liver microsomal metabolite M42 to be identical to plasma metabolite M42 by LC-MS/MS CID high resolution spectra
Supplemental Figure 6 - Two convertible diastereomers of M42, presumably due to hindered rotation about the aryl-aryl bond
Supplemental Figure 7 - A tentative mechanism involving the formation of a 5-methyloxazole ring for M9 and a subsequent pathway leading to M42 was once considered.
Supplemental Figure 8 - On-column interconversion of carbinolamine metabolites M5 and M6 possibly involving an imine intermediate
Supplemental Figure 9 - Comparison in the exposure of the non-conjugate metabolites in the AUC pooled human plasma vs. the AUC pooled dog and rat plasma
- Supplemental Figures -


