


Abstract
The quantification of drug metabolizing enzymes and transporters has recently been revolutionized on the basis of targeted proteomic approaches. Isotope-labeled peptides are used as standards for the quantification of the corresponding proteins in enzymatically fragmented samples. However, hurdles in these approaches are low throughput and tedious sample prefractionation steps prior to mass spectrometry (MS) readout. We have developed an assay platform using sensitive and selective immunoprecipitation coupled with mass spectrometric readout allowing the quantification of proteins directly from whole cell lysates using less than 20,000 cells per analysis. Peptide group-specific antibodies (triple X proteomics antibodies) enable the enrichment of proteotypic peptides sharing a common terminus. These antibodies were employed to establish a MS-based immunoassay panel for the quantification of 14 cytochrome P450 (P450) enzymes and nine transporters. We analyzed the P450 enzyme and transporter levels in genotyped liver tissue homogenates and microsomes, and in samples from a time course induction experiment in human hepatocytes addressing different induction pathways. For the analysis of P450 enzymes and transporters only a minute amount of sample is required and no prefractionation is necessary, thus the assay platform bears the potential to bridge cell culture model experiments and results from whole organ tissue studies.
Introduction
Many xenobiotic compounds can induce their own elimination as well as the elimination of other substances by increasing the abundance of the proteins that catalyze their metabolism and transport (Zanger and Schwab, 2013). Phase I and II enzymes as well as transporter proteins are relevant in studying drug-drug interactions, with the objective of precisely understanding the drug metabolism system. Of particular importance for drug metabolism in humans are the cytochrome P450 (P450) isoforms 1A1, 1A2, 2A6, 2B6, 2C8, 2C9, 2C19, 2D6, 2E1, and 3A4/5, as well as the drug-relevant transporters ABCB1, ABCG2, OATP1B1, OATP1B3, SLC22A2, SLC22A6, and SLC22A8, among others. Current protocols and experimental design of such induction experiments have been described by Chu et al. (2009), among others. These protocols, and also the US Food and Drug Administration, recommend using mRNA as a surrogate for protein induction since protein methods such as western blots rely on antibodies, which often cannot discriminate between members of the same subfamily (Food and Drug Administration, 2012).
In recent times, mass spectrometry (MS) has become a widely used method for the indirect quantification of proteins since it allows measuring proteotypic peptides in enzymatically fragmented samples as protein surrogates. Quantification of the peptide, and indirectly of the protein, can be achieved by adding isotope-labeled peptide standards in a defined amount to the digested sample (Gerber et al., 2003; Nature Methods, 2013). By referencing the signals derived from the endogenous peptide and the peptide standard, quantification can be achieved. In several studies, this method was applied to analyze drug metabolizing enzymes and transporters from membrane fractions of tissue and cell culture (Oswald et al., 2006; Ohtsuki et al., 2012; Schaefer et al., 2012), and the introduction of an immunoprecipitation step using peptide-specific antibodies prior to mass spectrometric readout resulted in better sensitivity and higher throughput (Anderson et al., 2004; Jiang et al., 2007). More recently, we introduced peptide group–specific antibodies [triple X proteomics (TXP) antibodies] to this workflow. These antibodies bind short C-terminal sequences of proteotypic tryptic peptides, allowing peptides to be enriched with high sequence similarities using just a single antibody for several analytes (Weiß et al., 2015; Groll et al., 2016; Marx-Stoelting et al., 2017). This method was used to analyze P450 and transporter proteins directly from cell culture or tissue samples without any prefractionation steps, such as membrane enrichment (Kawakami et al., 2011; Ohtsuki et al., 2012; Schaefer et al., 2012) or SDS-PAGE (Langenfeld et al., 2009; Miliotis et al., 2011).
Here, we extended this concept to analyze 14 P450 enzymes, nine transporters, and cytochrome P450 oxidoreductase (POR) using 13 TXP antibodies. We demonstrate the suitability of the method for analyses of tissue samples. Moreover, comparison of whole tissue and microsome samples suggests that membrane enrichment as a prepurification step can be omitted for the analysis of such proteins. The method is semiautomated and highly parallelized, allowing a throughput of up to 100 runs/day and MS. Most importantly, the method is highly sensitive, allowing the analysis to be performed from less than 10 µg protein extract. Since primary hepatocytes are the most precious part of induction experiments, this sensitive method enables the design of experiments in the 96-well format, thereby saving on cost and materials.
Materials and Methods
Total Protein.
Protein concentrations were determined using a BCA Assay Kit (Thermo Scientific, Waltham, MA).
Peptide Standards.
Isotopically labeled standard peptides (Intavis, Tübingen, Germany) were quantified by amino acid analysis on a high-performance liquid chromatography (LC) system (Agilent 1100 Series HPLC Value System; Agilent Technologies, Santa Clara, CA).
Epitope-Motif Analysis of Antibodies—Protein Digestion.
Total protein (150 μg) generated by lysis of HepG2 cells was diluted in triethanolamine buffer (50 mM, pH 8.5) and 0.5% octyl-β-D-glucopyranoside, reduced by tris(2-carboxyethyl phosphine) (TCEP) (5 mM), and denatured by heating up to 99°C for 5 minutes. Afterward, proteins were alkylated by adding iodoacetamide (10 mM) and incubated for 30 minutes at room temperature. Trypsin was added in a ratio of 1:40 (trypsin:protein). After 16-hour incubation at 37°C the digestion procedure was stopped by heating the samples up to 99°C for 5 minutes and adding phenylmethylsulfonyl fluoride (PMSF) to a final concentration of 1 mM.
Epitope-Motif Analysis of Antibodies—LC-MS Procedure.
Specificities of TXP antibodies were tested by performing immunoprecipitation in triplicates from tryptically digested cell lysate (HepG2). For this step, 20 µg digested lysate was incubated with 5 µg antibody, and 25 μL protein G-coated magnetic microspheres were used to precipitate peptide antibody complexes. Elution was performed in 20 µL 1% formic acid (FA). A 10 μL eluate was separated on a rapid separation LC (RSLC) system (UltiMate 3000 RSLCnano LC System; Thermo Scientific). For desalting, a PepMap100 µ-precolumn (0.3 mm i.d. × 5 mm; Thermo Scientific) was used, and for separation, an Acclaim RSLC Column (75 µm i.d. × 150 mm; Thermo Scientific) was used. The samples were loaded onto the column with a buffer containing 98% double distilled H2O, 2% acetonitrile, and 0.05% trifluoroacetic acid. A linear gradient starting with 4% B and ending after 20 minutes at 55% B was applied. Mobile phase A was composed of 99.9% double distilled H2O and 0.1% FA, and mobile phase B was composed of 80% acetonitrile with 0.1% FA. Sample measurement using a full-MS method on a Q Exactive Plus (Thermo Scientific) and data analysis were performed as described previously (Weiß et al., 2015).
Dynamic Range of MS-Based Immunoassays.
Dilution series were prepared in triplicates in analyte-free buffer containing proteolytically fragmented fish gelatin (50 mM Tris-HCl, 150 mM NaCl, and pH 7.4) (Blocking Reagent; Roche Diagnostics, Mannheim, Germany). Isotopically labeled peptides (Intavis) at a concentration of 100 nm were serially diluted eight times in a ratio of 1:3, while nonlabeled peptides (Intavis) were kept constant at a concentration of 10 nM. For immunoprecipitation, total peptide amounts ranging from 1000 to 0.15 fmol were used. Immunoprecipitation procedures were performed using 1 µg antibody. After separation by nano-LC (UltiMate 3000 RSLCnano; Thermo Scientific), peptide ratios of endogenous und isotopic-labeled peptides were determined using targeted selected ion monitoring (QExactive Plus; Thermo Scientific) as described previously (Gallien et al., 2012).
Immunoprecipitation.
Enzymatically fragmented proteins were mixed with TXP antibodies and stable isotopic standards. After an incubation period of 1 hour, peptide-antibody complexes were precipitated using protein G-coated magnetic microspheres (Dynabeads Protein G; Life Technologies, Carlsbad, CA) in a magnetic particle processor (KingFisher; Thermo Scientific). Peptide-antibody-microsphere complexes were washed twice in phosphate-buffered saline + 0.3% 3-[(3-Cholamidopropyl)dimethylammonio]-1-propanesulfonate hydrate and three times in ammonium bicarbonate + 0.3% 3-[(3-Cholamidopropyl)dimethylammonio]-1-propanesulfonate hydrate. Elution was performed in 20 µl 1% FA.
Peptide Quantification Using Nano-LC Targeted Selected Ion Monitoring.
P450 and transporter peptides were measured with the same instrumental setup, including columns and buffer composition, but different LC methods, and the 5 μL eluate was separated using step gradients and subsequent washing procedures (UltiMate 3000 RSLCnano; Thermo Scientific). P450 peptides were separated with a gradient starting at 10% phase B and ending after 8 minutes with 35% phase B using a flow rate of 300 nl/min. The column oven temperature was held at 40°C. Including the wash procedure, the total run time was 18 minutes. Transporter peptides were separated with a flow rate of 1000 nl/min at 55°C using a gradient spanning 10%–25% phase B over 2.75 minutes. The total run time was 10 minutes. Peptides were quantified using targeted selected ion monitoring (QExactive Plus; Thermo Scientific).
Data Analysis.
Raw data were processed with Pinpoint 1.4 (Thermo Scientific). Peak areas of isotopically labeled peptides representing known peptide amounts and endogenous signals were set in relation to one another on the parent ion level. Influences of nonlabeled standard peptide impurities on the correctness of quantification were avoided by defining the lower limit of quantification (LLOQ) as either 1% of the spiked standard peptide amount or the lower limit of the working range (S.D.: <20%, recovery: 80%–120%), whichever was the higher value. Data from different tissue fractions were compared by calculating the Pearson correlation coefficients.
Recombinant Proteins—Protein Digestion.
Single recombinant protein (250 μg) in triethanolamine buffer (50 mM, pH 8.5) and 0.5% octyl-β-D-glucopyranoside were reduced with TCEP (5 mM) and denatured at 99°C for 5 minutes. After alkylation for 30 minutes at room temperature with iodoacetamide (10 mM), trypsin was added in a ratio of 1:40 (trypsin:protein). After 16 hours, trypsin was added again in a ratio of 1:40. The digestion procedure was stopped after 40 hours by a heating step and the addition of PMSF (1 mM).
Liver Tissue Samples.
Liver tissue samples for fraction comparison and genotype/phenotype analysis (set A, n = 10) were provided by the Dr. Margarete Fischer-Bosch Institute of Clinical Pharmacology. Set A contained samples from five female and five male patients aged between 47 and 75 years, who had been diagnosed with primary liver cancer or liver metastasis. For assay reproducibility and tissue analysis, liver tissue (set B, n = 15) was provided by Uppsala University. Set B contained liver biopsies from 12 males and three females aged between 42 and 79 years. The diagnoses were clear cell carcinoma, hepatocellular carcinoma, colorectal cancer, and renal cell carcinoma. The biopsies did not contain tumor tissue, but healthy liver tissue. The studies were approved by the local ethics committees and conducted in accordance with the Declaration of Helsinki (https://www.wma.net/policies-post/wma-declaration-of-helsinki-ethical-principles-for-medical-research-involving-human-subjects/). Written informed consent was obtained from each patient.
Microsomal versus Whole Tissue Preparation—Microsomal and Nuclei/Membrane Fractionation.
Microsomes, cytosols, and crude membrane/nuclei fractions were taken from one preparation process each as described previously (Lang et al., 2001; Hitzl et al., 2003). Homogenates of corresponding liver samples were prepared as described subsequently.
Liver Tissue Analysis—Tissue Preparation.
Liver tissues were homogenized using a ball mill (Micro-Dismembrator S, Sartorius, Göttingen, Germany). Lysis buffer was added with a 10-fold volume (microliters) of the weighed liver piece value (micrograms), and homogenates were directly processed or snap frozen in liquid nitrogen and stored at −80°C until preparation. Samples were incubated for 1 hour at 8°C under continuous rotation.
Liver Tissue Analysis—Protein Digestion.
Protein samples (50 μg) were digested in triethanolamine buffer (50 mM, pH 8.5) and 0.5% octyl-β-D-glucopyranoside. For reduction, TCEP (5 mM) was used, and for alkylation, iodoacetamide (10 mM) was used (for protein digestion results, see Analysis of Antibody Specificity). For enzymatic fragmentation, trypsin was added in a ratio of 1:10 (trypsin:protein). After 16 hours, trypsin was spiked again in a ratio of 1:10. After 40 hours, the digestion procedure was stopped by heating and adding PMSF (1 mM).
Expression Induction Study—Cultivation of Cryopreserved Hepatocytes.
Induction-qualified plateable human hepatocytes (donor HU81, 48–55-year-old woman; Life Technologies) were cultivated as a monolayer in collagenized 96-well plates at a density of 50,000 cells per well. Medium containing primary hepatocyte thawing and plating supplements, L-glutamin, and William’s E medium was used for thawing and adhesion. Medium was changed to maintenance medium (primary hepatocyte maintenance supplements, L-glutamin, and William’s E medium) after 24 hours. After an adhesion phase of 48 hours, cells were treated with rifampicin (10 µM), phenobarbital (3 mM), and omeprazole (100 µM) for 72, 48, and 24 hours, respectively. The total cultivation time was 72 hours for all cells. Control treatments were performed using maintenance medium containing 0.1% dimethylsulfoxide. Cells were seeded and harvested at the same time, but treatment was started at different time points. Standard inducers were applied to the cell culture media 72, 48, 24, and 0 hours prior to harvesting. To study the basal enzyme level during cultivation, controls were collected after the adhesion phase (T0) and after the total cultivation time using maintenance medium without dimethylsulfoxide (T72).
Expression Induction Study—Lysis and Protein Digestion.
For lysis, cells were washed once with ice-cold phosphate-buffered saline, and afterward lysed using 50 µl lysis buffer. After incubation at 8°C for 1 hour, cells were transferred to a PCR Plate, 96-well (Thermo Scientific). Protein samples (11 μg) were digested in triethanolamine buffer (50 mM, pH 8.5) and 0.7% octyl-β-D-glucopyranoside. Proteins were reduced using TCEP (5 mM) and alkylated by iodoacetamide (10 mM) (for protein digestion results, see Analysis of Antibody Specificity). Trypsin was added in a ratio of 1:3 (trypsin:protein). After 16 hours, trypsin was added again, taking an equal amount. After 40 hours, the digestion procedure was stopped by heating the samples and adding PMSF (1 mM). Since protein amounts were lower than 15 µg per well after cultivation, only the quantification of P450 enzymes and the transporter ABCB1 could be performed.
Results
Generation of Antibodies.
For the identification of suitable antigens, we aligned the C-termini of all peptides generated from the 14 P450 enzymes, nine transporters, and POR after tryptic in silico digestion. In total, 13 C-terminal epitopes were required to address peptides representing the respective human P450 enzymes and transporters. The C-terminal sequence FSGR, for instance, was shared by five proteotypic P450 peptides derived from 2B6, 2C8, 2C18, 2E1, and 2F1. Four members of P450 family 3 and one transporter shared the terminus LPNK (3A4/3A43, 3A5, 3A7, and ABCB1) (Weiß et al., 2015). The sequence LQEEIDAVLPNK can be found both in CYP3A4 and CYP3A43. However, for CYP3A43 no (or only very low) expression levels have been observed in previous liver quantification studies (Kawakami et al., 2011; Schaefer et al., 2012). The termini YIPK (1A1, 1A2), LAER (2C9, 2C19), GSLR (ABCC1, ABCC2), and DLFR (SLC22A7, SLC22A8) address two targets each, and the termini SVLK (CYP2D6), FIPK (CYP3A43), GGEK (ABCB11), GDLK (SLC10A1), QDEK (SLC22A9), PSSK (SLCO1B1), and FVEK (POR) address only one each. Immunization and purification of the TXP antibodies were performed as described previously (Hoeppe et al., 2010).
Analysis of Antibody Specificity.
We performed a detailed epitope analysis of the generated TXP antibodies by LC-tandem MS measurements of immunoprecipitates from digested HepG2 lysates (Planatscher et al., 2010, 2014). Eluated peptides were separated by nano-LC and detected using a high-resolution tandem mass spectrometer (QExactive Plus; Thermo Scientific). All peptide identifications obtained by MASCOT (Matrix Science, London, UK) and SEQUEST (Eng et al., 1994) data analysis were investigated for enrichment analogies. Epitope motifs of the antibodies were determined considering statistical significance of the enrichment procedure (P = 0.05). All single epitopes were weighted for the number of identified peptides sharing the same single epitope and combined to a motif logo. For example, the immunoprecipitation procedure using anti-LAER resulted in a combined motif logo consisting of 14 single motifs due to the polyclonal properties of the antibody. Overall, the logo is based on 159 significantly enriched peptides (Fig. 1). Forty-five peptides comprise the sequence LAER at the C-terminus. Thus, 22% of the theoretical number of all proteome-wide LAER peptide fragments (201) was observed in the HepG2 digest. Peptide sequences sharing the motifs LAER (45 out of 201), LAEK (17 out of 209), and LAQR (16 out of 147) are numerically the most frequently identified single epitopes of the epitope motif. In comparison, the antibody anti-FVEK provided 25 peptide identifications comprising the C-terminus FVEK. The antibody was capable of enriching 40% of all theoretically existing FVEK peptides—64 peptides in total, assuming all known proteins are expressed and present in detectable peptide amounts (all epitope motifs are provided in Supplemental Fig. 1).

Frequency of C-termini after immunoprecipitation from proteolyzed HepG2-lysate (technical replicates, n = 3) using the TXP antibodies anti-LAER (A) and anti-FVEK (B). Peptides were analyzed by high-resolution tandem MS and identified combining the MASCOT and SEQUEST algorithms. Enrichment analogies were identified considering statistical significance (P = 0.05). Single epitopes were weighted for the number of identified peptides and combined in a motif logo. Size of the letter represents percentage of identified peptides carrying the respective amino acid at this position.
Dynamic Range of MS-Based Immunoassays.
We determined the LLOQ according to the US Food and Drug Administration’s recommendation for bioanalytical method validation. Mean values of accuracy (variation) and precision (recovery) were within 15% at the LLOQ and did not exceed 20% at the LLOD. For peptides derived from CYP1A1, CYP2C18, CYP3A4/CYP3A43, CYP3A5, and CYP3A7, LLOQs of 460 amol were achieved, reflecting a peptide concentration of 46 pM. The proteotypic peptides of CYP2C9, CYP2C19, ABCB1, and SLC22A9 could be quantified down to 1.4 fmol (140 pM). The assays for the peptides of CYP1A2, CYP2B6, CYP2C8, CYP2E1, CYP2F1, SLC10A1, SLC22A7, and SLCO1B1 revealed LLOQs of 4.1 fmol (410 pM), and the peptides of ABCC1, ABCC2, and SLC22A8 were quantifiable at 12.3 fmol (1.2 nM). For ABCB11 and POR, LLOQs of 3.7 nM were observed. The peptide derived from CYP2D6 could not be quantified below 111.1 fmol (11.1 nM) within a deviation of <20% (Fig. 2; Supplemental Figs. 2 and 3).
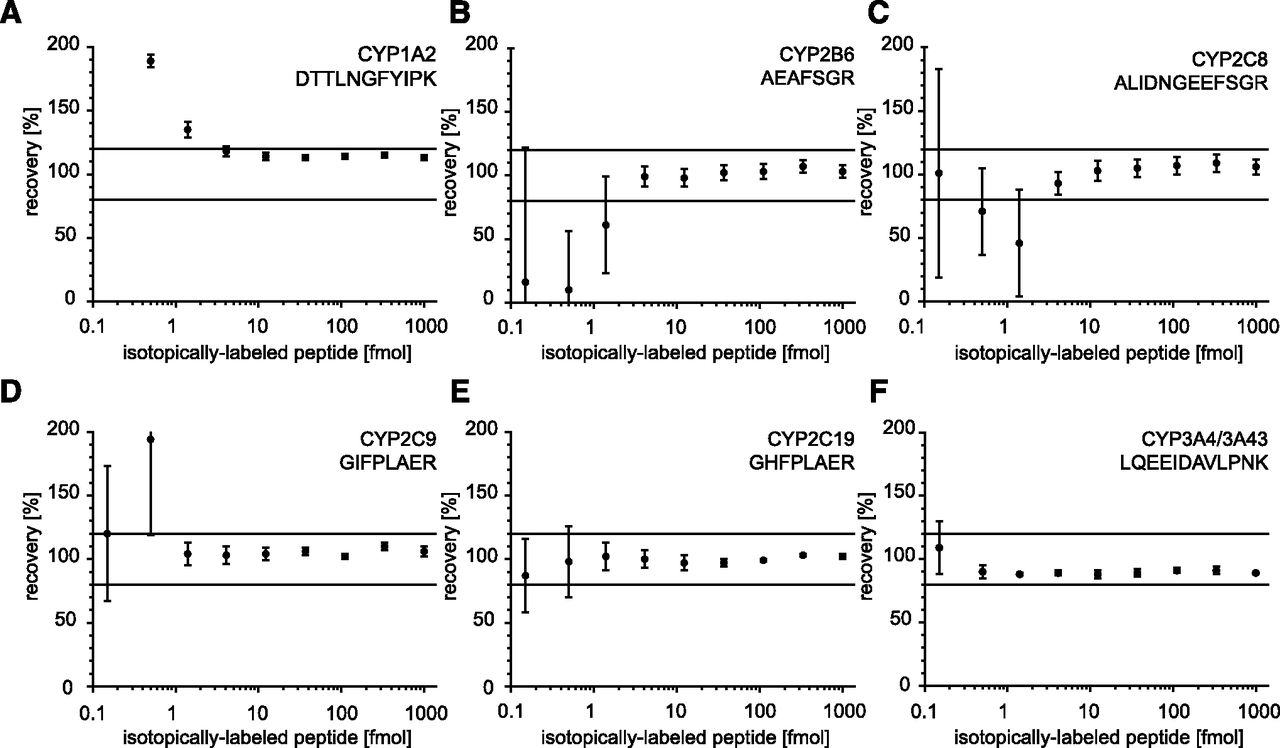
(A–F) Accuracy and recovery of selected MS-based immunoassays. Isotope-labeled peptides were serially diluted in analyte-free buffer containing proteolytically fragmented fish gelatin, while sequence-identical nonlabeled peptides were kept constant (technical replicates, n = 3). For immunoprecipitation, absolute peptide amounts ranging from 1000 to 0.15 fmol were provided. By using the signal of the nonlabeled peptide, the isotope-labeled peptide amount was back-calculated and plotted as recovery. Linearity of approaches is demonstrated over at least three orders of magnitude. Mean and S.D. are depicted.
Digestion Kinetics.
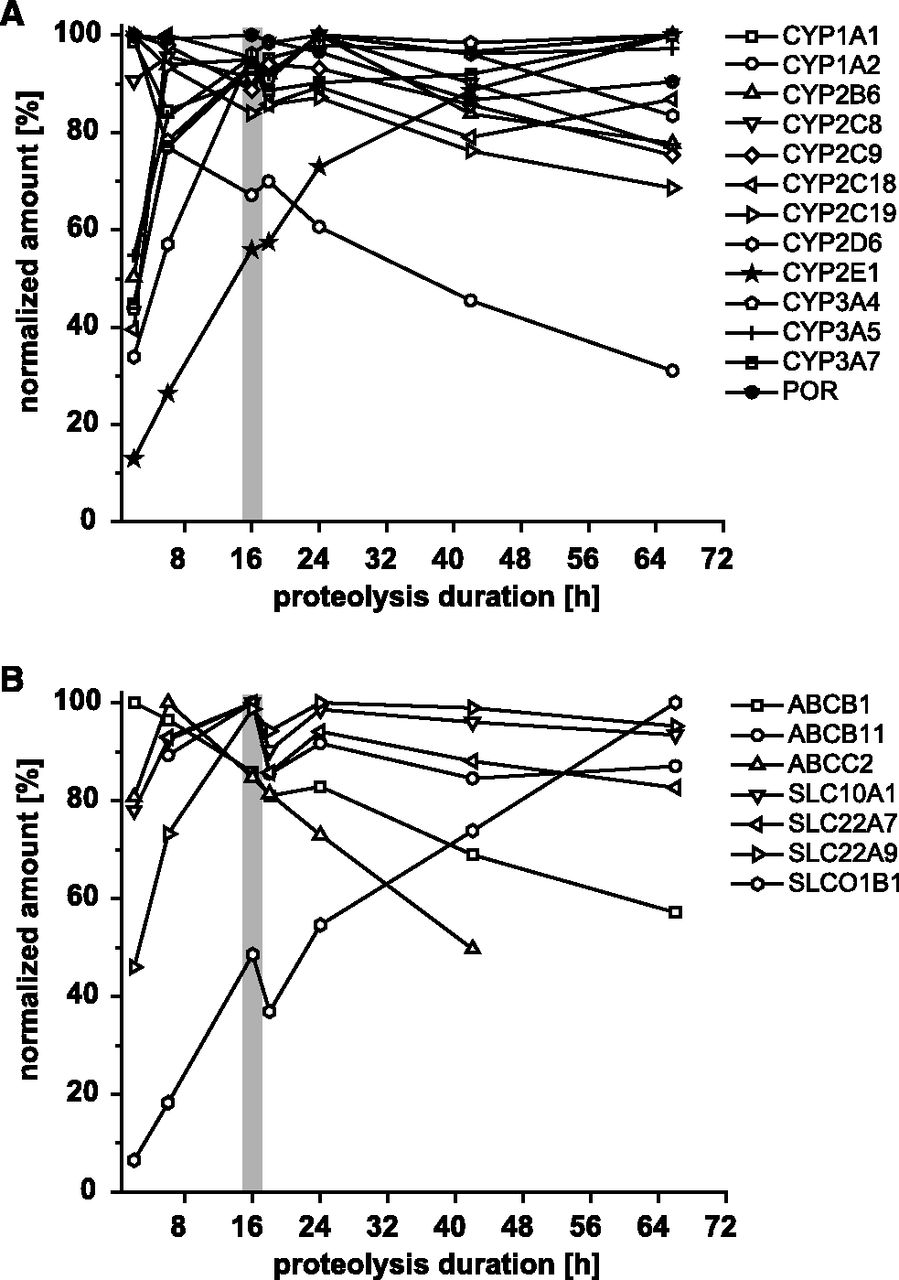
To ensure a complete proteolyzation of lysates, which is needed for absolute quantification, we analyzed the digestion kinetics of the chosen peptide set by treating a liver lysate with trypsin for varying time periods. Peptides derived from P450 enzymes and transporters were quantified after digestion periods of 2, 6, 16, 18, 24, 42, and 66 hours (Fig. 3). After 16 hours, most P450 enzymes and transporters showed a high relative digestion rate. After 24 hours, several target peptides showed diminished values. By comparison, the CYP2E1 peptide showed a decelerated release. For this peptide, the highest signal was achieved after an incubation period of 66 hours. In contrast, considerable signal decrease of the CYP1A2 peptide was already observed after 6-hour digestion, which could be due to surface adsorption.

Digestion kinetics. P450 enzymes (A) and transporters (B) were quantified considering different digestion periods. Maximum quantified peptide concentrations were set to 100% and declared as the normalized amount. The optimal digestion duration for the analysis of all analytes in one experiment is indicated in gray. Representative experiment is shown.
Recombinant Proteins.
The recovery of the assays was tested by analysis of the commercially available 12 recombinant P450 proteins and POR usually used for enzyme-substrate assays (Cypex Bactosomes, Dundee, UK). Using our MS-based immunoassays we quantified the targets in the respective single-expression samples and compared the results to the data provided by the manufacturer by means of UV-spectral analysis of the heme-iron group. The results, presented in Fig. 4, were generally very similar to the manufacturer’s spectral data. However, for CYP1A1 and CYP3A7 we observed higher amounts of protein compared with the specified amounts.

Quantification of recombinant P450 proteins. P450 enzymes expressed in bacterial membranes and standardized using a spectral determination method were quantified using MS-based immunoassays. The ratio between TXP quantification and spectral quantification was determined (technical replicates, n = 3; mean and S.D. are shown).
Microsomal versus Whole Tissue Preparation.
Microsomal preparations are commonly used as the starting material for MS-based quantification of P450s. We analyzed the amount of the different P450s in liver tissue, and microsomal and other cell fraction preparations of 10 liver tissue samples (set A) to investigate if direct analysis of the whole tissue extract is feasible. The quantitative P450 enzyme data obtained for whole tissue homogenates and microsomes correlated very well with correlation coefficients between 0.86 and 1.00 (Supplemental Table 1). The enrichment factor in the microsomal preparation was 3.4 on average with a variance of 51% across all P450 analytes. If the results for CYP3A7 are not considered, the average enrichment factor was 2.9 with a much lower variance of 12% (Supplemental Table 2). As shown in Fig. 5, all analytes could be detected in the tissue lysates as well in the microsomal preparations, suggesting that the microsomal enrichment step is not necessary for the quantification of P450 enzymes. Transporters were quantified from tissue extract, microsomes, and a crude membrane/nuclei-enriched fraction prepared during the microsomal preparation (Lang et al., 2001; Hitzl et al., 2003). The data correlated with values between 0.51 and 0.98. For transporters, enrichment factors between 1.2 and 3.9 were observed.
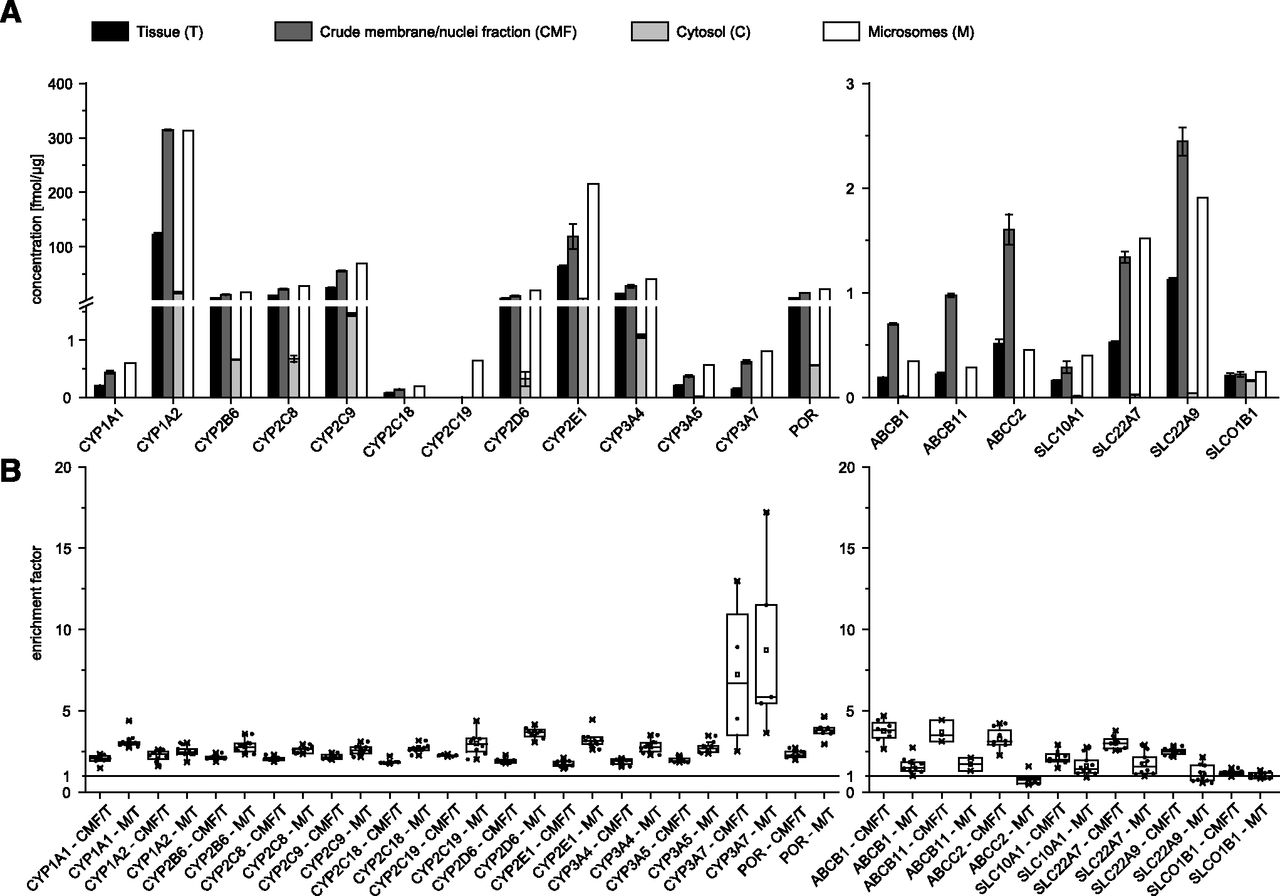
(A) Quantification of P450 enzymes and transporters from liver tissue T (set A) and three different fractions (crude membrane/nuclei fraction, CMF; microsomes, M; and cytosol, C), from one preparation from tissue material of donor 4 (technical replicates: T, CMF, and C n = 3; microsomal preparation was measured as a single replicate due to the limited amount of sample; mean and S.D. are shown). (B) Enrichment of analytes by CMF and microsomal preparation. Ratio between either CMF or microsomal preparation (M) and direct quantification strategy from tissue (T) was determined. Results are depicted as a box blot (box: 25th, 75th percentile, whiskers: <1.5 IQR (interquartile range); all values are depicted as dots; minimal and maximal values are indicated as X).
Assay Reproducibility.
To determine the reproducibility of the TXP quantification workflow, three liver tissue samples from set B were analyzed for P450 enzymes and transporters in triplicates on three different days. Interday assay variances are displayed in Fig. 6 and listed in Supplemental Table 3. For P450 enzymes, the analysis revealed variances ranging from 0.7% to 8.8% for intraday measurements and from 1.9% to 11.0% for interday measurements. For transporters, intraday variances ranged from 0.3% to 13.0% and interday variances ranged from 1.5% to 37.9%. If the results for ABCC2 were excluded from the analysis, the CVs improved to 1.5%–20.1%

Reproducibility and variation of MS-based immunoassays (technical replicates, n = 9). Three tissue samples (from set B) had been selected. P450 enzymes and transporters were quantified in triplicates on three different days (*: less than LLOQ).
Liver Tissue Analysis.
A set of 15 patient-derived liver samples (set B) were investigated for P450 and transporter levels (Fig. 7). CYP2C9 was determined to be the highest expressed target analyte, averaging 15 fmol/µg, and CYP2C8, CYP1A2, CYP2D6, CYP3A4, and CYP2E1 showed mean expression levels between 6.5 and 3.6 fmol/µg, exceeding that of POR (3.4 fmol/µg). The remaining P450s (CYP2C19, CYP2B6, CYP3A5, CYP3A7, CYP2C18, and CYP1A1) were expressed at lower concentrations than POR (0.9 fmol/µg and less). Thus, taking into account the enrichment factor for microsomal proteins, our quantified analyte levels corresponded approximately with the expression levels determined by Ohtsuki et al. (2012). Transporters were determined in a concentration range of 0.1–0.9 fmol/µg. Comparison of transporter expression levels in the liver tissue confirmed that SLC22A9 and SLC22A1 had the highest expression (Ohtsuki et al., 2012; Schaefer et al., 2012).

Tissue studies. Quantification of P450 enzymes and transporters in human liver tissues of 15 liver samples (set B). Results are depicted as a box blot (box: 25th, 75th percentile, whiskers: 5th–95th percentile; all values are depicted as dots; minimal and maximal values are indicated as X, technical replicates: n = 3).
Genotype versus Protein Expression of CYP2C19, CYP2D6, and CYP3A5.
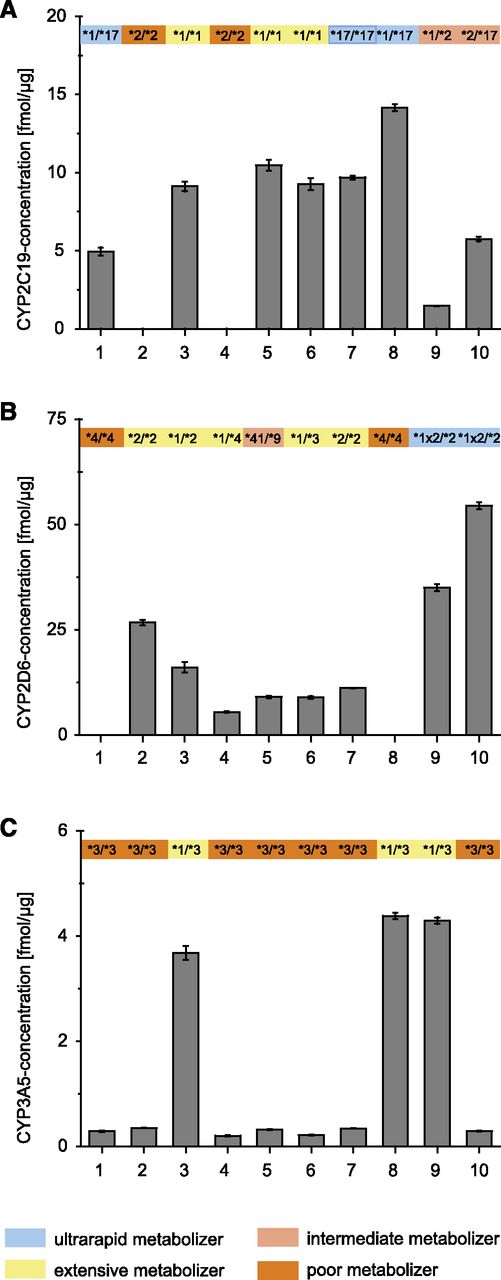
Ten liver samples were selected according to available genotype data for the polymorphic enzymes CYP2C19, CYP2D6, and CYP3A5. The protein expression levels were generally in line with the corresponding P450 genotype. For instance, no (or very low) enzyme expression was observed for carriers of the homozygous poor metabolizer genotypes CYP2C19*2/*2 and CYP2D6*4/*4, both of which lead to absence of liver-expressed protein due to erroneous splicing (Zanger and Schwab, 2013). In contrast, in a carrier of the CYP2D6 duplication (*1x2/*2) protein levels were increased (Fig. 8). Similar results had been observed by Langenfeld et al. (2009) in a previous MS analysis of CYP2D6. Conversely, an approximately 10-fold increase in CYP3A5 protein level was observed in three liver donors with the genotype *1/*3 compared with the more frequent poor metabolizer genotype (*3/*3). The gene product of the CYP3A5*3 allele is a nonfunctional shortened protein, also due to erroneous splicing missing the target peptide sequence LPNK, whereas the reference *1 allele encodes functional protein (Lamba et al., 2012).

Quantification of CYP2C19 (A), CYP2D6 (B), and CYP3A5 (C) with reference to the donor’s genotype. Ten Liver tissues selected according to previously determined relevant genotypes were analyzed with the direct quantification strategy from tissue (set A). Mean and S.D. are given (technical replicates: n = 3).
Expression Induction Study.
The applicability of the MS-based immunoassay method in protein induction experiments was tested with the typical standard inducers rifampicin, phenobarbital, and omeprazole in 96-well cell culture experiments (Chu et al., 2009). When comparing enzyme expression levels after adhesion phase (T0) and 72-hour cultivation, we observed cultivation effects on protein levels due to dedifferentiation effects. For CYP1A2, CYP2C18, CYP3A4, and ABCB1, 1.2- to 3.2-fold increased amounts were observed, whereas CYP2B6, CYP2C8, CYP2C9, CYP2D6, CYP2E1, CYP3A5, and POR showed 0.2- to 0.7-fold decreased concentration levels after 72-hour cultivation (Fig. 9; Supplemental Fig. 4). The expression levels of CYP2A13, CYP2C19, CYP2F1, and CYP3A7 were lower than the LLOQ of the established assays (data not shown). Since dedifferentiation effects with influence on the expression of the P450 system are often observed after cultivating hepatocytes over longer time spans (Baker et al., 2001; Hengstler et al., 2009), these effects were taken into account by doing a time course experiment. Cells were seeded and harvested at the same time, but treatment was started at different time points. Standard inducers were applied to the cell culture media 72, 48, 24, and 0 hours prior to harvesting.

Induction studies. Induction qualified human cryopreserved hepatocytes were cultivated in 96-well plates. Cells were seeded at the same time and treated with rifampicin (10 µM), phenobarbital (3 mM), and omeprazole for 72, 48, 24, and 0 hours prior to harvesting. The P450 enzymes CYP1A2, CYP2B6, CYP2C8, CYP2C9, and CYP3A4 were quantified using MS-based immunoassays (biologic replicates, n = 3) (A–E). The protein expression after cultivating cells for 72 hours using maintenance medium without dimethylsulfoxide was used as the initial point of the visualization (T72, treatment duration: 0 hour). Dedifferentiation effects on the expression of the P450 system were observed by comparing basal enzyme levels after adhesion phase (T0), with expression rates after the whole cultivation time (T72) (F–J).
Treatment of hepatocytes with the known inducers rifampicin, phenobarbital, and omeprazole led, as expected, to differential increases of P450 proteins. These compounds are known to affect P450 expression mainly via the receptor pathways of the constitutive androstane receptor, pregnane X receptor, and aryl-hydrocarbon receptor. Omeprazole treatment induced CYP1A2 by a factor of 11. CYP2B6 was only slightly induced by a factor of 2.4, although the CYP2B6 level was increased by all three compounds. The treatment with phenobarbital showed 5.2-fold CYP2B6 induction after 48 hours. Rifampicin induced CYP2B6 by a factor of 3.2, and omeprazole induced CYP2B6 by a factor of 1.9. The expression of CYP3A4/3A43 and CYP2C8 is inducible via the pregnane X receptor, and here maximal induction was observed under rifampicin treatment after 48 hours. Rifampicin induced a 4.6-fold expression of CYP2C8. Based on a basal concentration of 2.6 fmol/µg, CYP3A4 was induced 19-fold to 50.5 fmol/µg.
Discussion
We developed and validated 24 MS-based immunoassays, which allow the quantification of P450 enzymes and transporters without the need for prefractionation procedures such as microsomal preparation by ultracentrifugation. Even low expressed P450s, e.g., CYP1A1, could be directly analyzed in tissue and cell cultures. The assays are suitable for conducting protein induction studies to complement mRNA and activity data. In our procedure the application of multispecific TXP antibodies directed against small C-terminal peptide sequences facilitates the simultaneous enrichment of several analytes (Weiß et al., 2014, 2015). The confirmed recognition of short peptide sequences supports the suitability of the TXP strategy for addressing homologous protein families and underlines its generic applicability. Finally, multiplexing of several TXP antibodies enables the specific, fast, and extensive quantification of a multitude of peptides.
The generation of the 13 group-specific antibodies was performed as published previously (Hoeppe et al., 2010). The in-depth analysis of the antibodies’ epitopes revealed epitope motifs similar to the antigen used for antibody generation. In six out of 12 cases the epitope contained one variable position, in three cases we observed two variable positions, and in one case we observed three variable positions. In just one case—the PSSK antigen—we observed cross reactivity based on four varying amino acids. However, the PSSK sequence was still overrepresented in the motif (>60%). All of the generated antibodies could be used to set up quantitative assays for the targeted P450 enzymes and transporters. The most valuable antibody in terms of multi-usability was the anti-FSGR antibody. The antibody could be applied to assay development of five enzymes: CYP2B6, CYP2C8, CYP2C18, CYP2E1, and CYP2F1. However, the initial selection of suitable proteotypic peptide sequences also plays a major role for the development of MS-based immunoassays. The use of concatamers—artificial proteins comprising sequentially arranged peptides from proteins of interest—can potentially improve the presented assay accuracy since endogenous and reference target peptides are simultaneously released by enzymatic digestion (Beynon et al., 2005; Achour et al., 2014). However, it has to be ensured that the release of both peptide variants from endogenous and artificial protein (concatamer) is comparable. As for all MS-based peptide-centric quantification methods, peptide properties such as hydrophobicity, length, ionization potential, and/or a potential delayed release during protein digestion influence the peptide availability, and therefore the sensitivity of the following analysis steps. As observed during assay development, the sensitivities and linear range of the developed tests differed due to peptide properties. For example, assay performance using the peptides GTTLITNLSSVLK (CYP2D6) and DIEINGVFIPK (CYP3A43) exhibited a linear range of just one order of magnitude, while most of the developed assays showed linear qualities of at least three dimensions. Therefore, the selection of peptides has a big impact on the sensitivity and linearity of the assays. However, the observed values for all proteins of interest were within the dynamic ranges of the developed assays.
The reference analysis of commercially available recombinant proteins regarding the question of the assay’s accuracy revealed differences between the information given by the manufacturer and our analysis. In most cases the MS-based quantification resulted in higher P450 content than stated by the manufacturer. Although the measured values were mostly 1.2- to 2-fold higher, the largest discrepancy was observed for CYP1A1, where a 10-fold higher content was measured. The discrepancies could be due to the different analytical approaches. On one hand, the enzymes have been quantified by the manufacturer using UV-spectral analysis of the heme group, determining the functional portion (holo-protein) of the expressed protein. The method described herein uses a MS readout measuring the total expressed protein including the apo-protein (no heme). Hence, this could be an explanation for the deviation between the two results. This should be also taken into account if peptide-based quantifications of P450s are compared with enzyme activities.
Subcellular fractionation is often required to reduce complexity and to enrich targets prior to protein quantification. Unfortunately, subcellular fractionation generally results in incomplete protein yields (Wegler et al., 2017). In this work, we provide a solution to this problem. We demonstrated that the direct quantification of P450 enzymes and POR from tissue extract highly correlates with data generated by analysis of the corresponding microsomal preparation. Thus, our test system represents the possibility of avoiding the extensive and time-consuming procedure of preparing microsomal fractions that are susceptible to errors due to many processing steps. However, the observed average enrichment factor for P450s in the microsomal preparation was about 3-fold. Taking this into account, our results were in line with previous studies from others using microsomal preparation prior to nano-LC MS readout (Kawakami et al., 2011; Ohtsuki et al., 2012; Schaefer et al., 2012). We observed high amounts of P450 proteins in the crude membrane/nuclei fraction, suggesting that a certain amount of the P450 containing endoplasmatic reticulum membranes are lost within the first steps during microsomal preparation. However, this preparation procedure is an established and optimized method to get pure microsomal preparations. On the other hand, the amount of transporters in these membrane/nuclei enriched fractions was higher compared with other fractions.
We confirmed the reproducibility of our assays by determination of intra- and interassay performance. Three different liver tissues, which comprised a wide concentration range of the analyzed proteins, were used for this analysis. With regard to the P450 enzyme and transporter levels, we demonstrated that liver tissues could be studied in a very robust and sensitive way. Hence, we have validated the assay panel fit for purpose, which can be used to address academic questions. In an industrial/pharmaceutical setting the assay requires more extensive validation, including quality controls, external calibration curves, determination of sample and reagent stability, etc.
Furthermore, we were able to clearly differentiate between different functional and clinically relevant genotypes of CYP2C19, CYP2D6, and CYP3A5 at the protein level. The different metabolizer phenotypes (poor, intermediate, extensive, and ultrarapid) were also reflected by the concentration of the respective P450 enzymes. Since we analyzed only a very low number of selected samples with respect to genotype, these findings have to be confirmed in a larger cohort of samples.
Finally, the assay system was also proven for the analysis of induction studies performed in 96-well plate cultures using cryopreserved hepatocytes. Actually, the results confirmed transactivation processes after administering the pregnane X receptor/inducer rifampicin and the constitutive androstane receptor/inducer phenobarbital. The observed effects resulted from heterodimerization of the nuclear receptors with the retinoid X receptor and the consequential activation of the CYP2B, CYP2C, and CYP3A isoforms (Xie et al., 2000; Gerbal-Chaloin et al., 2001, 2002; Ferguson et al., 2002, 2005; Luo et al., 2002; Chen et al., 2004).
In summary, we have developed a multiplex assay system capable of detecting relevant drug metabolizing P450s, POR, and transporters in tissue and primary cell cultures. The enzymes and transporters can be measured directly from crude cell lysates since the rapid immunoprecipitation replaces the microsomal preparation step. Since primary human hepatocytes have to be isolated during surgery, and thus are very precious and rarely available, the new assay platform supports their efficient use in the 96-well plate format. Therefore, P450-protein analysis could be established in future workflows of drug-drug interaction studies and complement mRNA and enzyme activity data.
Authorship Contributions
Participated in research design: Weiß, Hammer, Poetz, Klein, Zanger, Artursson, Wegler.
Conducted experiments: Weiß, Hammer, Klein, Norén.
Performed data analysis: Weiß, Hammer, Planatscher.
Wrote or contributed to the writing of the manuscript: Weiß, Poetz, Klein, Zanger, Artursson, Wegler, Hammer, Joos.
Footnotes
- Received September 19, 2017.
- Accepted January 10, 2018.
T.O.J., O.P., F.W., and H.S.H. were funded by the German Federal Ministry of Education and Research Grant FKZ 0315742 (Virtual Liver) and Grant FKZ 031A142 (GO-Bio). P.A. and C.W. are supported by the Swedish Research Council [Approval Numbers 2822 and 5715]. K.K. and U.M.Z. were supported by the Robert Bosch Foundation, Stuttgart, Germany.
↵
 This article has supplemental material available at dmd.aspetjournals.org.

Abbreviations
- FA
- formic acid
- LC
- liquid chromatography
- LLOQ
- lower limit of quantification
- LLOD
- lower limit of detection
- MS
- mass spectrometry
- PMSF
- phenylmethylsulfonyl fluoride
- POR
- cytochrome P450 oxidoreductase
- P450
- cytochrome P450
- RSLC
- rapid separation liquid chromatography
- TCEP
- tris(2-carboxyethyl phosphine)
- TXP
- triple X proteomics
- Copyright © 2018 The Author(s).
This is an open access article distributed under the CC BY Attribution 4.0 International license.


