


Abstract
To identify aldehyde oxidase (AO) substrates, an assay procedure was developed that leverages the capabilities of high-resolution mass spectrometry to simultaneously monitor parent loss and formation of hydroxylated metabolite over time in incubations with liver cytosol. By incorporating metabolite monitoring, false positives resulting from metabolism by other cytosolic enzymes or processes were decreased. A diverse set of 34 kinase inhibitors containing AO-substrate motifs was screened, and 35% of the compounds were identified as human AO substrates. Confirmation was obtained through determination of the site of metabolism. Human AO substrates identified contained unsubstituted diazanaphthalene moieties (A77-01, INCB 28060, ML-347, LDN-193189, and SB-525334), 4-aminoquinazoline cores (lapatinib, lapatinib M1, and CL-387785), and terminal pyridine and pyrimidine groups (imatinib, bafetinib, and AMG 900). Rat and cynomolgus monkey AO displayed substrate specificities that overlapped moderately with human; rates of metabolism were often higher and lower for cynomolgus monkey and rat, respectively, compared with human. A subset of novel AO substrates identified in this study was also subjected to two other methods for AO substrate determination: comparison of human liver microsome and hepatocyte stability, and the effect of hydralazine, an AO-specific inhibitor, on hepatocyte stability. These methods appeared to correlate and be capable of identifying AO substrates when more than one-third of metabolism in hepatocytes was AO-mediated; however, significant limitations exist. Considering the sensitivity, efficiency, and definitiveness of the cytosol assay with metabolite monitoring, its use is recommended as a primary screen for AO substrates.
Introduction
Aldehyde oxidase (AO) is a cytosolic enzyme that is capable of catalyzing the oxidation of aromatic aldehydes and nitrogen-containing heterocycles (Garattini et al., 2003). AO is expressed in nearly all animal species, with hepatic expression predominating in most mammals (dogs and cats being notable exceptions, Garattini et al., 2003; Dick et al., 2005). AO utilizes a molybdopterin cofactor (Moco) to transfer oxygen from water to the oxidized substrate. The Moco-containing active site of AO allows for oxidation of a wide variety of substrates. A diverse set of known azaheterocyclic AO-substrate motifs has been identified that are highly represented in collections of drug-like compounds, especially kinase inhibitors. Pryde et al. (2010) have estimated that roughly 56% of a proprietary Pfizer collection of kinase-targeted compounds contain potential AO substrate motifs; however, on the basis the prevalence of reports of AO substrates in the literature, it is improbable that AO oxidation represents a significant metabolic pathway for a majority of these compounds. As advances occur in predicting cytochrome P450 (P450)-mediated metabolism, it is thought that the proportion of compounds cleared by non-P450 pathways, including AO oxidation, will increase (Hutzler et al., 2013).
Because AO is a cytosolic enzyme that is capable of robust metabolic rates (Zientek et al., 2010), it is important to know early in the drug discovery process whether to rely on liver microsome or hepatocyte stability data for determination of structure-activity relationships and clearance predictions. Several reports pertaining to the failure of AO substrates in the clinic exist and are the result of the underprediction of clearance using microsomal stability data (Kaye et al., 1984; Dittrich et al., 2002; Dalvie et al., 2010; Akabane et al., 2011). Additionally, because the dog, a commonly used species in drug research, does not express significant levels of AO, early identification of an AO substrate can influence human pharmacokinetic prediction strategies and selection of species for toxicology studies.
Currently it is difficult to predict whether a compound that contains an AO-substrate motif will be an AO substrate. Rates of substrate metabolism do not appear to correlate with any obvious physiochemical properties (Pryde et al., 2010). An in silico model had been proposed (Jones and Korzekwa, 2013), but with a limited training set it was unable to predict substrates versus nonsubstrates (Xu et al., 2017). Identification of AO substrates empirically can also be challenging. Suggested paradigms rely initially on the observation of a difference in intrinsic clearance (CLint) measurements between liver microsomes fortified with NADPH cofactor (focusing on common non-AO metabolism) and hepatocytes. This approach should theoretically work, since AO is a cytosolic enzyme and is absent from the microsomal fraction; however, the approach contains several caveats. A difference in CLint between the two assays would flag substrates of all drug-metabolizing enzymes other than NADPH-dependent microsomal enzymes (P450s, flavin monooxygenases, and carbonyl reductase) as potential AO substrates. Further work would be required to confirm AO metabolism and, considering the prevalence of processes such as glucuronidation, the number of false positives could be sizable. Additionally, in many drug discovery paradigms, both hepatocyte and liver microsome stability assays are not routinely run. If both assays are employed, considering the variability inherent in each CLint measurement, determination of the significance of the difference between the two results can be difficult. Many AO substrates are also substrates of other drug-metabolizing enzymes, such as P450s, and as such may not demonstrate a clear difference in hepatocyte and microsomal CLint. Finally, during the discovery process as the compounds transition to higher metabolic stability, differences in slow metabolic turnover between microsome and hepatocyte assays can approach substrate-loss sensitivity limits. These scenarios are explored in further depth in this manuscript.
Here I propose a liver cytosol-based assay to identify AO substrates that utilizes the capability of accurate mass liquid chromatography–mass spectrometry (LC-MS) quantitation to measure both parent loss and hydroxylated metabolite formation in the same data set. Since there are few other oxidases found in the liver cytosolic fraction, this assay is definitive. Additionally, owing to its simplicity, it is amenable to performance on a high-throughput scale. I have used this assay to screen a diverse set of commercially available kinase inhibitors that contain AO substrate motifs and find that roughly one-third are novel AO substrates. The sites of AO metabolism were subsequently determined using accurate mass liquid chromatography–multistage mass spectrometry (LC-MSn). Together these data should influence the paradigm for the identification of AO substrates and eventually provide an expanded training set for further development of in silico models.
Materials and Methods
Materials.
Male rat and cynomolgus monkey liver cytosol as well as mixed gender 150-donor UltraPool human liver cytosol and microsomes were obtained from Corning Life Sciences (Oneonta, NY). Cryopreserved 50-Donor LiverPool mixed gender human hepatocytes were obtained from BioreclamationIVT (Westbury, NY). Unless noted otherwise, all compounds were purchased from Cayman Chemicals (Ann Arbor, MI). Lapatinib M1 was purchased from Toronto Research Chemicals (North York, ON, Canada), and carbazeran, O6-benzylguanine, XK469, 4-aminobiphenyl, dapsone, clopidogrel, oseltamivir, enalapril, and fenofibrate were obtained from MilliporeSigma (St. Louis, MO).
Cytosolic AO Substrate Assay.
Cytosolic incubations were carried out in deep-well 96-well plates as described previously (Zientek et al., 2010) with modifications. Briefly, reaction mixtures were created that contained rat, cynomolgus monkey, or human liver cytosol (2 mg/ml final protein concentration), 2 mM MgCl2, and 100 mM potassium phosphate buffer, pH 7.4. Reaction mixtures were aliquoted into four deep-well 96-well plates (one plate per time point) so that each substrate could be analyzed in duplicate. Substrates were dissolved in dimethyl sulfoxide (DMSO)/water (1:9) at a concentration of 10 μM. Reactions were initiated by the addition of substrate solution (1 μM final concentration) to the prewarmed (37°C) cytosol mixture. The final DMSO concentration used in the assay was 1% (v/v), which was found to not to inhibit AO metabolism of probe substrates (see Results). Following incubation in a 37°C water bath, reactions were typically quenched via the addition of two volumes of acetonitrile containing 0.2% formic acid and 500 nM labetalol as an internal standard. This quench solution was typically added to a full plate at 0, 10, 75, and 160 minutes, after which samples were vortexed and centrifuged in a Beckman Allegra 15R centrifuge for 10 minutes at 3500 × g and 4°C. A 50-μl aliquot of supernatant was then transferred to a fresh plate, diluted with 150 μl of water, and subjected to analysis by ultra high-pressure liquid chromatography with high resolution mass detection. The system used consisted of a Q-Exactive mass spectrometer coupled to a Transcend LX-2 multiplex LC system (Thermo Fisher Scientific, San Jose, CA). The Q-Exactive was operated in positive-ionization mode collecting full-scan data from 100 to 1400 m/z with a resolution of 70,000 full width at half maximum (FWHM). A heated electrospray source was used with the following parameters: sheath and auxiliary gas flow rates of 40 and 10, respectively; spray voltage of 3.5 kV; and capillary temperature of 320°C. In most instances, a Hypersil Gold C18, 1.9 μm, 2.1 × 50 mm reverse phase column (Thermo Fisher Scientific) was used at ambient temperature with A and B mobile phases consisting of 0.1% (v/v) formic acid in water and acetonitrile, respectively. A flow rate of 0.5 ml/min was used with a gradient consisting of an initial hold at 95% A for 20 seconds, followed by a 90-second linear ramp to 5% A, a 60-second hold at 5% A, a step to 95% A, and a 70-second equilibration at 95% A. Flow from the column was diverted to the mass spectrometer for 150 seconds following a diversion to waste for 48 seconds. Analytes (parent and proposed hydroxylated metabolites) were detected using nominal exact masses with a mass tolerance of 5 ppm. The peak area ratio (PAR) of the analyte to that of the internal standard was used for quantification in GMSU software (Gubbs, Inc., Alpharetta, GA). In each data set, loss of parent compound and formation of hydroxylated metabolite were monitored simultaneously. Half-lives of parent compounds were calculated using linear regression of log-transformed percent-remaining over time, which generally displayed R2 values greater than 0.9. Estimates of the relative abundance of AO metabolite formation at each time point were determined by dividing the metabolite PAR by the PAR of parent at 0 minutes. A compound was generally considered an AO substrate if it demonstrated a half-life of less than 500 minutes (extrapolation on the basis of 20% accuracy in parent compound measurement with a 160-minute incubation) and significant time-dependent hydroxylated metabolite formation.
AO Metabolite Identification.
Substrates in the initial screen were subjected to further analysis to determine the site of metabolism by human AO. Larger scale (1 ml) reactions, similar to those mentioned above, were initiated via the addition of 20 μM substrate and quenched with a 2-fold volume of acetonitrile at 0 and 180 minutes. Samples were processed in a similar manner and subjected to analysis on a Thermo Fisher Scientific Orbitrap Elite LC-MSn system. The system consisted of a CTC-PAL autosampler, Agilent 1290 binary ultra-high pressure liquid chromatography, and Agilent 1290 diode array detector. The Orbitrap Elite was operated in positive ion mode with a heated electrospray source set to the following parameters: sheath, auxiliary, and sweep gas flow rates of 35, 10, and 5 respectively; spray voltage of 4.2 kV; and capillary temperature of 350°C. Full scan and data dependent tandem mass spectrometry and MSn spectra were collected with resolutions of 60,000 and 15,000 FWHM, respectively. A Waters Acquity BEH C18, 1.7 μm, 2.1 × 100 mm reverse phase column was used at 40°C with A and B mobile phases consisting of 0.1% formic acid in water and acetonitrile, respectively. A flow rate of 0.3 ml/min was used with a gradient consisting of an initial hold at 95% A for 2 minutes, followed by an 18-minute linear ramp to 15% A, a 3-minute hold at 15% A, a step to 95% A and a 6.5-minute equilibration at 95% A.
Microsomal and Hepatocyte Stability Assays.
For determination of compound stability following incubation with human liver microsomes (HLM), reaction mixtures were constructed that contained: 1 mg HLM protein/ml, 1 μM compound, 2 mM MgCl2, and 100 mM potassium phosphate buffer, pH 7.4. Compounds were dissolved in acetonitrile/water (1:1) and the final concentration of acetonitrile in the assay was 0.25%. Duplicate reactions were initiated by the addition of NADPH (1 mM final concentration) and incubated in a 37°C water bath. They were quenched at 0, 5, 10, 25, 45, and 60 minutes, processed and analyzed by LC-MS in a manner identical to the cytosolic stability assay samples above. Cryopreserved hepatocytes (BioreclamationIVT) were thawed according to the protocol provided by the manufacturer and resuspended in Krebs-Henseleit buffer at a concentration of 1 million cells/ml. Duplicate 500-μl incubations were performed with 0.5-μM compound, with and without the inclusion of 50 μM hydralazine, a selective AO inhibitor. Hydralazine was dissolved in water and substrates in acetonitrile/water (1:1); the final concentration of acetonitrile in the assay was 0.2%. Incubations were allowed to proceed with gentle rocking in a 37°C cell culture incubator with a 5% carbon dioxide/95% air atmosphere and saturating humidity. Aliquots were taken from each well at 0, 75, 110, 180, and 250 minutes, quenched, processed, and analyzed in a manner identical to the microsomes. Midazolam and zoniporide were used in each assay as CYP3A and AO positive controls, respectively.
Results
Characteristics of AO Assay
Well known AO substrates, O6-benzylguanine and zoniporide, were used to determine parameters used for the liver cytosol assay. Loss of both compounds was log-linear for incubation times up to 6 hours, the longest incubation time tested, indicating robust and stable enzyme activity for extended periods of time (Fig. 1, A and B). Elimination rates were linear with respect to cytosolic protein concentrations in the 0.5–2 mg/ml range. Formation of hydroxylated metabolites was also monitored using the calculated exact mass of each metabolite (Fig. 1, C and D), and an estimate of metabolite abundance at each time point was calculated from the ratio of the metabolite PAR over the parent PAR at 0 minutes. Although formation of metabolite determined in this semiquantitative manner roughly matched the parent loss for zoniporide, this was not the case for O6-benzylguanine from which metabolite formation appeared to be approximately 2-fold lower. Authentic metabolite standards were used to confirm that this difference resulted from the differential response of 8-oxo-benzylguanine and O6-benzylguanine in the mass spectrometer; equimolar 2-oxo-zoniporide and zoniporide solutions gave equivalent PAR (data not shown). A final cytosolic protein concentration of 2 mg/ml was used with incubation times up to 160 minutes. The effect of commonly used solvents on enzyme activity was also investigated (Fig. 2). Coincubation of up to 3% DMSO, acetonitrile, and methanol had little effect on the ability of AO to catalyze 2-oxozoniporide production. Significant activity decreases were not observed until solvents reached concentrations of 10%; a final DMSO concentration of 1% was used in the cytosolic assay.

Demonstration of human liver cytosol assay performance using known AO substrates zoniporide (A and C) and O6-benzylguanine (B and D). Data for each substrate are plotted using a log-linear scale (A and B) to exhibit exponential substrate loss with respect to time and cytosolic protein concentration and a linear scale (C and D) to illustrate estimate of hydroxylated metabolite formation with respect to substrate loss. Milligram per milliliter values refer to final cytosolic protein concentrations.

Determination of the sensitivity of 2-oxozoniporide production by human AO in liver cytosol to various solvents. Zoniporide (1 μM) was incubated with 2 mg cytosolic protein per milliliter for 60 minutes.
Identification of AO Substrates
Positive and Negative Controls.
Several positive and negative controls were used to validate the performance and specificity of the AO substrate assay. O6-benzylguanine, carbazeran, VX-509, XK469, and zoniporide (Fig. 3A) have all been reported as human AO substrates (Pryde et al., 2010; Zetterberg et al., 2016). In this assay, with the exception of XK469, all positive controls displayed significant AO metabolite formation and human liver cytosol half-lives similar to those previously reported (Table 1; Zientek et al., 2010; Zetterberg et al., 2016). XK469 has been shown to be a very stable human AO substrate, and its rate of turnover appeared incompatible with the incubation times used in this assay. However, it was identified as a substrate when cynomolgus monkey and rat liver cytosol were used. A few additional species differences were observed with the positive controls: Robust AO-catalyzed turnover of O6-benzylguanine was observed with human and cynomolgus monkey but not rat; and zoniporide was metabolized by rat AO at four and 7-fold faster rates than cynomolgus monkey and human, respectively.

Compounds used to validate AO assay. Known AO substrates (A) O6-benzylguanine, carbazeran, VX-509, XK469, and zoniporide were used as positive controls. Established esterase and NAT substrates (B) were used as negative controls.
Identification of human, cynomolgus monkey, and rat AO substrates using a liver cytosol assay that incorporates monitoring loss of substrate and formation of hydroxylated metabolite
Substrates of other cytosolic hepatic drug-metabolizing enzymes, namely esterases and N-acetyltransferases (NATs), were included as negative controls for the human assay (Fig. 3B; Table 1). These control compounds do not contain AO substrate motifs and should demonstrate turnover in human liver cytosol with no hydroxylated metabolite formation. Significant turnover of carboxylesterase substrates clopidogrel, oseltamivir, enalapril, and fenofibrate (Rautio et al., 2008; Laizure et al., 2013) and NAT substrate 4-aminobiphenyl (Lower and Bryan, 1973) was indeed observed with no oxidized metabolite formation. The human liver cytosol preparation used appeared incapable of dapsone conjugation without added acetyl-CoA cofactor. Together these data suggest that the cytosol-based AO assay should be capable of differentiating AO substrates from substrates of other cytosolic enzymes.
Kinase Inhibitor Panel.
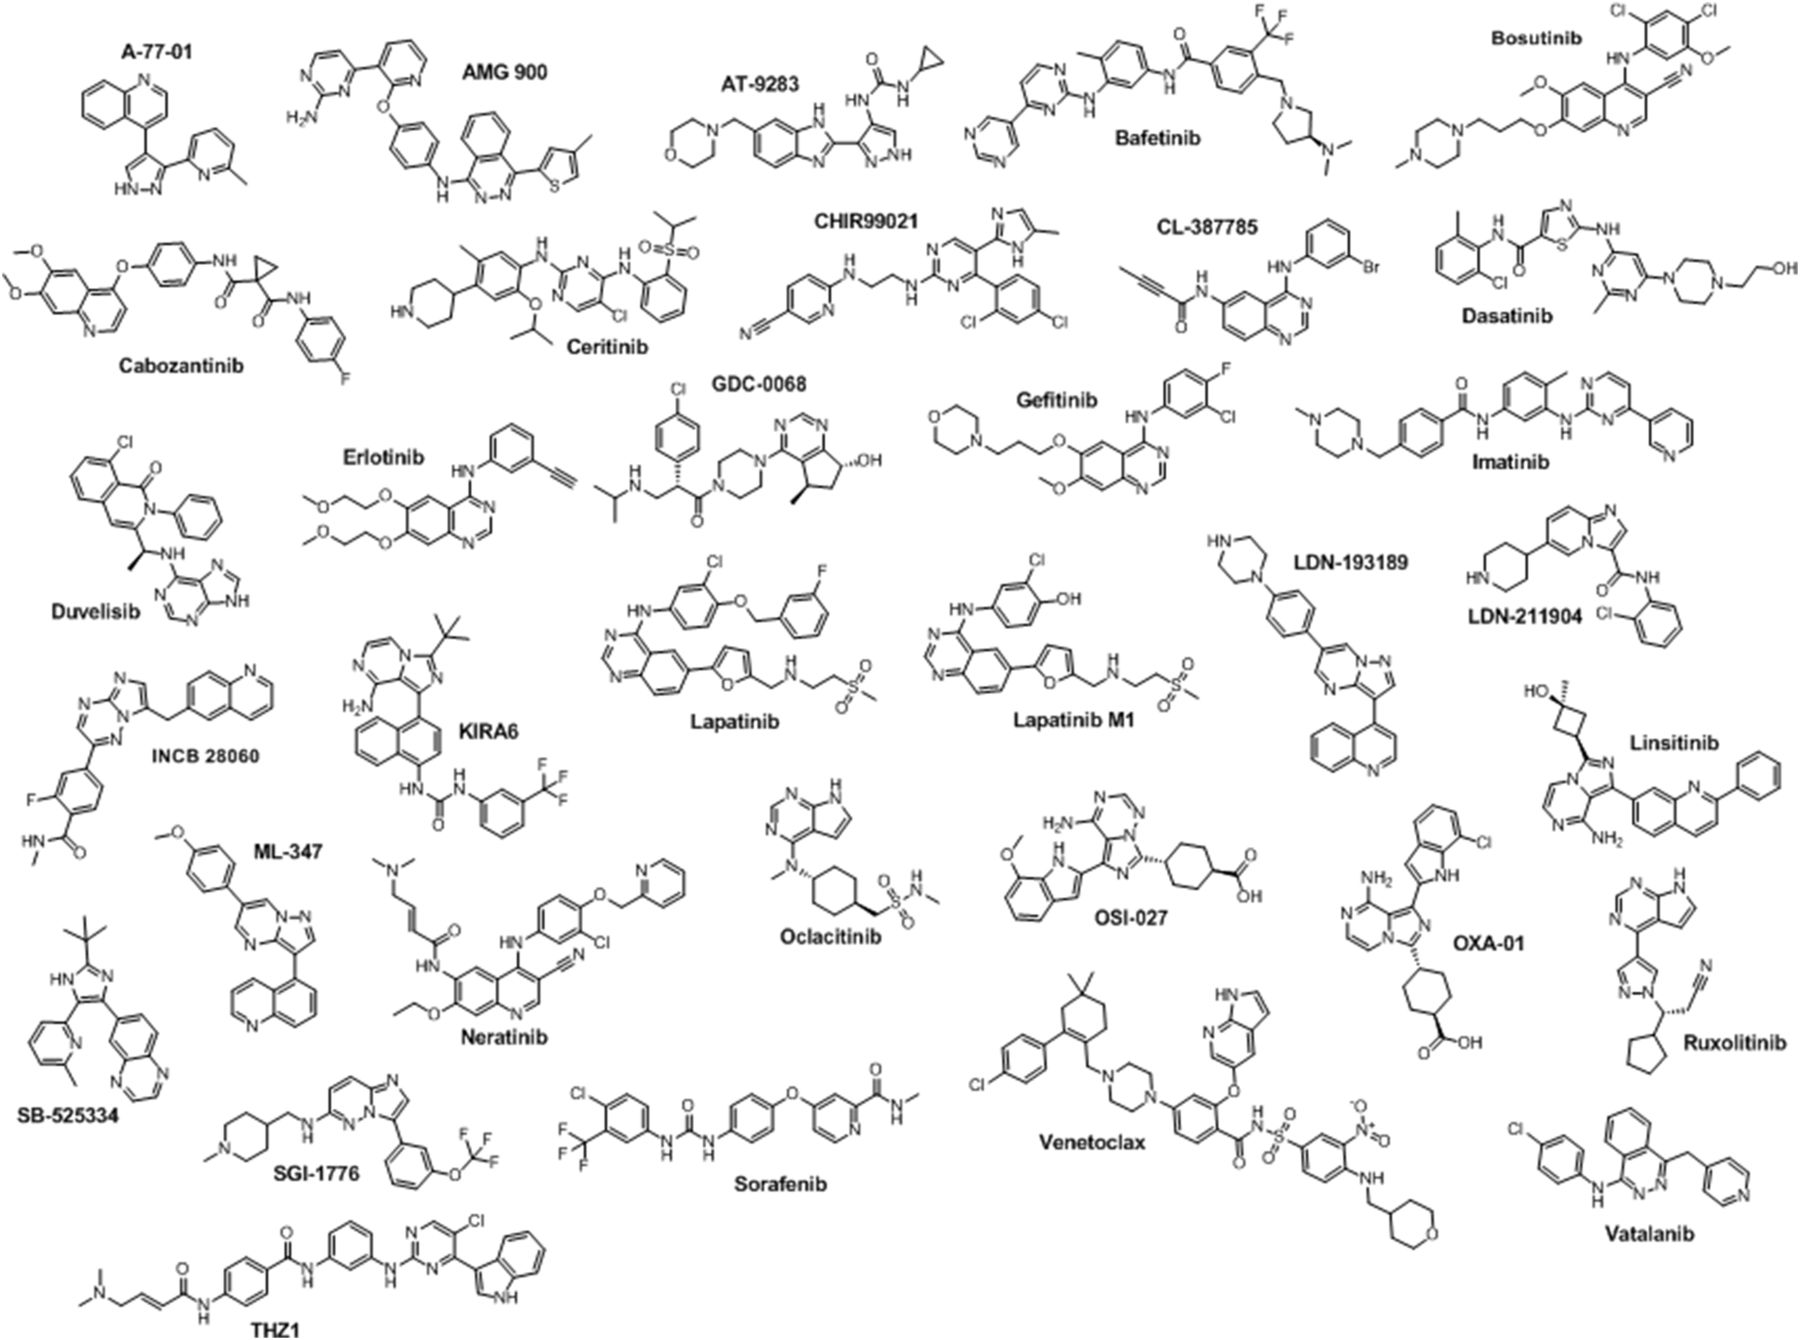
A panel of 34 randomly chosen, commercially available kinase inhibitors that contain AO substrate motifs (Fig. 4, Pryde et al., 2010) was assembled and screened using the rat, cynomolgus monkey, and human liver cytosol AO assay. To be considered a substrate a compound would need to demonstrate a half-life of less than 500 minutes and a significant amount of hydroxylated metabolite formed in a time-dependent manner. Compounds that met only one of the criteria, such as bafetinib and imatinib with human cytosol, were studied further. Of the compounds tested, 12 (35%) were identified as substrates for human AO, 12 (35%) for cynomolgus monkey AO, and 9 (26%) for rat AO (Table 1). There was a large degree of overlap in substrate specificity across species: Of the 12 human AO substrates, 9 and 10 were substrates of rat and cynomolgus monkey AO, respectively. Additionally, all rat AO substrates were also substrates for human and cynomolgus monkey AO. In general, substrates appeared to be most rapidly metabolized by the cynomolgus monkey followed by human and then rat; however, there were several exceptions. Motifs that were common across identified substrates included terminal quinolones (A-77-01, INCB28060, ML-347, and LDN-193189), quinazoline cores (CL-387785, lapatinib, and lapatinib M1), and terminal unsubstituted pyridine and pyrimidines (bafetinib and imatinib). Several related compounds containing these motifs (e.g., erlotinib, gefitinib, and vatalanib) were not substrates.

Structures of 34 kinase inhibitors screened in cytosolic AO assay.
Determination of Sites of AO Metabolism
The 12 human AO substrates were subjected to further analysis to identify the site(s) of metabolism. Substrates at a final concentration of 20 μM were incubated with human liver cytosol for 3 hours and proposed metabolite structures (Table 2) were derived from accurate mass LC-MSn spectra. The defined substrate regiospecificity that AO demonstrates for azaheterocycles (Pryde et al., 2010) was used to further refine structural assignments of metabolites.
Determination of the site of AO metabolism using high resolution mass spectrometry
Lapatinib.
Lapatinib was metabolized moderately to one metabolite, lapatinib AO-M1, by human liver cytosol (Fig. 5A; Fig. 7). This metabolite displayed a molecular ion of 597.13772 m/z, which is consistent with the addition of a single oxygen (Table 2). Fragment ions of 365.05673 and 323.05792 m/z resulted from the loss of the methylsulfonyl ethanamine and fluorobenzyl groups, and subsequent loss of atoms CNO, respectively. The later fragment indicates that the site of AO metabolism is probably on the quinazoline core with the only possible site of metabolism being the aromatic unsubstituted carbon between the two nitrogens.
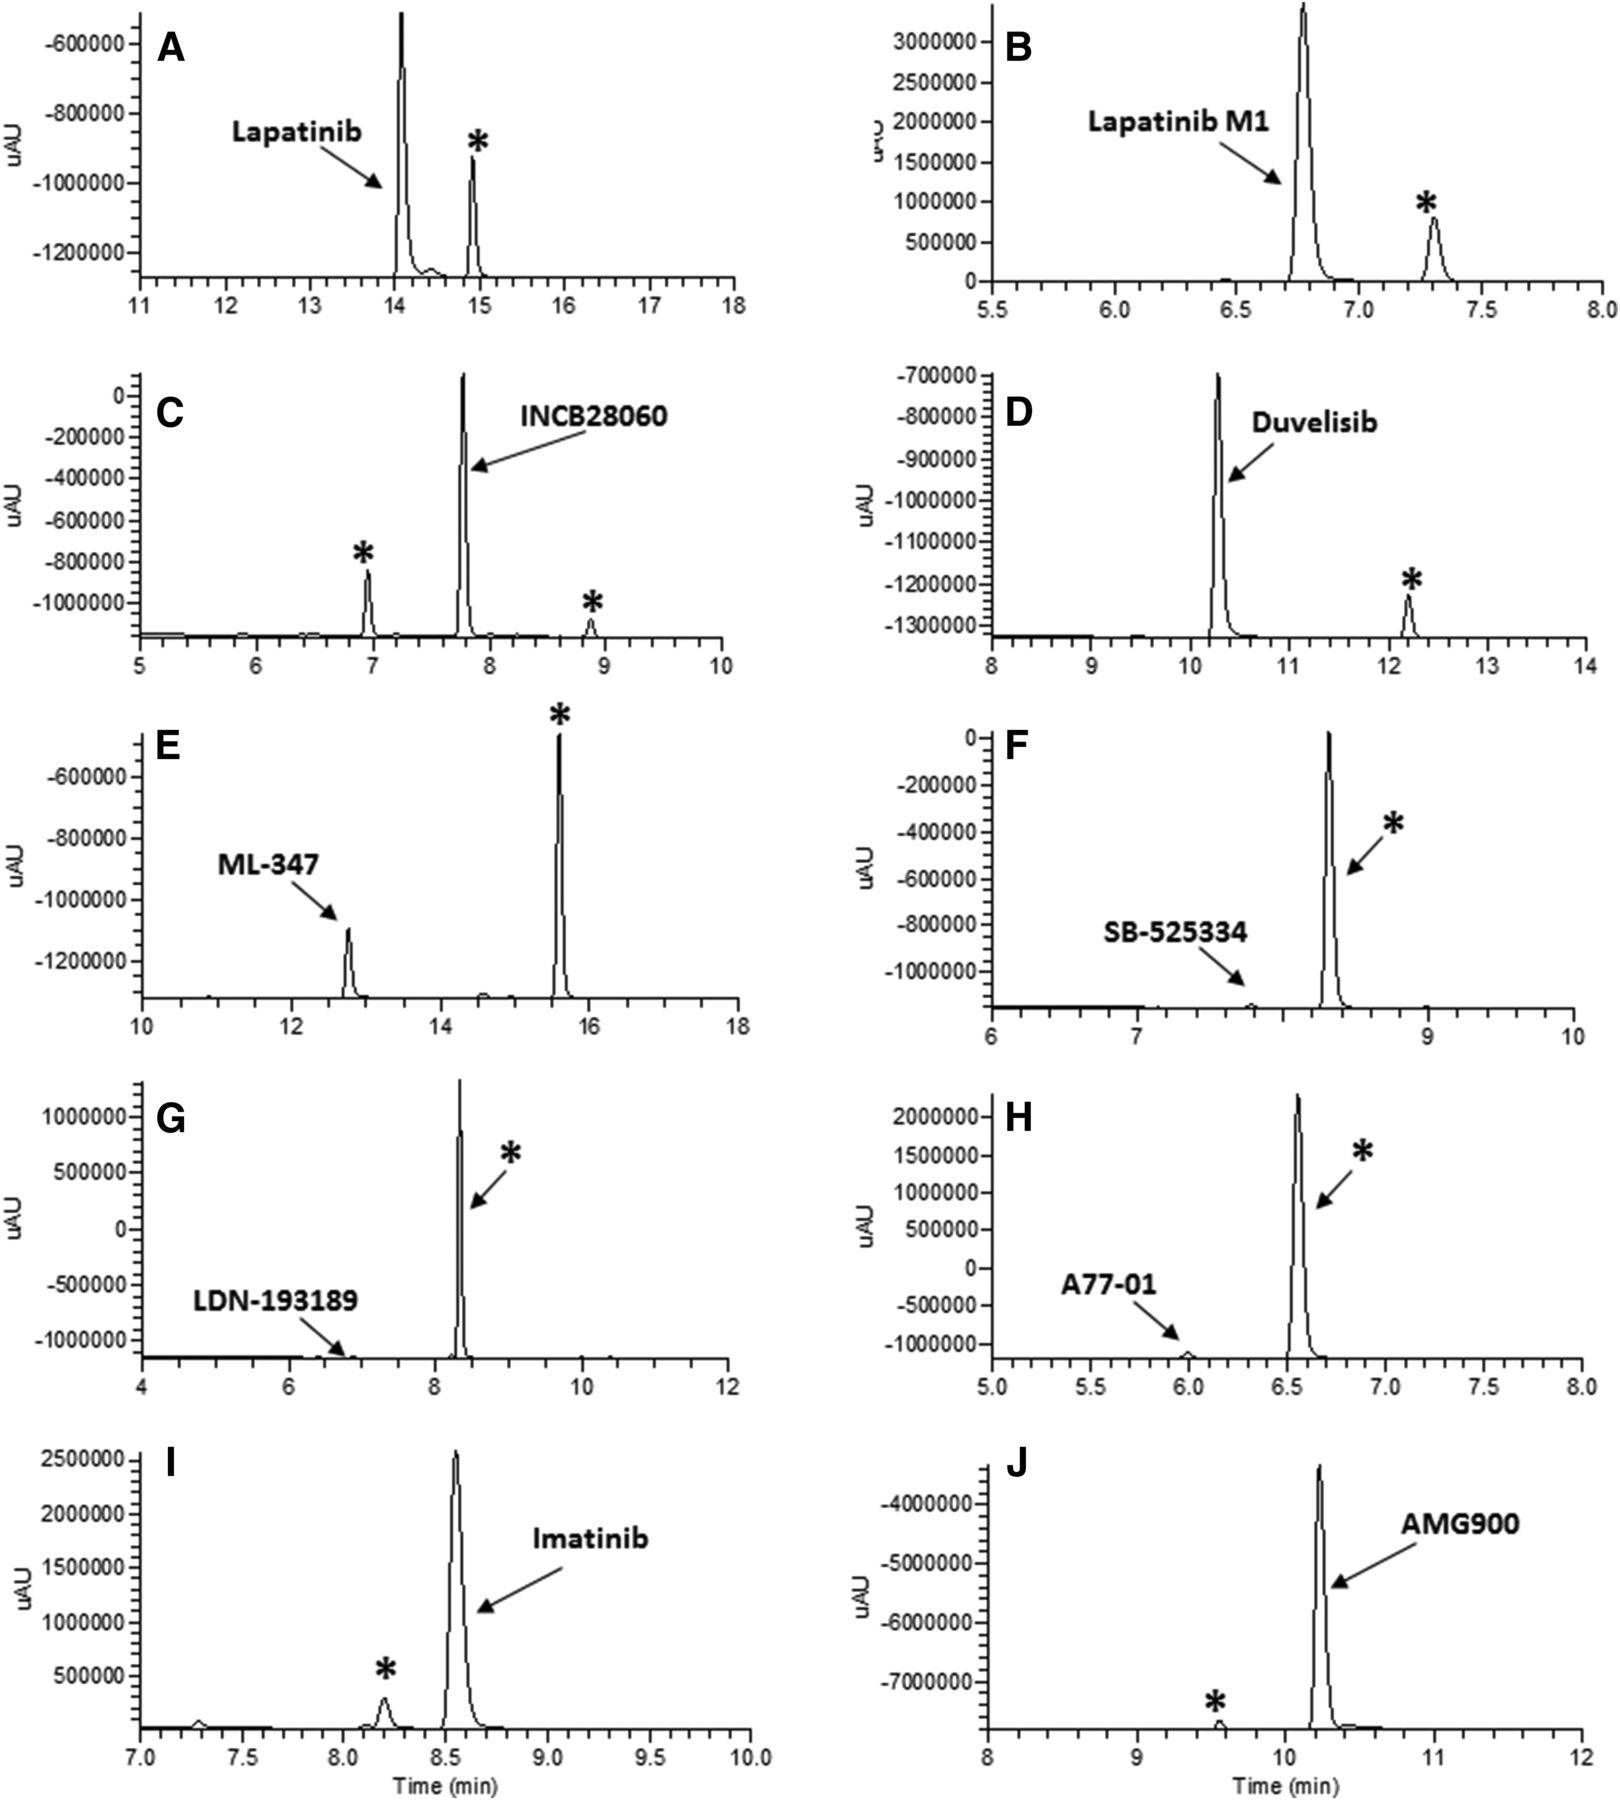
UV chromatograms for 10 novel AO substrates (A–J) generated in the process of determining the site of AO metabolism. Compounds (20 μM) were incubated with human liver cytosol for 120 minutes. In each section the parent compound is labeled by name and the AO metabolite with an asterisk (*).
Lapatinib M1.
The des-fluorobenzyl metabolite of lapatinib, M1, was a major metabolite identified in excreta from human 14C–absorption, disposition, metabolism, and excretion studies (Castellino et al., 2012). One metabolite of lapatinib M1 was observed in a human liver cytosolic incubation (Fig. 5B) and it displayed a molecular ion of 489.10093 m/z, which is consistent with the addition of a single oxygen (Table 2). In a manner similar to lapatinib AO-M1, fragmentation to produce ions of 366.06452 and 323.05792 m/z resulted from the loss of the methylsulfonyl ethanamine group and subsequent loss of atoms CNO, respectively. These data indicate that metabolism probably occurred on the quinazoline core, which is consistent with the structure reported for lapatinib M3, another major excreted metabolite of lapatinib (Castellino et al., 2012).
INCB28060.
Two metabolites of INCB28060, INCB28060 AO-M1, and INCB28060 AO-M2, were observed in a human liver cytosolic incubation (Fig. 5C). Both metabolites display molecular ions consistent with the addition of a single oxygen to the substrate (Table 2). For INCB28060 AO-M1, the fragment ion of 142.06506 m/z results from the loss of the methylquinoline moiety and demonstrates that the site of metabolism is not the quinoline. Coupled with the 251.09245 m/z fragmentation of the imidazotriazine core, these data indicate that the core is the site of metabolism with the unsubstituted carbon of the imidazole being the probable target. INCB28060 AO-M2 shares several fragment ions with AO-M1, but the 158.06006 m/z results from the same cleavage process that produces the 142.06506 m/z ion of INCB28060 AO-M1 and parent. As the AO-M2 fragment mass appears to be consistent with that of hydroxylated methylquinoline ion, the quinoline is identified as the site of metabolism.
Duvelisib.
Duvelisib was metabolized extensively to one metabolite, duvelisib AO-M1, by human liver cytosol (Fig. 5D). This metabolite displays a molecular ion of 433.11840 m/z, which is consistent with the addition of a single oxygen to parent (Table 2). The fragment ion of 152.05699 m/z indicates that site of metabolism resides on the aminopurine moiety; however, as this fragment was resistant to further cleavage, further refinement of the proposed structure with available data was not possible.
ML-347.
ML-347 was metabolized extensively to one metabolite, ML-347 AO-M1, by human liver cytosol (Fig. 5E). This metabolite displayed a molecular ion of 369.13516 m/z, which is consistent with the addition of a single oxygen to parent (Table 2). The fragment ion of 224.03090 m/z indicates that the hydroxylation occurred on the quinoline group, whereas 324.11349 m/z results from the loss of atoms CNO in a manner similar to other AO metabolites, such as lapatinib M3 and AMG900.
SB-525334.
SB-525334 was metabolized extensively to one metabolite, SB-525334 AO-M1, by human liver cytosol (Fig. 5F). This metabolite displayed a molecular ion of 360.18157 m/z, which is consistent with the addition of a single oxygen to parent (Table 2). The only unsubstituted sites for AO metabolism reside on the quinoxaline group, and the MSn fragmentation data support this assignment. The 304.11942 m/z fragment ion results from the loss of the t-butyl, whereas 276.12395 m/z is from the subsequent loss of atoms CNO. There are two possible nonequivalent sites for AO metabolism on the quinoxaline of SB-525334; however, it is probably not possible to determine which carbon is oxidized by LC-MSn.
LDN-193189.
LDN-193189 was almost completely metabolized to one metabolite, LDN-193189 AO-M1, by human liver cytosol (Fig. 5G). This metabolite displayed a molecular ion of 423.19282 m/z, which is consistent with the addition of a single oxygen to parent (Table 2). The fragment ion of 280.15577 m/z results from the loss of hydroxyquinoline and indicates that hydroxylation occurred on the quinoline and not the pyrazolopyrimidine core. Fragments of 237.07722 and 304.15576 m/z support this assignment.
A77-01.
A77-01 was almost completely metabolized to one metabolite, A77-01 AO-M1, by human liver cytosol (Fig. 5H). This metabolite displayed a molecular ion of 303.12359 m/z, which is consistent with the addition of a single oxygen to parent (Table 2). The fragment ions of 275.11767 and 260.09494 m/z result from fragmentation of the pyrazole core and indicate that metabolism did not occur on this moiety. The probable site of metabolism is the quinoline, since it contains the only other possible site.
Imatinib.
Imatinib was slowly metabolized to one metabolite, imatinib AO-M1, by human liver cytosol (Fig. 5I). This metabolite displayed a molecular ion of 510.26148 m/z, which is consistent with the addition of a single oxygen to parent (Table 2). Fragmentation of the molecule indicates that the site of metabolism probably resides on the pyridine and not the pyrimidine. The 410.16203 m/z daughter ion results from loss of the methylpiperazine, whereas the 264.11342 and 290.12875 m/z ions involve the further fragmentation of the pyrimidine. The 290.12875 m/z ion in particular demonstrates that the site of metabolism is not on the pyrimidine, since it includes the only carbon capable of being metabolized on the ring.
AMG900.
AMG900 was slowly metabolized to one metabolite, AMG900 AO-M1, by human liver cytosol (Fig. 5J). This metabolite displayed a molecular ion of 520.15406 m/z, which is consistent with the addition of a single oxygen to parent (Table 2). Fragmentation of the molecule indicates that the site of metabolism probably resides on the aminopyrimidine and not the pyridine. The fragment ion of 452.15268 m/z results from the loss of two carbons and nitrogens, as well as the AO-catalyzed oxygen, from the aminopyrimidine. The 205.07149 m/z fragment confirms that the site is on the aminopyrimide-pyridine ring system, and the 477.14780 m/z fragment results from the loss of atoms CNO in a manner similar to other AO metabolites.
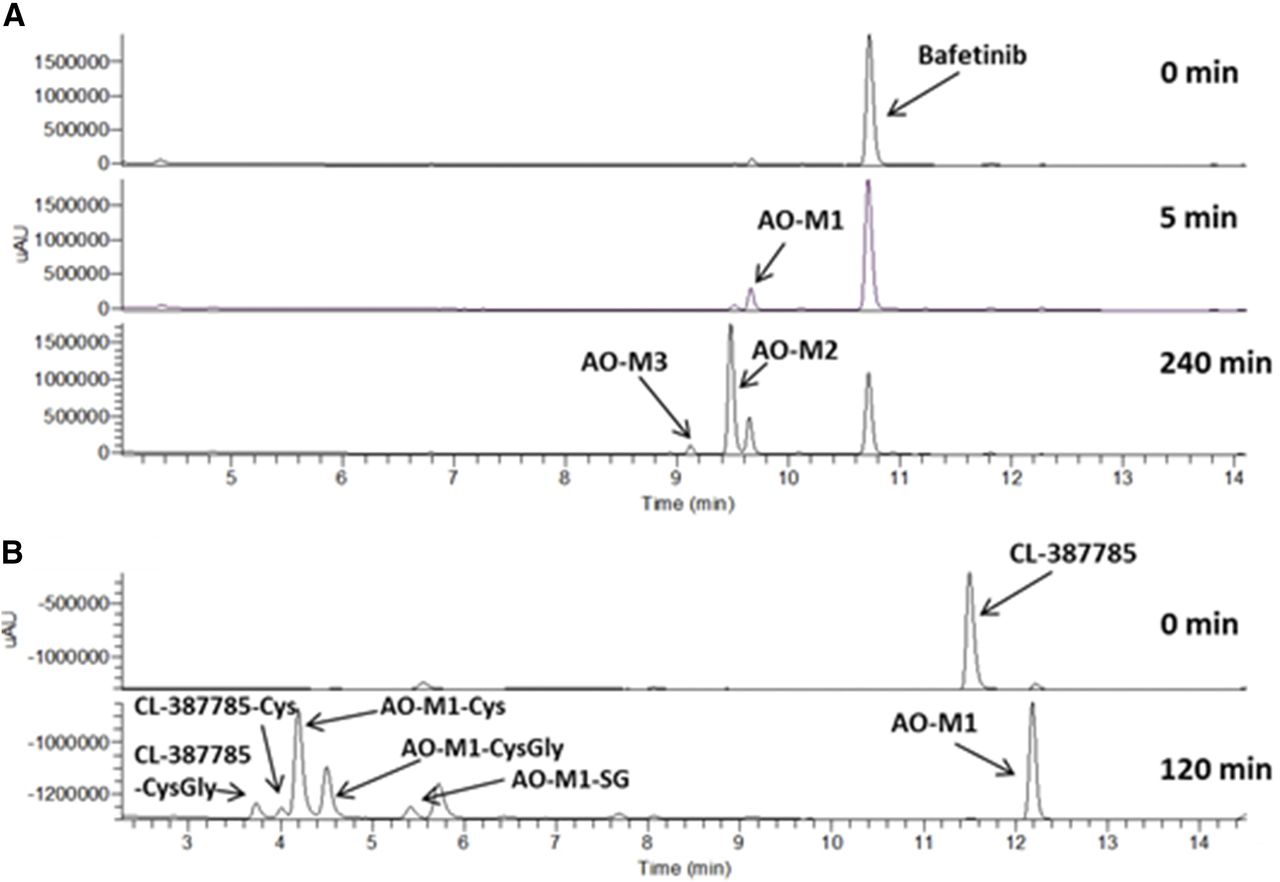
Bafetinib.
Bafetinib was extensively metabolized to three distinct metabolites, bafetinib AO-M1, AO-M2, and AO-M3 by human liver cytosol (Fig. 6A). Using varied incubation times, it appears that bafetinib AO-M1 was further metabolized to AO-M2 and then to AO-M3. The masses of the metabolites support this observation. AO-M1 demonstrated a molecular ion of 593.26139 m/z, which is consistent with the addition of a single oxygen to parent (Table 2), whereas AO-M2 and AO-M3 displayed molecular ions of 609.25641 and 625.24979 m/z, which is consistent with the addition of two and three oxygens to parent, respectively. On bafetinib, the sites of AO metabolism are located on the bipyrimidine moiety. Further resolution for AO-M1 could not be obtained owing to limited fragmentation after amide bond breakage that gives rise to the daughter ion 294.12360 m/z. The exact sites of metabolism in AO-M2 could also not be determined owing to limited fragmentation. The 521.19165 m/z daughter ion is the result of the loss of atoms CNO following loss of dimethyl amine and is similar to other AO metabolites. More clarity could be attained with bafetinib AO-M3. Following the loss of the dimethyl amine (580.192275 m/z) the 537.18671 and 494.17987 m/z fragments indicate that two of the oxidation sites are on the terminal pyrimidine. The former mass results from the loss of atoms CNO, similar to other AO metabolites; however, the latter is the product of cleavage of most of the terminal dihydroxypyrimidine via the loss of C2H2N2O2. The site of the third oxidation is not known.

UV chromatograms for bafetinib (A) and CL-387785 (B) following incubation with human liver cytosol. Five- and 240-minute chromatograms are presented for bafetinib to illustrate successive oxidation. The CL-387785 120-minute chromatogram demonstrates the propensity of both the parent and AO metabolite to react with cellular nucleophiles such as glutathione and cysteine.
CL-387785.
CL-387785 was designed as an electrophilic, reactive, irreversible inhibitor of epidermal growth factor receptor (Discafani et al., 1999). In incubations with human liver cytosol it was extensively metabolized to a single AO metabolite, CL-387785 AO-M1, in addition to glutathione, cysteinylglycine, and cysteine conjugates of CL-387785 AO-M1 and parent (Fig. 6B). CL-387785 AO-M1 displayed a molecular ion of 397.03054 m/z, which is consistent with the addition of a single oxygen to parent (Table 2). The only possible site of metabolism is the unsubstituted carbon of the quinazoline between the two nitrogens, and fragmentation of the metabolite supports this assignment. The fragment ion of 369.03494 m/z results from the loss of the added oxygen and attached carbon, whereas the 198.06644 m/z ion is derived from the subsequent cleavage of the aniline-quinazoline C-N bond. The 356.99857 m/z ion indicates that there was no addition to the reactive butynamide moiety. High resolution MSn spectra (not shown) indicate that the sulfhydryl-containing cellular nucleophiles joined to the butyne group to result in S-linked vinylic conjugates.
Evaluation of Other Methods for AO Substrate Identification
A subset of AO substrates identified in the cytosolic assay was subjected to two additional assays commonly used to identify AO substrates. Midazolam and zoniporide were included as negative and positive controls, respectively. First, the stability of compounds was measured using HLM fortified with NADPH and human hepatocytes (Table 3). It has been proposed that observing a higher intrinsic clearance in hepatocytes than in microsomes would indicate that the compound was a substrate of cytosolic enzyme(s) such as AO (Pryde et al., 2010). Of the 14 compounds tested in both assays nine displayed a significantly higher turnover in hepatocytes than microsomes. Considering 20% error in each assay, a fold difference of 1.5 would be an expected reasonable lower limit for differentiation or the highest number possible for a nonsubstrate. For a defined CLint, this number is calculated from a 20% overestimation by hepatocytes and 20% underestimate by HLM. Of the five AO substrates that were not identified using this approach, four displayed higher intrinsic clearance values with microsomes, whereas they were equivalent for lapatinib.
Comparison of metabolic stabilities of AO substrates in incubations with HLM fortified with NADPH and human hepatocytes
The second approach measures the effect on human hepatocyte stability of the AO-selective inhibitor hydralazine at 50 μM (Strelevitz et al., 2012); the percent inhibition equates to the fraction metabolized by AO (fm,AO). Of the 14 compounds identified as substrates in the cytosolic AO assay, nine displayed a significant increase in stability when hydralazine was coincubated (Table 4). With 20% error in each portion of the assay (with and without inhibitor), a minimum fm,AO of 33% would be an expected reasonable threshold for significance or the highest number possible for a nonsubstrate. For a defined t1/2, this number is calculated from a 20% overestimation in the hydralazine containing incubation and 20% underestimate in the hydralazine-deficient incubation. Twelve compounds that were identified as not being substrates of AO using the cytosolic assay were evaluated using the hydralazine inhibition approach. All nonsubstrates demonstrated fm,AO values less than 33%, with linsitinib, OSI-027, and OXA-01 yielding fm,AO values slightly lower at 28%, 26%, and 31%, respectively.
Use of 50 μM hydralazine, a specific AO inhibitor, to determine the fm,AO in human hepatocytes
Discussion
Aldehyde oxidase is a drug-metabolizing enzyme that has gained increased attention in recent years. Strategies to minimize P450-mediated metabolism often involve incorporation of azaheterocylic groups that are AO-substrate motifs. In a recent survey of compound libraries, 36% and 56% of full Pfizer and kinase-targeted collections, respectively, contained potential AO-substrate motifs (Pryde et al., 2010). It has been difficult to predict using physiochemical properties and in silico models whether containing an AO-substrate motif would translate to significant AO metabolism, so AO substrates have largely been identified empirically. Several proposed methods use data generated in a drug discovery campaign; however, they are indirect and, as will be discussed later, have limitations. The most efficient method to identify AO substrates involves measurement of substrate loss in an AO-containing matrix. Because AO is difficult to purify, native enzyme sources such as liver cytosol are often used. The disadvantage of using cytosol for AO-substrate determination is that several other enzymes (e.g., esterase and amidases, glutathione-S-transferases, sulfotransferases, aldo-keto reductases, dehydrogenase/reductase enzymes, and NATs) or processes (e.g., reactivity with cellular nucleophiles), if present, could produce false positive results. To increase the fidelity of a positive result, a modification of the assay is presented in this manuscript that leverages the capabilities of high resolution LC-MS to simultaneously monitor substrate loss and hydroxylated metabolite formation, both being considered for substrate determination. In this study, a panel of known AO-substrates demonstrated both parent loss and hydroxylated metabolite formation, whereas esterase and NAT substrates were depleted but did not produce hydroxylated metabolites.
Additionally, three irreversible kinase inhibitors (CL-387785, neratinib, and THZ1) were screened and all demonstrated parent loss; however, a hydroxylated metabolite was detected only for CL-387785. It is presumed that the loss of neratinib and THZ1 in the assay was the result of the reaction of the electrophilic moieties of these compounds with cellular nucleophiles such as glutathione.
In an effort to determine the prevalence of AO-metabolism in compounds that contain AO-substrate motifs, a diverse set of 34 randomly selected, commercially available kinase inhibitor molecules containing these motifs was screened using the modified cytosolic assay. The majority of compounds screened with human liver cytosol were not substrates for AO; positive results were obtained for roughly 35% of the set. Similar results with a high degree of overlap were obtained with cynomolgus monkey liver cytosol, confirming that human and cynomolgus monkey AO have comparable substrate specificities. Most substrates were metabolized at a higher rate by cynomolgus monkey AO compared with human. Although there was also considerable overlap with rat cytosol, rates of metabolism were often much lower.
Several trends were observed with the novel substrates identified. First, all compounds with unsubstituted quinoline groups (A-77-01, INCB28060, ML-347, and LDN-193189) were very good substrates for human AO with the quinolone group confirmed as the site of metabolism. On the basis of these and previously published results (Pryde et al., 2010), it is probable that terminal or sterically unhindered quinolones and diazanaphthalenes (SB-525334, zoniporide, and carbazeran) are preferred sites for AO metabolism. Metabolism of the 4-aminoquinazoline core, found in many marketed epidermal growth factor receptors, was also observed. CL-387785, lapatinib, and lapatinib M1 were metabolized by AO, but erlotinib and gefitinib were not. All of these compounds, except for lapatinib, have fairly simple and similar substituents on the aniline moiety. Interestingly, the AO substrates contain two substitutions to the quinazoline ring system, and the nonsubstrates contain a third. Terminal pyrimidine and pyridine groups were also found to be sites of AO metabolism, with AMG900, bafetinib, and imatinib being the primary examples. Interestingly, no metabolism of vatalanib, with its sterically unhindered pyridine, was detected. It is probable that the dual ring system, such as the bipyrimidine of bafetinib, is required for metabolism. Further, despite a single atom difference between bafetinib and imatinib in the half of the molecule containing the site of metabolism, there is an enormous difference in the rates of metabolism by AO (2- and >500-minute half-lives, respectively). Additionally, the bipyrimidine of bafetinib was subjected to multiple sequential oxidations by AO. Together these data suggest that regions distal to the site of metabolism of an AO substrate may be important and should be considered when predicting AO metabolism.
Published in vivo human metabolite data are available for two of the AO substrates identified in this study: imatinib and lapatinib (Gschwind et al., 2005; Castellino et al., 2012). Oxidation of the pyridine of imatinib was not observed in excreta and these data are in accord with the low level of in vitro human AO activity detailed above. With approximately 10-fold greater imatinib turnover observed in cynomolgus monkey liver cytosol, AO metabolism may be more significant in this species. In vivo evidence of human AO lapatinib metabolism was demonstrated with the identification of metabolite M3. This metabolite along with M1 were major excretion products in human 14C–absorption, distribution, metabolism, and excretion studies representing up to 18% and 19% of the dose, respectively (Castellino et al., 2012). In the present study, M3 was found to be the product of AO oxidation of M1, and lapatinib was also metabolized directly to lapatinib AO-M1 (Fig. 7). With two possible pathways for M3 formation, further investigation is required to determine whether AO is a significant primary metabolizer of lapatinib in vivo. Although not identified in vivo, significant levels of lapatinib AO-M1 are observed in human hepatocyte incubations (data not shown).

Possible metabolic routes for lapatinib M3 formation.
Two additional methods were investigated for identifying AO substrates in a drug discovery setting, namely comparison of HLM and hepatocyte stability and the effect of an AO inhibitor on hepatocyte stability (Pryde et al., 2010; Strelevitz et al., 2012; Hutzler et al., 2013). Neither of these methods monitor AO metabolism directly; rather, they measure the ratio of AO metabolism to other metabolic processes. In both cases they leverage a system with diminished AO activity (i.e., HLM and hepatocytes with hydralazine) and compare with a system with full AO activity (i.e., hepatocytes without inhibitor). For compounds predominantly metabolized in hepatocytes by AO, both of these approaches should work. However, for compounds that are predominately metabolized by P450s, these approaches may fail to identify a significant minority contribution by AO. The sensitivity of each approach is largely determined by the inherent error rates and temporal limitations of the assays. Considering that each of these approaches involves the comparison of the results of two independent assays, which carry an assumed 20% degree of error, a requirement that roughly one-third of the metabolism of a compound should be mediated by AO may register a significant positive result.
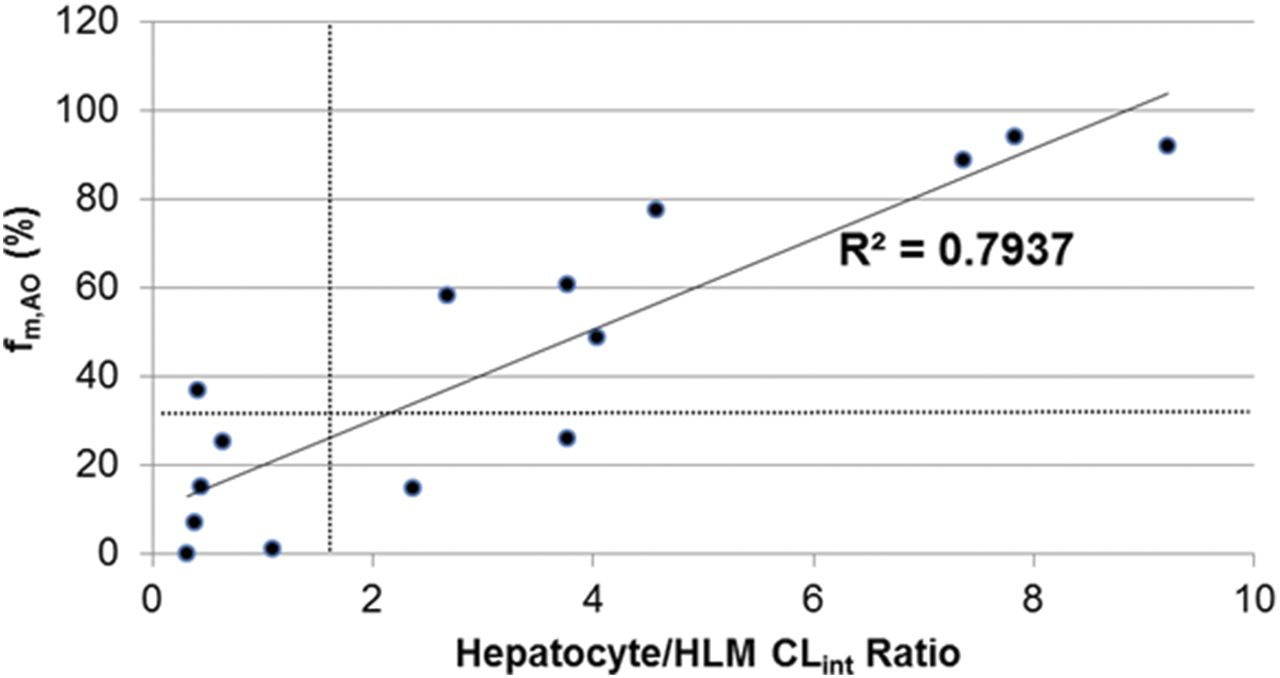
Neither the hepatocyte/HLM CLint ratio nor the fm,AO approach were able to identify all of the AO substrates found using the cytosol assay; success rates of 64% were observed for both approaches. Four compounds (imatinib, INCB28060, lapatinib, and VX-509) in addition to midazolam were not identified in either assay. Comparison of the magnitudes of the hepatocyte/HLM CLint ratio and fm,AO (Fig. 8) show a decent correlation (R2 = 0.79); however, it is assumed that this would diminish if more compounds were included that were primarily metabolized by enzymes other than AO and microsomal mono-oxygenases (for example, a compound that is primarily glucuronidated should display a high hepatocyte/HLM ratio and low fm,AO). For the substrates investigated in this study, the lower limits of each approach appear to correlate reasonably well: A 1.5-fold hepatocyte/HLM CLint ratio translates roughly to a 33% fm,AO. These data indicate that either assay could be useful for identifying an AO substrate that is metabolized primarily by AO in hepatocytes; however, neither is suitable when other metabolic processes predominate. Although the hepatocyte/HLM CLint ratio approach could produce a significant number of false positives, a ratio less than 1.5 should be sufficient for determining that AO metabolism is not the major metabolic pathway in hepatocytes.

Comparison of two alternative approaches for identification of AO substrates. For a subset of identified AO substrates, the human hepatocyte/HLM CLint ratio is plotted against the fm,AO determined in human hepatocytes using 50 μM hydralazine. A linear regression (solid) line is presented and the dashed lines denote estimates of the lower limits of quantitation for each assay.
The cytosol-based assay detailed in this study monitors AO metabolism directly and as a result is an efficient and sensitive method for detection of AO substrates. By incorporating a scan for a characteristic hydroxylated metabolite, a positive result in this assay is definitive and requires little follow up for confirmation. As a complement, however, measurement of the fm,AO would be useful for indicating the significance of this metabolic pathway. Considering the ease and sensitivity of the cytosol-based assay, its use is recommended as the primary screen for compounds suspected of bearing an AO metabolism–based liability. Hopefully, as the number of identified AO substrates increases, so will the predictability and understanding of the molecular characteristics required for AO metabolism.
Acknowledgments
The author thanks Bernard Murray, Bill Smith, and Jennie Chin for their support and/or careful review of this manuscript.
Authorship Contributions
Participated in research design: Dick.
Conducted experiments: Dick.
Performed data analysis: Dick.
Wrote or contributed to the writing of the manuscript: Dick.
Footnotes
- Received February 14, 2018.
- Accepted March 30, 2018.
Abbreviations
- AO
- aldehyde oxidase
- CLint
- intrinsic clearance
- DMSO
- dimethyl sulfoxide
- fm,AO
- fraction of metabolism in hepatocytes catalyzed by AO
- HLM
- human liver microsomes
- LC-MS
- liquid chromatography–mass spectrometry
- LC-MSn
- liquid chromatography–multistage mass spectrometry
- NAT
- N-acetyltransferase
- P450
- cytochrome P450
- PAR
- peak area ratio
- Copyright © 2018 by The American Society for Pharmacology and Experimental Therapeutics


