


Abstract
The endocannabinoid system is important for many physiologic and pathologic processes, but its role in the regulation of liver cytochromes P450 (P450s) remains unknown. We studied the influence of the endocannabinoid oleamide on rat and human liver P450s. Oleamide was administered intraperitoneally to rats at doses of 0.1, 1, and 10 mg/kg per day for 7 days. The content and activity of key P450s were evaluated in rat liver microsomes. Moreover, interactions with nuclear receptors regulating P450 genes and serum levels of their ligands (prolactin, corticosterone, and free triiodothyronine) were tested in in vitro P450 inhibition assays. Decreased protein levels and metabolic activities of CYP1A2, CYP2B, and CYP2C11, along with a drop in metabolic activity of CYP2D2, were observed in animals treated with oleamide (10 mg/kg per day). The activities of CYP2C6, CYP2A, and CYP3A and the levels of hormones were not altered. In vitro, oleamide exhibited a weak inhibition of rat CYP1A2, CYP2D2, and CYP2C6. The activities of rat CYP2A, CYP2B, CYP2C11, and CYP3A and human CYP1A2, CYP2B6, CYP2C9, and CYP3A4 were not altered. Oleamide did not interact with human pregnane X, constitutive androstane, or aryl hydrocarbon receptors in reporter gene experiments and did not regulate their target P450 genes in primary human hepatocytes. Our results indicate that oleamide caused the downregulation of some rat liver P450s, and hormones are not mediators of this effect. In vitro oleamide inhibits mainly rat CYP2C6 and is neither an agonist nor antagonist of major human nuclear receptors involved in the regulation of xenobiotic metabolism.
Introduction
The endocannabinoid system (ECS) is an essential regulator of many physiologic processes, such as memory, brain plasticity, thermogenesis, nociception, energy balance, digestion, motility, and fertility (Aizpurua-Olaizola et al., 2017). Therefore, it is not surprising that changes in ECS activity are involved in many pathophysiological processes in the central nervous system, as well as in the peripheral tissues (Pertwee, 2015). The ECS is a signaling system that consists of cannabinoid receptors CB1 and CB2; their endogenous ligands (endocannabinoids); and associated proteins for their synthesis, transport, and degradation. Endocannabinoids are metabolized mainly by enzymatic hydrolysis via fatty acid amide hydrolase (FAAH) and monoacylglycerol lipase, but some endocannabinoids can also be sensitive to oxidative metabolism by cyclooxygenase, lipoxygenase, and cytochrome P450 enzymes (P450s) (Sugiura et al., 2002; Snider et al., 2010). N-arachidonoyl-ethanolamine (anandamide) and 2-arachidonoyl-glycerol are two of the best studied endocannabinoids (Di Marzo et al., 1998). Apart from these two, oleamide (syn. cis-9,10-octadecenoamide, cis-9-octadecenamide, oleic acid amide) is another molecule of interest because of its role in sleep regulation (Obal and Krueger, 2003). It was first identified in the cerebrospinal fluid of sleep-deprived cats (Cravatt et al., 1995). Because of their similar structures, oleamide and anandamide evoke similar effects (Divito and Cascio, 2013) including sleep induction (Herrera-Solis et al., 2010), hypothermia, hypomotility, and analgesia (Smith et al., 1994; Fedorova et al., 2001). Oleamide is an agonist of CB1 receptors (Leggett et al., 2004). Moreover, it can act as an alternate substrate for FAAH and thus increases the relative half-life and effects of anandamide (Fowler et al., 2001). Synthetically produced oleamide has been used in industry for a long time as a lubricant in the production of plastic materials (Garrido-Lopez et al., 2006) and as a thickener and emulsifier in cosmetics (Flick, 2012).
P450s are the major enzymatic systems of drug metabolism. In particular, the subfamilies CYP3A, CYP2C, CYP2D, CYP2B, and CYP1A are essential for the biotransformation of xenobiotics in humans. It is known that many cannabinoids are not only substrates of P450s, but they can also change the activity of these enzymes. Nowadays, therapeutically used phytocannabinoids (Δ9-tetrahydrocannabinol, cannabidiol) and synthetic cannabinoids (dronabinol and nabilone) are known to modulate the activity of P450s in in vitro and in vivo models (Zendulka et al., 2016). Their main indications in clinical practice include nausea and vomiting associated with cancer chemotherapy, pain, and spasticity (May and Glode, 2016; Keating, 2017). In addition, the ECS is a promising target for new therapeutic strategies for other diseases (e.g., psychiatric disorders, obesity, diabetes, and osteoarthritis (Aizpurua-Olaizola et al., 2017). Thus, its possible role in the regulation of the activity of P450s would be of great interest. Nevertheless, none of the endocannabinoids have been tested for their influence on liver P450s yet.
We focused on oleamide as a candidate endocannabinoid for our study because of its known ability to activate the ECS by various mechanisms (CB1 receptor and FAAH enzyme). Moreover, the wide use of oleamide in the plastics industry has made it a possible pollutant, and therefore knowledge of its effect on P450s would be beneficial.
The aim of this work was to investigate the influence of the endocannabinoid oleamide on the activities of key rat and human P450s involved in drug metabolism. For this purpose, in vitro P450 interaction assays and an in vivo rat model were used. To obtain additional data about the possible mechanism of oleamide’s influence on P450s we also measured the serum concentrations of hormones known to be involved in the regulation of P450 metabolic activity, namely, prolactin, corticosterone, and free triiodothyronine. Finally, the interactions of oleamide with human nuclear receptors that regulate the expression of P450 genes, namely, the pregnane X receptor (PXR), aryl hydrocarbon receptor (AhR), and constitutive androstane receptor (CAR), were also tested. The ability to induce their target P450 genes was examined in primary human hepatocytes.
Material and Methods
Chemicals
The following compounds were provided by Sigma-Aldrich (St. Louis, MO): oleamide (CAS no. 301-02-0), prednisone, testosterone, chlorpropamide, phenacetin, diclofenac, 4′-hydroxydiclofenac, acetaminophen, ibuprofen, dextromethorphan, dextrorphan, laudanosine, triethylamine, NADP, glucose-6-phosphate dehydrogenase, glucose-6-phosphate, MgCl2, EDTA, KH2PO4, Na2HPO4, sucrose, NH4HCO3, CH3COOH, NH3, KCl, bovine serum albumin, dimethylsulfoxide (DMSO), α-naphthoflavone, ketoconazole, fluconazole, ticlopidine, rifampicin, CITCO (6-(4-chlorophenyl)imidazo[2,1-b][1,3]thiazole-5-carbaldehyde O-(3,4-dichlorobenzyl)oxime), and 3-methylcholanthrene. Propylene glycol was obtained from Fagron (Olomouc, CZE). The metabolites of testosterone, namely, 2β-, 2α-, 7α-, 6β-, 16α-, and 16β-hydroxytestosterone, were purchased from Steraloids Inc. (Newport, RI). The primary and secondary antibodies, which were used for Western blotting analyses, are described in detail in Table 1. Chemicals and organic solvents for high-performance liquid chromatography (HPLC) analysis were purchased from Lach-ner (Neratovice, CZE) and they were of an HPLC-gradient or LC-mass spectroscopy (MS) grade. Cell culture media, nonessential amino acids, and fetal bovine serum were purchased from Thermo Fisher Scientific, Inc. (Waltham, MA).
Primary and secondary antibodies used for Western blotting
Animals
The experiments were carried out on male Wistar albino rats (230 ± 20 g), which were purchased from the Masaryk University breeding facility (Brno, CZE). The rats were housed under standard laboratory conditions (22 ± 2°C room temperature; 55% ± 5% room humidity; 12-hour light/dark cycle). Animals had free access to water and food. All experiments were performed in accordance with Czech act no. 246/1992 and with the approval of both the regional and national Czech Central Commission for Animal Welfare (MSMT-35 473/2012-30).
Experimental Design
After 5 days of acclimatization, the rats were randomly divided into five experimental groups. All animals were treated intraperitoneally for 7 consecutive days. Three groups (n = 10/group) were administered oleamide dissolved in propylene glycol at doses of 0.1, 1, and 10 mg/kg per day The doses of oleamide used in our experiment were selected according to preclinical studies in which oleamide evoked various kinds of biologic activities (Fedorova et al., 2001; (Huitron-Resendiz et al., 2001). The control group was treated with the appropriate volume of the vehicle (propylene glycol 1 ml/kg, n = 6). Because there were no data on the influence of propylene glycol on P450s, a group of animals administered saline (1 ml/kg, n = 10) was also used. All animals were sacrificed under ether anesthesia by decapitation 24 hours after the last drug/vehicle administration, and the samples of liver tissue were drawn immediately without any liver perfusion and frozen at −80°C.
Preparation of Rat Liver Microsomes and Determination of Total Protein and P450 Content
Rat liver microsomes (RLMs) were isolated from 3 g of liver tissue from each individual animal. Each liver tissue sample was homogenized in 20 mM Tris/KCl buffer (pH 7.4). RLMs were then isolated from the homogenate by differential ultracentrifugation (19,000g, 20 minutes and 2× 105,000g, 60 minutes) in 20 mM Tris/KCl buffer (pH 7.4), including washing with 0.15 M KCl. The final pellet was reconstituted with 0.25 M Tris/sucrose buffer (pH 7.4) to yield 1 ml of RLMs from each gram of isolated tissue and stored at −80°C. The total protein content in the microsomal preparations was assessed according to the method of Lowry et al. (1951) using bovine serum albumin as a standard. Determination of total P450 content was assessed using a CO difference spectroscopy method according to Omura and Sato (1964). The total protein content and total P450 content are expressed as milligrams of protein per milliliter and nanomoles of P450/ml of RLMs, respectively. RLMs were reconstituted in volume of Tris/sucrose buffer to resemble the original liver tissue content.
Determination of P450 Activity in RLM
Assessment of the relative activity of CYP1A2, CYP2B, CYP2C, CYP2D2, and CYP3A enzymes were based on the rate of biotransformation of a specific marker in RLMs with an NADPH-generating system according to the previously described method of Wojcikowski et al. (2008), with a slight modification. The incubation mixture of the final 0.5 ml volume contained a phosphate buffer (50 mM; pH 7.4), EDTA (1.1 mM), NADP (1.2 mM), glucose-6-phosphate (4.4 mM), MgCl2 (3.2 mM), glucose-6-phosphate dehydrogenase (1 U/ml), RLMs (1 mg/ml of total protein content), and a specific marker for determination of the selected P450 enzymes activity. The reaction was stopped after incubation at 37°C in a shaking water bath by the addition of 50 µl of methanol and cooling in ice. The concentrations of markers and their specific metabolites were measured with one of two HPLC systems: a Shimadzu LC-10 (Shimadzu, Tokyo, Japan) with a DAD detector (SPD-M10AVP) and a fluorescence detector (RF 10AXL) or a Dionex UltiMate 3000RS LC (Thermo Fisher Scientific) with a DAD detector. Reaction rates exhibited a linear relationship to the incubation time and protein concentration under the above-mentioned conditions. The relative metabolic activities of all P450s were studied by measuring the rates of P450-specific reactions and were expressed as a molar concentration of the metabolite per minute per milligram of the total protein in RLMs. The specific metabolic activities were also calculated with respect to the total P450 content and are expressed as the molar concentration of the metabolite per minute per nanomolar of total P450 content. The accuracy and precision of the HPLC methods were below 10% of relative standard deviation within the calibration range. The calibration range always included the concentrations of analytes in the measured samples.
Determination of CYP1A2 Activity.
The rate of phenacetin O-deethylation was used for CYP1A2 activity assessment. The substrate concentration was 300 µM and the incubation period was 20 minutes. After the addition of the internal standard (chlorpropamide) to the incubation mixture, the analytes were extracted from the microsomal suspension with diethyl ether (4 ml, 10 minutes of horizontal vortexing, 1400 rpm), the organic phase was evaporated, and the residue was dissolved in 250 µl of the mobile phase. The following gradient mode of separation was applied: 0:00–5:00 minutes, 90:10 (v/v 0.1% NH4CH3COO/acetonitrile, pH 4.6); from 5:00 to 6:00 minutes, 35:65; and from 6:00 to the end of the analysis at 8:00 minutes, 90:10. The separation of acetaminophen, phenacetin, and chlorpropamide was achieved using Kinetex, 2.6 μm PFP 100A column (150 × 4.60 mm; Phenomenex, Torrance, CA) thermostatted at 45 ± 0.1°C, at a flow rate of 1.2 ml/min, and UV detection at 245 nm.
Determination of CYP2A, CYP2B, CYP2C11, and CYP3A Activity.
Testosterone 7α-, 16β-, 2α-, and 16α-, 2β-, and 6β-hydroxylations were used for the activity assessment of CYP2A, CYP2B, CYP2C11, and CYP3A, respectively. The substrate concentration was 400 µM, prednisone was used as the internal standard, and the incubation time was 15 minutes. The separation conditions for testosterone metabolite determination have been described in detail previously (Dovrtelova et al., 2015).
Determination of CYP2C6 Activity.
Diclofenac 4′-hydroxylation was used for measuring CYP2C6 activity, and the substrate concentration was 100 µM. Ibuprofen was used as the internal standard, and the incubation time was 20 minutes. The separation conditions for diclofenac and 4′-hydroxydiclofenac determination have been described in detail previously (Noskova et al., 2016).
Determination of CYP2D2 Activity.
Dextromethorphan O-demethylation was used for measuring CYP2D2 activity. The substrate concentration was 500 µM, and the incubation time was 20 minutes. After addition of the internal standard (laudanosine) and Na2CO3 (250 µl, 0.5 M) to the incubation mixture, the analytes were extracted from the microsomal suspension with 4 ml of 1-butanol:hexane mixture (1:9). The organic phase was decanted, and 300 µl of 0.01 M HCl was added. After 10 minutes of horizontal shaking at 1400 rpm, the samples were frozen. The organic layer was discarded, and a 5 µl portion of the aqueous phase was injected into the HPLC system. The separation of dextrorphan, dextromethorphan, and laudanosine was achieved in an isocratic separation mode with fluorescence detection according to the method of Zimova et al. (2000).
Western Blotting
Western blot analyses were used to detect the protein expression of CYP2B1/2, CYP3A1, CYP1A2, and CYP2C11 in RLMs. Individual samples were mixed with a loading buffer (0.125 M Tris pH 6.8, 20% glycerol, 10% mercaptoethanol, 4% SDS, 0.004% bromphenol blue), boiled for 5 minutes at 95°C, and separated on a 12% SDS-PAGE gel; 10 μg of RLMs was loaded per lane. After electrophoresis, proteins were electrotransferred (100 V, 75 minutes) onto polyvinylidene fluoride membranes (Merck Millipore, Darmstadt, DEU), which were blocked with 5% nonfat milk in Tris-buffered saline with 0.08% Tween 20 at room temperature for 1 hour. The membranes were incubated with primary antibodies overnight at 4°C, followed by incubation with the appropriate secondary antibodies for 1 hour at room temperature. The antibodies were dissolved according to Table 1, and the β-actin antibody was used as a loading control for normalization. Where necessary, the membranes were stripped in a stripping buffer (74.3:25:10:0.7 H2O:1 M Tris (pH 7.4):20% SDS:β-mercaptoethanol), washed, and reblotted with another antibody. The intensities of the bands on the membranes were visualized using Immobilon Western Chemiluminescent HRP Substrate (Millipore, Watford, GBR) and FUSION SL (Vilber Lourmat, DEU). The Western blots were quantified using the software ImageJ (version 1.48; National Institutes of Health, Bethesda, MD). Statistical analyses were done using at least three repetitions of individual animals of each group.
P450 Inhibition Assay In Vitro
RLMs from drug-naïve control animals, which were pooled from four individuals, were used for a direct inhibition assay in vitro. The incubation mixtures were processed as described in the section Determination of P450 Activity in R, except the final volume was 1 ml and the total protein content in RLMs was 0.25 mg/ml. Each sample was prepared in triplicate. After 10 minutes of preincubation with a different concentration of oleamide (see to follow) at 37°C in a shaking water bath, reactions were initiated by the addition of specific markers. The incubation times were 40 minutes (phenacetin and dextromethorphan), 20 minutes (testosterone), and 30 minutes (diclofenac).
First, pilot experiments were performed with single concentrations of the substrates phenacetin (300 µM), testosterone (100 µM), diclofenac (8 µM), or dextromethorphan (28 µM), and three concentrations of oleamide (0.1, 1, and 100 µM). Based on this experiment, we decided to perform only the inhibition assay of CYP2C6 (with diclofenac as a probe substrate). The kinetic parameters of CYP2C6 metabolic activity were determined using Michaelis-Menten kinetics. For construction of the Dixon plot and determination of the inhibition constant (Ki), diclofenac was used at concentrations of 4, 8, and 16 µM, oleamide at 0, 10, 25, 37.5, and 50 µM.
P450 Enzymatic Activity Assays
Human recombinant CYP3A4, CYP2B6, CYP2C9, and CYP1A2 enzymes expressed in a microsomal fraction of P450 cDNA baculovirus-infected insect cells (CYP450-Glo CYP3A4 Assay, CYP450-Glo CYP2B6 Assay, CYP450-Glo CYP2C9 Assay, and CYP450-Glo CYP1A2 Assay; Promega, Hercules, CA) were used to evaluate the interaction of oleamide with these enzymes in vitro according to the manufacturer’s protocols. Ketoconazole, ticlopidine, fluconazole, and α-naphthoflavone were used as prototypical inhibitors of CYP3A4, CYP2B6, CYP2C9, and CYP1A2 enzymes.
Nuclear Receptors and Cell Viability Assays
Cell Lines.
A HepG2 human Caucasian hepatocyte carcinoma cell line was purchased from the European Collection of Cell Cultures (ECACC, Salisbury, GBR) and maintained in Dulbecco’s modified Eagle’s medium (DMEM) supplemented with 10% fetal bovine serum, 1% nonessential amino acids, and 2 mM l-glutamine (Sigma-Aldrich).
Cell Viability Assay.
To evaluate the toxicity of oleamide in HepG2 cells, a CellTiter 96 AQueous One Solution Cell Proliferation Assay (Promega, Madison, WI) was performed according to the manufacturer’s protocol.
Plasmids.
The construction of the PXR-responsive p3A4-luc construct containing XREM and basal promoter sequences and pSG5-hourPXR expression construct have been described by Rulcova et al. (2010). The AHR reporter plasmid (pXRE-luc) was described in our previous report (Dvorak et al., 2008). The pRL-TK construct was purchased from Promega. The constructs pCAR-C/VP16 and pCAR-N/GAL4 for the CAR assembly assay have been described in a previous paper of ours (Carazo Fernandez et al., 2015).
Reporter Gene Assays (PXR, AhR).
All transient transfection gene reporter assays were performed with LipofectAMINE 3000 transfection reagent (Invitrogen/Life Technologies, Carlsbad, CA) in HepG2 cells. Briefly, cells were seeded onto 48-well plates and 24 hours later were transfected with a luciferase reporter construct (150 ng/well), PXR expression plasmid (100 ng/well, for PXR experiments), and Renilla reniformis luciferase transfection control plasmid (pRL-TK) (30 ng/well). Then, the cells were stabilized for 24 hours before treatment and further maintained in phenol red–free medium (150 µl) containing the evaluated compounds at the indicated concentrations for an additional 24 hours. After treatment, the cells were lysed, and luciferase activity was measured (Dual Luciferase Reporter Assay; Promega). Two modes were used as follows: 1) agonistic mode, in which the cells were treated with 0.1% DMSO or prototype ligand 5 µM or three concentrations of oleamide 1 or 10 or 30 µM; 2) antagonistic mode, in which the cells were treated with 0.2% DMSO or with prototype ligands (5 µM) in combination with oleamide at concentrations of 1 or 10 or 30 µM. Rifampicin (PXR activator) and 3-methylcholanthrene (AhR activator) were used as the prototype ligands. The data are expressed as a fold-change in firefly luciferase activity normalized to Renilla luciferase activity in each sample and relative to the vehicle (DMSO 0.1%)-treated control means, which were set to 1. Statistical analyses were done using at least three independent assays (n = 3) performed in triplicate.
Assembly Assay (CAR).
The CAR ligand binding domain (LBD) assembly assay is based on two hybrid expression constructs encoding the C- (pCAR-C/VP16) and N- (pCAR-N/GAL4) terminal parts of human CAR LBD that are cotransfected together with the pGL5-luc luciferase reporter plasmid (Promega) containing upstream activating sequence binding sites. A ligand promotes the connection of the two parts of the CAR LBD, resulting in luciferase transactivation. Transient transfection assays were carried out using LipofectAMINE 3000 transfection reagent (Invitrogen/Life Technologies) in HepG2 cells. Cells were seeded into 48-well plates and transfected with a pGL5-luc luciferase reporter construct (80 ng/well), the expression constructs pCAR-C/VP16 and pCAR-N/GAL4 (80 ng/well), and the Renilla reniformis luciferase transfection control plasmid (pRL-TK) (30 ng/well) 24 hours later. Cells were maintained in a phenol red–free medium (150 µl) and treated with the tested compounds. After treatment, the cells were lysed, and luciferase activity was measured with a luciferase detection system (Dual Luciferase Reporter Assay; Promega). Two modes were used as follows: 1) agonistic mode, in which the cells were treated with 0.1% DMSO or CITCO (CAR activator) 5 µM or three concentrations of oleamide, 1 or 10 or 30 µM; and 2) antagonistic mode, in which the cells were treated with 0.2% DMSO or CITCO 5 µM in combination with oleamide at concentrations of 1 or 10 or 30 µM. The data are expressed as the fold-change in firefly luciferase activity normalized to Renilla luciferase activity in each sample and relative to the vehicle (DMSO 0.1%)-treated control means, which were set to 1. Statistical analyses were done using at least three independent assays (n = 3) performed in triplicate.
Primary Cultures of Human Hepatocytes and Quantitative Reverse Transcription Polymerase Chain Reaction.
Human long-term hepatocytes in a monolayer (batch HEP220971; Biopredic International, Saint Grégoire, France) were prepared from the livers of a 46-year-old Caucasian man. The medium was replaced with a serum-free medium the day after delivery of the primary human hepatocytes, and the cultures stabilized for an additional 48 hours before treatment. The cultures were maintained at 37°C in 5% CO2 in a humidified incubator and treated with oleamide (10 μM) together with prototype CAR (CITCO, 1 μM), PXR (rifampin, 10 μM), and AHR (3-methylcholantrene, 10 μM) ligands for 48 hours before the total RNA isolation. cDNA synthesis and quantitative reverse transcription polymerase chain reaction (qRT-PCR) analyses were performed as described previously (Rulcova et al., 2010).
Hormone Assays
Serum concentrations of corticosterone were analyzed by radioimmunoassay after dichloromethane extraction as described previously (Jezova et al., 1994). The intra-assay and interassay coefficient of variation values were 6% and 8%, respectively, and the sensitivity of the assay was 0.5 µg/100 ml of plasma. The concentrations of free triiodothyronine and prolactin in serum were measured using commercially available enzyme-linked immunoassay (ELISA) kits (rat-free triiodothyronine ELISA kit and Prolactin rat ELISA; Cusabio Technology, Houston, TX, respectively). The intra- and inter-assay precision of the kits (coefficient of variation %) were less than 15%. The sensitivity and detection range reported by the manufacturer were 0.125 and 0.125–50 ng/ml for prolactin and 0.38 and 2–32 pmol/liter for triiodothyronine, respectively.
Data Analysis
The results of the determination of P450 activities were statistically evaluated using either 1) parametric one-way analysis of variance (ANOVA), followed by Tukey’s honestly significant difference test for unequal sample sizes with a normal distribution of data; or 2) nonparametric Kruskal-Wallis test followed by multiple comparisons of mean ranks for all groups with a non-normal distribution of data. The statistical evaluation of the results from Western blot analyses was performed using the Wilcoxon signed-rank test. One-way ANOVA with a Dunnett’s post hoc test were used for data from nuclear receptor assays, human P450 inhibition assays, and primary hepatocytes assays. The nonparametric Mann-Whitney U test was used to compare the hormone levels in two sets of samples. All values are expressed as means (S.D.), and they were computed using the software Statistica 13 (TIBCO Software, Palo Alto, CA). Results were considered statistically significant when P ≤ 0.05. The Ki value was determined using a Dixon plot and calculated with the software SigmaPlot (SPSS, Inc., Chicago, IL). The Michaelis-Menten parameters (Km and Vmax) and the kinetic pattern of inhibition were also assessed using SigmaPlot.
Results
Effect of Oleamide on Liver P450 Activity In Vivo
In preliminary experiments, we evaluated how propylene glycol (a vehicle of oleamide) influenced the total microsomal protein, P450 levels, and their metabolic activity. We found no statistical difference comparing these results with experiments with saline-treated animals (data not shown). Hence, propylene glycol-treated animals were further used as controls for oleamide-administered animals.
Total Protein and Total P450 Content.
Animals administered the highest dose of oleamide exhibited a significant decrease in the content in both total protein (P < 0.05, Kruskal-Wallis test, Fig. 1A) and P450 (F(4,41) = 4.89 P < 0.01, one-way ANOVA test; Fig. 1B) in RLMs compared with controls. The relative content of P450, representing the ratio of P450 to total protein content (nanomoles per milligram of isolated protein in RLMs) was calculated, and again there was a significant decrease (F(4,41) = 4.89, P < 0.01, one-way ANOVA test) in the group treated with the highest dose of oleamide compared with the group treated with propylene glycol alone (Fig. 1C).

Changes in total protein content (A), total P450 content (B), and relative content of P450 (C) (nanomoles per milligram of microsomal protein) after systemic administration of oleamide. The total protein content in individual RLMs was assessed according to the method of Lowry et al., and the total P450 content was determined using a CO difference spectroscopy method according to Omura et al. Animals were treated intraperitoneally with oleamide 0.1 (n = 10), 1 (n = 10), 10 mg/kg per day (n = 10), and propylene glycol (control group, n = 6). Bars and whiskers express the mean (S.D.). Statistical significance was assessed by Kruskal-Wallis test followed by multiple comparisons of mean ranks (A and C) and one-way ANOVA test followed by Tukey’s significant difference test for unequal sample sizes (B). Statistical significance with respect to the control group (propylene glycol) is indicated with *P ≤ 0.05.
P450s Metabolic Activity.
The incubation of RLMs isolated from oleamide-treated animals with selective markers of P450 metabolic activity resulted in a variety of effects, depending on the P450 isoform. None of the tested oleamide doses influenced the relative or specific metabolic activities of CYP2A and CYP2C6 (Fig. 2, A and B; Fig. 3, A and D respectively) (for definitions of relative and specific metabolic activity, see section Determination of P450 Activity in RM). The rate of testosterone 2β and 6β-hydroxylation decreased to 77% of the control value. Nevertheless, the change in CYP3A relative activity was not statistically significant (Fig. 2A). In contrast, the relative activities of the CYP1A (F(4,41) = 6,33 P < 0.001, one-way ANOVA test, Fig. 3B), CYP2B, CYP2C11 (P < 0.01, Kruskal-Wallis test, Fig. 2A), and CYP2D2 (F(4,40) = 7,42 P < 0.001, one-way ANOVA test, Fig. 3C) were significantly decreased in animals treated with the highest dose of oleamide. Lower doses of oleamide were incapable of decreasing the relative metabolic activity of the P450s. Specific metabolic activities with respect to the total content of P450 did not exhibit any differences between the oleamide-treated animals and controls in their CYP1A2 (Fig. 3E), CYP2D6 (Fig. 3F), or CYP2B (Fig. 2B). An exception was CYP2C11 (Fig. 2B), where the activities of both the 2α-, and 16α-hydroxylations of testosterone were decreased in the group treated with the highest dose of oleamide (one-way ANOVA test F(4,39) = 8,22 P < 0.001 and F(4,41) = 5,31 P < 0.001, respectively).

(A) Relative metabolic activities of CYP2A, CYP2B, CYP3A, and CYP2C11 after systemic administration of oleamide, measured as the rate of testosterone hydroxylation and shown as the percentage of the rate of reaction in the control group. The absolute control values (picomoles per minute per milligram of total protein content) were as follows: 217.4 ± 23.7, 37.5 ± 6.1, 76.2 ± 14.8, 614.8 ± 92.0, 3303.0 ± 779.0, and 2934.5 ± 791.6 (testosterone 7α-, 16β-, 2β-, 6β-, 2α-, and 16α- hydroxylations, respectively). Animals were treated intraperitoneally with oleamide 0.1 (n = 10), 1 (n = 10), 10 mg/kg per day (n = 10), and propylene glycol (control group, n = 6). Reactions were performed in the presence of testosterone (400 µM) in RLMs (1 mg/ml of the total protein content) with an NADPH-generating system in a final volume of 1 ml at 37°C for 20 minutes. (B) Specific metabolic activities of CYP2A, CYP2B, CYP3A, and CYP2C11 after systemic administration of oleamide measured as the rate of testosterone hydroxylation per nanomoles of total P450 content per minute and shown as the percentage of the rate of reaction in the control group. The absolute control values (picomoles per minute per nanomoles of total P450 content) were as follows: 350.8 ± 38.8, 60.3 ± 8.2, 122.5 ± 20.2, 989.5 ± 127.0, 5321.8 ± 1188.7, and 4726.4 ± 1209.4 (testosterone 7α-, 16β-, 2β-, 6β-, 2α-, and 16α- hydroxylations, respectively). All values are expressed as bar graphs of the mean (S.D.). Statistical significance was assessed by the Kruskal-Wallis test, followed by multiple comparisons of mean ranks (A) and one-way ANOVA test (B). Statistical significance with respect to the control group (propylene glycol, n = 6) is indicated with **P ≤ 0.01.
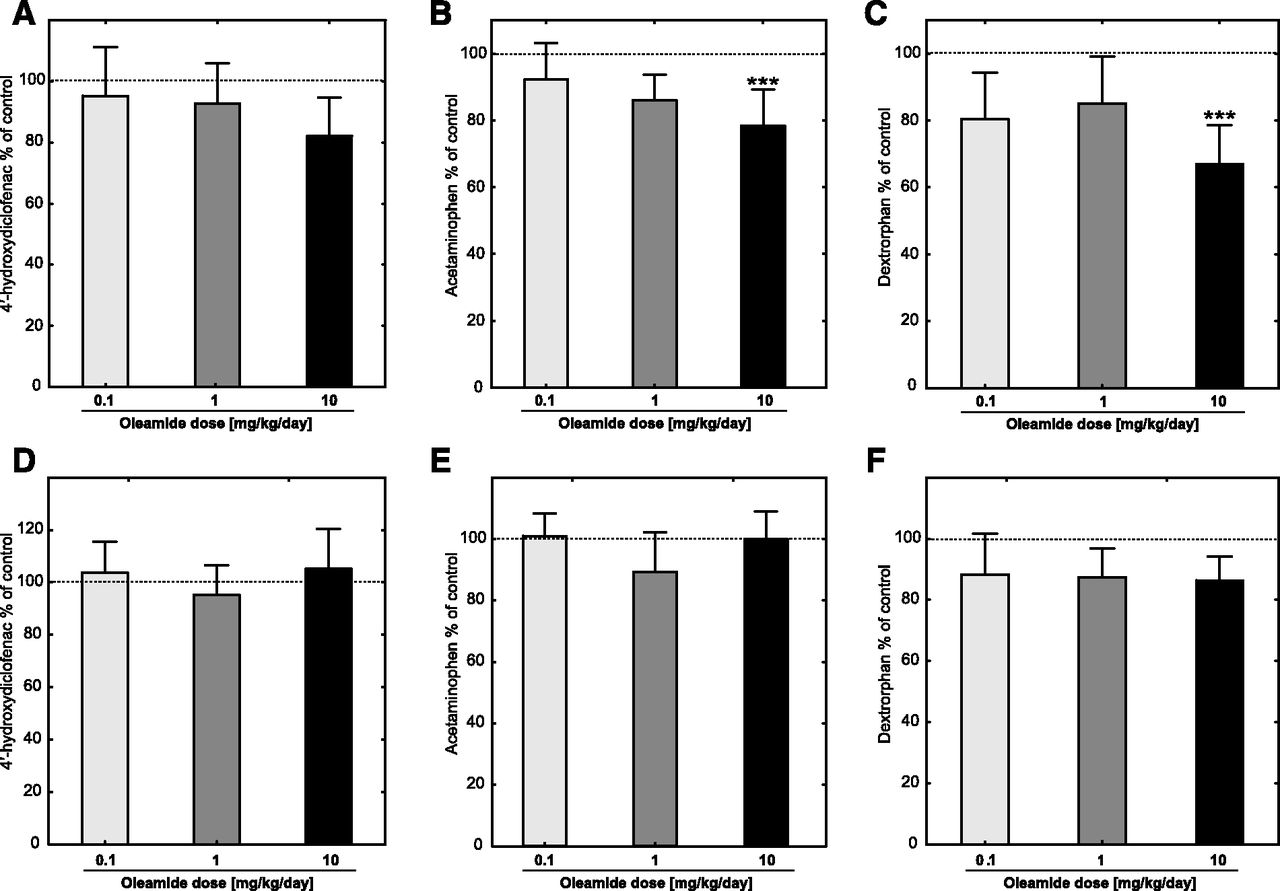
(A) Relative metabolic activity of CYP2C6 after systemic administration of oleamide, measured as rate of diclofenac 4′-hydroxylation and shown as the percentage of the rate of reaction in the control group. The absolute control value was 1194.4 ± 184.4 pmol/min per milligram of total protein content. (B) Relative metabolic activity of CYP1A2 after systemic administration of oleamide, measured as the rate of phenacetin O-deethylation and shown as the percentage of the rate of reaction in the control group. The absolute control value was 361.3 ± 21.5 pmol/min per milligram of total protein content. (C) Relative metabolic activity of CYP2D2 after systemic administration of oleamide, measured as rate of dextromethorphan O-demethylation and shown as the percentage of the rate of a reaction in the control group. The absolute control value was 1154.9 ± 135.0 pmol/min per milligram of total protein content. Animals were treated intraperitoneally with oleamide, 0.1 (n = 10), 1 (n = 10), 10 mg/kg per day (n = 10), and propylene glycol (control group, n = 6). Reactions were performed in the presence of diclofenac (100 µM), phenacetine (400 µM), or dextromethorphan (500 µM) in RLMs (1 mg/ml of the total protein content) with the NADPH-generating system in a final volume of 1 ml at 37°C for 15 minutes (phenacetine) or 20 minutes (diclofenac and dextromethorphan). (D–F) Specific metabolic activities of CYP2C6, CYP1A2, and CYP2D6 after systemic administration of oleamide measured as the rate of testosterone hydroxylation per nanomoles of total P450 content per minute and shown as the percentage of the rate of reaction in control group. The absolute control values (picomoles per minute per nanomoles of total P450 content) were as follows: 1926.3 ± 292.4, 582.48 ± 23.4, and 1859.5 ± 169.2 (diclofenac 4′′-hydroxylation, phenacetin O-deethylation, and dextromethorphan O-demethylation, respectively). Bars and whiskers express the mean (S.D.). Statistical significance was assessed by one-way ANOVA test, followed by Tukey’s significant difference test for unequal sample sizes. Statistical significance with respect to the control group (propylene glycol, n = 6), is indicated with ***P ≤ 0.001.
Content of Distinct P450s.
The amount of distinct P450 proteins was determined only for P450s with a significant change in the relative metabolic activity, with the exception of CYP2D2, because the monoclonal antibody was not available. In addition, the protein content was measured for CYP3A, where the decrease in metabolic activity was on the threshold of statistical significance. Blots were quantified, and the decrease in protein levels was present in all evaluated P450s after the 10 mg/kg per day treatment with oleamide (Fig. 4). The most influenced enzyme was CYP1A2, with a decrease in protein content to 33.6% ± 12% of the amount determined in the control group, followed by CYP3A (41.9% ± 12% of the control group). The amount of CYP2B and CYP2C11 decreased similarly to 54.5% ± 8% and 53.2% ± 1.3% of the control group, respectively.

Western blot analysis showing the expression of CYP1A2, CYP2B, CYP2C11, and CYP3A1 enzymes in RLMs after systemic administration of oleamide. Animals were treated intraperitoneally with oleamide 0.1 (n = 10), 1 (n = 10), 10 mg/kg per day (n = 10), and propylene glycol (control group, n = 6). (A) Representative blots of three individual animals of each group show expression of each indicated protein (10 µg in all cases). (B–E) Bar graphs show quantification of blots for CYP1A2, CYP2B, CYP2C11, and CYP3A1 protein, respectively. The bars represent means (S.D.) of individual animals of each group in three repetitions. Blots were quantified relative to the loading control (β-actin). Statistical significance was assessed by Wilcoxon signed-rank test and is shown as **P ≤ 0.01; ***P ≤ 0.001 compared with the control.
Effect of Oleamide In Vitro
Rat P450 Inhibition Assays In Vitro.
The results of the pilot study when oleamide was incubated with RLMs from naïve animals showed that oleamide did not influence the activities of CYP2A, CYP2B, CYP3A, and CYP2C11 (Table 2). The metabolic activities of these enzymes ranged from 97% to 101% of the activity of the control group in all analyzed testosterone metabolites and at all concentrations of oleamide used. Nevertheless, oleamide weakly inhibited phenacetin O-demethylation, indicating a weak inhibition of CYP1A2 activity. The rate of the reaction was suppressed to 77% of the rate of the control at a 100 μM concentration of oleamide in the incubation mixture. With CYP2D2, it was similarly observed that the metabolic activity of the enzyme was suppressed up to 70% of the rate of the control at a 100 μM concentration of oleamide. Such a high concentration of any drug is usually clinically irrelevant. Together with the fact that the inhibition of metabolic activities was very weak, the Ki value was not assessed for CYP1A2 and CYP2D2.
P450s interactions with oleamide in vitro (data from the pilot experiment)
The metabolic activities of CYP2A, CYP2B, CYP3A, and CYP2C11 were measured as the rate of testosterone hydroxylation. The absolute control values (picomoles per milligram of protein per minute) were as follows: 1866.7 ± 0.9, 1773.7 ± 0.4, 2080.4 ± 3.5, 2123.9 ± 5.0, 1773.6 ± 0.8, 1825.6 ± 1.3 (testosterone 7α-, 16β-, 2α-, 16α-, 2β-, and 6β- hydroxylation, respectively). The metabolic activity of CYP1A2 was measured as the rate of phenacetin O-deethylation and control value of 53.3 ± 1.2 pmol/mg of protein per minute. The metabolic activity of CYP2C6 was measured as the rate of diclofenac 4′-hydroxylation and the control value 203.8 ± 11.3 pmol/mg of protein per minute. The metabolic activity of CYP2D2 was measured as the rate of dextromethorphan O-demethylation and a control value of 320.2 ± 7.6 pmol/mg of protein per minute. Experiments were performed with single concentrations of substrates phenacetin (300 µM), testosterone (100 µM), diclofenac (8 µM), or dextromethorphan (28 µM) and three concentrations of oleamide in RLMs from naïve animals (0.25 mg/ml of the total protein content) with the NADPH-generating system in a final volume of 1 ml at 37°C. After 10 minutes of preincubation with a different concentration of oleamide, reactions were initiated by the addition of specific markers. The incubation times were 40 (phenacetin and dextromethorphan), 20 (testosterone), and 30 minutes (diclofenac). All reactions were performed in triplicate.
CYP2C6 was the most sensitive P450 to the inhibitory effect of oleamide in the pilot study (Table 2). We determined the kinetic parameters of CYP2C6 metabolic activity by using Michaelis-Menten kinetics (Km = 7.2 ± 0.94 µM, Vmax = 1.03 ± 0.04 nmol/min per milligram of protein). The 4′-hydroxylation of diclofenac was inhibited by 56%, with a final concentration of oleamide in the incubation mixture of 100 μM. Thus, further studies to determine the type of inhibition were done. Competitive, noncompetitive, and uncompetitive models of inhibition were evaluated; the respective Ki values were 28.7, 71.6, and 28.9 µM. The Akaike’s Information Criterions corrected (AICc) in the individual models were used to evaluate the suitability of each model. The values of AICc were −652.591, −648.078, and −634.012 for the competitive, noncompetitive, and uncompetitive models, respectively. Therefore, the competitive mode of inhibition seems to be an appropriate model with the best fit (Fig. 5).

Dixon plot of the effect of oleamide on 4′-hydroxydiclofenac formation in RLMs from naïve animals in a competitive model of inhibition. Reactions were performed in the presence of diclofenac (4, 8, 16 µM) and various concentrations of oleamide (0, 10, 25, 37.5, 50 µM) in RLMs (0.25 mg/ml of the total protein content) with the NADPH generating system in a final volume of 1 ml at 37°C for 30 minutes after 10 minute preincubation. The reaction was performed in triplicate. V = velocity of the reaction (nanomoles of 4′hydroxydiclofenac per minute per milligram protein) and I = concentration of oleamide (μM).
Nuclear Receptors and Cell Viability Assays.
Oleamide was tested at a range of concentrations from 1 to 30 µM for interaction with PXR, CAR, and AhR in HepG2 cells by gene reporter assays. We found no significant activation by the compound for any of these receptors (Fig. 6). Consistently, we did not observe inhibition of these nuclear receptors in antagonistic experiments with prototype PXR, CAR, and AhR ligands (rifampicin, CITCO, 3-methoxychlorantrene, respectively) (Fig. 6).

Interaction of oleamide with PXR, AhR, or CAR in luciferase assays in HepG2 cells in agonistic (A, C, and E) and antagonistic (B, D, and F) modes. In the agonistic mode, cells were treated with 0.1% DMSO (control) or with prototype ligands (5 µM) or three concentrations of oleamide 1, 10, or 30 µM. In the antagonistic mode, cells were treated with prototype ligands (5 µM) in combination with oleamide at concentrations of 1, 10, or 30 µM. Rifampicin (RIF, PXR activator), 3-methylcholanthrene (3-MC, AHR activator), and CITCO (CAR activator) were used as prototype ligands. The data are expressed as the fold-change in firefly luciferase activity normalized to Renilla luciferase activity in each sample and relative to the vehicle (DMSO)-treated control means, which were set to 1. Statistical analyses were performed using at least three independent assays (n = 3) performed in triplicate, and statistical significance was assessed by one-way ANOVA followed by Dunnett’s test.
In addition, potential cytotoxicity was studied with the CellTiter 96 assay in HepG2 cells. The results clearly showed that oleamide is not toxic at the highest concentration assayed (30 μM) in HepG2 cells (data not shown).
Human P450 Inhibition Assays and Induction Experiments in Primary Human Hepatocytes by Oleamide.
In the next set of experiments, we studied whether oleamide could inhibit human CYP2B6, CYP2C9, CYP3A4, and CYP1A2 enzymes in vitro and whether it could induce key P450 genes regulated by the xenobiotic nuclear receptors CAR, PXR, and AHR.
We found that oleamide inhibits none of tested human P450s up to a concentration of 30 μM (Fig. 7, A–D). With CYP2B6, we observed an insignificant inhibition of metabolic activity at a 30 μM concentration of oleamide (Fig. 7A.).

Oleamide does not affect CYP2B6, CYP2C9, CYP3A4, and CYP1A2 enzymatic activities in vitro and mRNA expression in primary human hepatocytes. It does not inhibit metabolic activities of human CYP2B6 (A), CYP2C9 (B), CYP3A4 (C), and CYP1A2 (D), enzymes expressed in the microsomal fraction of P450 cDNA baculovirus-infected cells. Assays were performed in three independent experiments (n = 3) measured in triplicate. (E) qRT-PCR experiment in primary human hepatocytes treated with oleamide (10 μM), CITCO, RIF, or 3-methylcholantrene (3-MC) for 48 hours before total RNA isolation and qRT-PCR analysis were done. Data are presented as the means (S.D.) of triplicates from a representative batch of primary human hepatocytes (human long-term hepatocytes in monolayer, batch HEP220971, Biopredic) and are expressed as the fold mRNA upregulation relative to the vehicle-treated controls (set to 100%). Statistical significance was assessed by one-way ANOVA, *P ≤ 0.05; ***P ≤ 0.001.
We then treated primary human hepatocytes with 10 μM oleamide and CAR (CITCO, 1 μM), PXR (rifampicin, 10 μM), and AhR (3-methylcholantrene, 10 μM) ligands. We observed a significant induction of CYP2B6 mRNA by CITCO, CYP3A4 mRNA by rifampicin, and CYP1A2 mRNA by 3-methylcholantrene after 48 hours of treatment (Fig. 7E). Oleamide slightly upregulated CYP2B6, CYP3A4, and CYP1A2 mRNA (2.0-, 2.5-, and 3.3-fold, respectively), but the effects were not statistically significant.
Serum Hormone Concentrations
We found no statistical differences between control and oleamide-treated animals in serum levels of any of the hormones measured (Fig. 8).

Effect of systemic administration of oleamide on hormone concentrations in rat blood serum. Animals were treated intraperitoneally with oleamide 10 mg/kg per day (n = 10) and propylene glycol (control group, n = 6). Bar graphs show concentrations of free triiodothyronine (A), prolactin (B), and corticosterone (C). The bars represent means (S.D.) of individual animals of each group in three repetitions. Statistical significance was assessed by Mann-Whitney U test.
Discussion
In this study, we demonstrate the effect of the endocannabinoid oleamide on rat liver content and activities of key liver P450s, namely, CYP1A2, CYP2A, CYP2B, CYP2C, CYP2D2, and CYP3A. The in vivo effect was assessed after the repeated administration of three different doses of oleamide to rats (0.1, 1, and 10 mg/kg per day). The doses were selected with respect to available data for oleamide biologic activity, including hypnogenic (10–20 mg/kg, i.p.) (Huitron-Resendiz et al., 2001), analgesic (ED50 = 66 mg/kg, i.p.) (Fedorova et al., 2001), hypothermic (ED50 = 14 mg/kg, i.p.; 2.5–20 mg/kg, i.p, respectively) (Fedorova et al., 2001; Huitron-Resendiz et al., 2001), anxiolytic (5 mg/kg, i.p.) (Fedorova et al., 2001), and antidepressant-like (5 mg/kg, i.p.) (Ge et al., 2015) effects in animal experiments. Our results showed that oleamide at a dose of 10 mg/kg per day decreased the total protein content, as well as the total P450 protein levels in liver (Fig. 1); however, the metabolic activities of the individual tested P450s varied (Figs. 2 and 3). The overall decrease in the relative metabolic activity could be interpreted in two ways. It could be caused by an inhibition of P450 enzymes in terms of a decreased ability to catalyze the conversion of substrate to the appropriate metabolite with the preserved amounts of enzyme. The other possibility is the downregulation of P450s, meaning decreased amounts of distinct P450 proteins with the preserved metabolic activity. In our study, the relative metabolic activities of P450s were assessed after the standardization per total protein content, but not per individual amount of P450s. Decreased levels of distinct P450s (Fig. 4) corresponded to their decreased relative metabolic activities (Figs. 2 and 3). When relative metabolic activities were recalculated to specific metabolic activities with respect to the total P450 content in the incubation mixtures, there were no significant changes in the rate of marker reactions between the tested groups, except for the decreased activity of CYP2C11 with the highest dose of oleamide (Fig. 2). The reduction in CYP2C11 activity was greater than could be explained by a simple decrease in total P450 content, but the exact mechanism of this influence is still under investigation. Based on the experimental data, we concluded that the metabolic activity of most enzymes in the in vivo experiment had not been affected. The decreased relative activities measured in our experiment were caused by P450 downregulation rather than by inhibition of enzymes, which is in line with the results of Western blot testing.
The effects of other endocannabinoids on the activity of P450s are unknown, and the influence of exogenous cannabinoid receptor ligands is diverse. In detail, the decrease in the microsomal protein content in experimental animals was reported after administration of the CB1 ligand (CP 55,940) to mice (Fontanellas et al., 2005) and rats (List et al., 1977; Dalterio et al., 1986; Costa et al., 1996). Cannabidiol also decreased the microsomal protein levels in human HepG2 cells (Yang et al., 2014) and inhibited metabolism of the selected P450 substrates in mice (Watanabe et al., 1981; Bornheim and Correia, 1989). On the other hand, studies suggesting that cannabinoids (CP55,940, hashish, and cannabidiol) would increase the content and/or activity of liver P450s in rodents have been published (Dalterio et al., 1986; Costa et al., 1996; Sheweita, 2003). The fact that these substances are usually of a different chemical structure with different biologic activity limits generalization of the results obtained using different cannabinoids as a general “class effect” of cannabinoids. Moreover, the ECS could have reacted differently to the same drug at different time points during drug administration, as mechanisms of desensitization, or receptor downregulation or upregulation might have been involved (Daigle et al., 2008; Burston et al., 2010).
The ECS, as a retrograde modulator, is associated with different neuronal systems within the brain, and therefore it can change the activities of several neurotransmitters in various brain regions. It has been documented that changes in the activity of these specific neuronal circuits could influence the activity of liver P450s. Hormones were identified as a probable link between the brain and liver (Wojcikowski et al., 2008; Wojcikowski and Daniel, 2011; Bromek et al., 2013; Rysz et al., 2016). Although exogenous cannabinoids have long been known to be modulators of pituitary hormones (Pagotto et al., 2006), the influence of endocannabinoids on the neuroendocrine system has not been fully understood. Endocannabinoids modulate the levels of growth hormone (Pagotto et al., 2006), thyrotropin-releasing hormone (Deli et al., 2009), corticotrophin-releasing hormone (Steiner and Wotjak, 2008; Hill and Tasker, 2012), prolactin, and luteinizing hormone (de Miguel et al., 1998), probably via the hypothalamus, where the ECS acts as a retrograde messenger system. Hormones then bind to nuclear receptors in hepatocytes and regulate P450 gene expression. Therefore, the ECS is probably involved in the regulation of the metabolic activity of liver P450s as well. This hypothesis was described in detail elsewhere (Zendulka et al., 2016). In our study, oleamide did not influence the levels of prolactin, corticosterone, or free triiodothyronine (Fig. 8). Therefore, we expect these hormones not to be included in the mechanism of liver P450 activity being influenced by oleamide.
The interactions of oleamide with the key human nuclear receptors involved in regulation of major P450s were further tested to obtain additional data on the possible influence of this endocannabinoid in humans. The results showed that oleamide did not interact with human AhR, PXR, or CAR nuclear receptors either in an agonistic or antagonistic mode (Fig. 6). Consistently, oleamide did not induce CYP2B6, CYP2C9, or CYP3A4 mRNA expression in a representative primary human hepatocyte culture (Fig. 7E).
The direct inactivation of rat P450s by oleamide in RLMs was tested in our in vitro model. Weak inhibition of CYP1A2, CYP2D2, and, more noticeably, CYP2C6 are described in Table 2. Similarly, the direct inhibition of P450s by phytocannabinoids, such as cannabidiol, cannabinol, and Δ9-THC, were reported (Zendulka et al., 2016). All three substances inhibited the metabolic activity of P450s with various potencies. Differences between the results obtained from two models used in our study can be explained by the divergent modes of how the metabolic activity of P450s can be influenced. In an in vitro experiment, the drug could have bound either to the active or to the allosteric site of P450s and decreased the metabolic activity by direct enzyme inactivation. Livers isolated from animals treated with oleamide were drawn 24 hours after the last dose of drug was administered and microsomes were washed out several times with buffers during the process of isolation. Therefore, the microsomes were thought to be “drug free.” This was proved by there being no change in the metabolic activity of CYP2C6 detected in the in vivo model compared with the results of the in vitro model, where CYP2C6 was inhibited, and conversely by a decreased metabolic activity of CYP2C11 assessed in vivo, with no influence in vitro. Furthermore, the direct interaction with enzymes could not explain the decreased P450 protein levels, which were detected for CYP1A2, CYP2B, CYP2C11, and CYP3A after repeated systemic administration of oleamide (Figs. 2–4). These findings further support our conclusion that the influence of oleamide on rat P450s was mediated by the mechanism of downregulation. Besides the direct interaction of oleamide with RLMs, we tested its interaction with human recombinant P450s (CYP2B6, CYP2C9, CYP3A4, and CYP1A2), finding insignificant effects (Fig. 7, A–D).
In conclusion, we hypothesize that the repeated intraperitoneal administration of oleamide (10 mg/kg per day) caused the downregulation of CYP1A2, CYP2B, CYP2C11, and CYP2D2 in rats. The effect is unlikely to be caused by the direct inhibition of P450 enzymes or by oleamide influencing the hormonal levels. The mechanism of this effect has not yet been determined. Although oleamide inhibited rat CYP1A2, CYP2D2, and CYP2C6 enzymes, it did not interact with the tested recombinant human cytochromes in vitro. We observed no effect on human AhR, PXR, and CAR nuclear receptors in the regulation of main human P450s in the primary human hepatocytes. To the best of our knowledge, we are the first to report the effects of the endocannabinoid CB1 agonist and the FAAH inhibitor oleamide on rat and human P450s. Our results suggest the possible involvement of the endocannabinoid system in the regulation of rat liver cytochrome activity. Still, oleamide affected neither the activity of human recombinant P450s nor the expression of mRNA of P450s in human primary hepatocytes. The effects observed in rat P450 enzymes are likely to be species-specific, and the clinical impact needs to be elucidated in future studies.
Acknowledgments
We thank Vitezslav Bryja and his laboratory for help and support and Roman Reminek and Roberta Frapolli for their help.
Authorship Contributions
Participated in research design: Dovrtelova, Zendulka, Jurica, Pavek.
Conducted experiments: Dovrtelova, Zendulka, Noskova, Jurica, Dusek, Pes, Carazo, Zapletalova, Hlavacova.
Performed data analysis: Dovrtelova, Carazo.
Wrote or contributed to the writing of the manuscript: Dovrtelova, Zendulka, Carazo.
Footnotes
- Received November 20, 2017.
- Accepted April 4, 2018.
This work was supported by Specific University Research Grant at Masaryk University [Grants MUNI/A/1132/2017, MUNI/A/0910/2017], project of Grant Agency of Czech Republic [Grant GA16-06106S], and grant of Czech Neuropsychopharmacological Society.
Abbreviations
- AhR
- aryl hydrocarbon receptor
- ANOVA
- analysis of variance
- CAR
- constitutive androstane receptor
- CB
- cannabinoid
- CITCO
- (6-(4-chlorophenyl)imidazo[2,1-b][1,3]thiazole-5-carbaldehyde O-(3,4-dichlorobenzyl)oxime)
- DMSO
- dimethylsulfoxide
- ECS
- endocannabinoid system
- ELISA
- enzyme-linked immunosorbent assay
- FAAH
- fatty acid amide hydrolase
- HPLC
- high-performance liquid chromatography
- LBD
- ligand binding domain
- P450
- cytochrome 450
- PXR
- pregnane X receptor
- RLMs
- rat liver microsomes
- Copyright © 2018 by The American Society for Pharmacology and Experimental Therapeutics


